*
E-mail: [email protected]
E-mail: [email protected]
A Systematic Framework for Implementing Six
Sigma in the Landside of Marine
Container Terminals
Nooramin, Amir Saeed1*; Ahouei, Vahid Reza2; Sayareh, Jafar2
1- Faculty of Maritime Economics and Management, Khoramshahr University of Marine Science and Technology, Khoramshahr, IR Iran
2- Faculty of Navigation and Marine Engineering, Chabahar Maritime University, Chabahar, IR Iran
Received: December 2011 Accepted: February 2012
© 2012 Journal of the Persian Gulf. All rights reserved.
Abstract
In this research, an accurate optimization model, based on the Six Sigma methodology was used in order to assists marine container terminal operators to minimize trucks congestions. to smooth gate activity and to shorten trucks turn-around times. The main purpose of this paper is to report findings of implementing the Six Sigma in the landside of marine container terminals to reduce the average number of trucks in queues and average trucks waiting times in both entrance and exit gates. Risk Priority Numbers (RPNs) obtained from the FMEA analysis denoted that additional control procedures and associated inspections were needed as monitoring tools on the working time and activity of weighbridge operators and truck drivers. In addition, serious consideration should be given to appraisal of operators performance and improving of administrative systems.
Keywords: Six Sigma, DMAIC, FMEA, Container terminal, Track Congestion
1. Introduction
Sigma (σ) is the letter in the Greek alphabet used to represent standard deviation, a statistical measurement of variation and the exceptions to expected outcomes. Standard deviation can be thought of as a comparison between expected results or outcomes in a group of operations versus those that fail. The measurement of standard deviation shows that rates of defects or exceptions are measurable. With six standard deviations, we arrive at 3.4 defects per million opportunities, or 99.9997 percent. The purpose in evaluating defects is not only to eliminate them
entirely, but also to strive for improvement to the highest possible achievable level.
Six Sigma as a systematic framework for quality improvement and business excellence has been popularized for more than a decade (Goh, 2002). It is best suited to organizations with repetitive and routine operations for specified outcomes. Six Sigma efforts achieve three main areas through three historical generations:
• The 1st Generation, 1987-1994, which focuses on
reducing defects,
• The 2nd Generation, 1994-2000, which focuses on
reducing cycle time, and
• The 3rd Generation, 2000 to date, which focuses
Journal of the Persian Gulf
(Marine Science)/Vol. 3/No. 8/June 2012/11/55-66
on improving customer satisfaction.
In general, container terminals can be described as open systems of material flow with two external interfaces. These interfaces are the quayside designed for loading and unloading of ships, and the landside where containers are loaded and unloaded on/off the trucks (Steenken et al., 2004). Most terminals are taking measures to increase their throughput and capacity by:
• Introducing new technologies,
• Optimizing equipment dwell-times,
• Increasing storage density,
• Optimizing ship turn-around times
• Optimizing truck turn-around times (Huynh and
Walton, 2005).
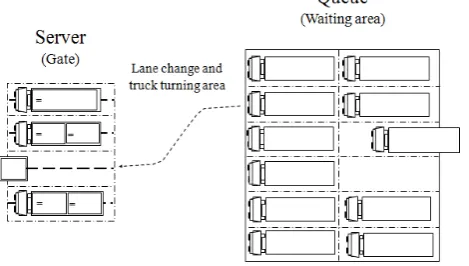
In todays global marketplace, container terminals are regarded as Server-Customer (Queue) systems wherein servers and customers are variable based on the different operational viewpoints. Figure 1 represents the Server-Queue system designed based on the purpose of this study.
Fig. 1: Server-Queue system in marine container terminals
In this paper, a novel Six Sigma methodology is used to find and reduce defects in the server (gate area) and to improve customer satisfaction via decreasing the turn-around time of the trucks, trucks queue and reducing the overall transfer cost of containers in their supply chain cycle.
1.1. Review of Related Literature
Based on the nature of this study, the literature is
reviewed in two different sections, namely Six Sigma philosophy and marine container terminals.
1.1.1. Six Sigma Philosophy
Six Sigma explicitly links the tactical activities with those strategic ones (Yang and Hsieh, 2009). Six Sigma programs improve operational performance in order to enhance customer satisfaction with a company's products and services (Rajagopalan et al., 2004). Hahn et al. (2000) described Six Sigma as a disciplined and statistically based approach for improving product and process quality. Six Sigma is at the top of agenda for many companies that try to reduce costs and improve productivity (Kumar et al., 2008).
Kwak and Anbari (2006) summarized Six Sigma as a strategy, which includes Total Quality Management (TQM), strong customer focus, additional data analysis tools, financial results and project management in order to satisfy customer needs. Naumann and Hoisington (2001) indicated that the concept of Six Sigma was the development of a uniform way to measure and monitor performance and set extremely high expectations and improvement goals.
Das (2005) studied Six Sigma in its Generation II and used it to reduce procurement delays. Su and Chou (2008) proposed a systematic methodology which aimed to identify the procedures of Six Sigma project generation, evaluation and mapping. Chakravorty (2009) developed an effective implementation Six Sigma model which consisted of six steps, including, performing strategic analysis, establishing a high-level team, identifying overall improvement tools, prioritizing improvement opportunities, developing a detailed plan, and implementation.
Scheroeder et al. (2008) used the grounded theory
approach in the Six Sigma theory. They identified
many critical elements of Six Sigma projects such as
management involvement, improvement specialists,
performance metrics, a systematic procedure and
project selection.
Journal of the Persian Gulf (Marine Science)/Vol. 3/No. 8/June 2012/11/55-66
1.1.2. Marine Container Terminals
Many varieties of container terminals exist mainly depending on which type of handling equipments are combined to form a terminal system. Koshnevis and Asef-Vaziri (2000) defined three performance analysis variables including throughput, space utilization and equipment utilization. Kozan (2000) discussed the major factors influencing the transfer efficiency of seaport container terminals by developing a network model. Nishimura et al. (2001) implemented Lagrange's method for optimizing the container yard operation. Similar studies in this field were carried out by Nam and Ha (2001), Lie et al. (2002), Vis and de Koster (2003), and Murty et al. (2003).
Berth planning problems may be formulated as a different combination of optimization problems, depending on the specific objectives, and restrictions that have to be observed. Legato and Mazzo (2001), Nishimura et al. (2001), Imai et al. (2005), Moorthy and Teo (2006) have all carried out numerous studies on berth planning problems. Lee and Chen (2009) optimized the berth operation by evaluating different arrival patterns. Nowadays, the logistics activities, especially at large container terminals, have reached a degree of complexity that further improvements through interaction of scientific solutions are required. Simulation models have become the viable tools for decision-making in port activities. Kia et al. (2002) investigated the role of computer simulation in evaluating the performance of a container terminal in relation to its handling techniques and the impact it made on the capacity of terminal. Parola and Sciomachen (2005) presented a discrete event simulation modelling approach related to the logistic chains of an intermodal network. Bielli et al. (2006) provided a help-tool in a port decision support system implementing simulation via Java environment. Froyland et al. (2008) presented an algorithm to manage the container exchange facility, including the allocation of delivery locations for trucks and other container carriers. Zeng and Yang (2009) developed
a simulation optimization method for scheduling loading operations in container terminals.
The time trucks spend at a terminal for loading/unloading of cargo (truck turn-around time) is a real cost scenario which affects the overall cost of the container trade. Historically, truck turn-around times have received a very little attention from terminal operators because landside congestions have never been a barrier to their smooth operations. Truck turn-around times are the times that a truck takes to complete an activity such as picking up an import container. As shown in the studies conducted by Regan and Golob (2000), Klodzinski and Al-Deek (2002) and Huynh and Walton (2005), by optimizing the truck turn-around times and thereby, the landside shipping cost, terminals would gain a competitive advantage in the industry. Murty et al. (2005) have described a variety of inter-related decisions made during daily operations at a container terminal. Their goal was to minimize the waiting time of customer trucks.
To date, no study has adequately examined the philosophy of Six Sigma in marine container terminals as a managerial decision-making optimization tool in strategic/operational levels. The challenging issues inherent in this problem and the limitation of existing research, robustly motivates this study. For the first time in the literature, this research provides a novel decision-making framework for port operators to smoothing the gate activities and reducing truck congestion.
1.2. Problem Statement
The objective of this research is to minimize trucks congestions at the main gates of the container terminal of the Shahid Rajaee Port Complex (SRPC), the major Iranian seaport, and hence to reduce the truck's turn-around times. Generally, weighbridges are regarded as one of the main hindered movement stations in port operation, which cause long queues of trucks. The SRPC is equipped with six main
automatic weighbridges in following patterns:
• Two are located near the main entrance of the gate
complex,
• Two are located near the exit gate, and
• Two are located at the transit yard where only one
of them is operational.
Even though the case study is unique and distinctive of its kind, the general processes and characteristics are similar to a typical container terminal as shown in Figure 2.
Since there are usually long queues of trucks waiting in the container yard for weighting operation, this research develops a Six Sigma model to find problems, defects and barriers in weighting operation and proposes operational solutions for reducing truck waiting times via smoothing the gate activities.
2. Materials and Methods
2.1. Six Sigma Framework
Six Sigma projects are carried out through two different methodologies (2009):
• The Define, Measure, Analyze, Improve, and
Control (DMAIC) methodology for improving
existing processes and products, or
• The Define, Measure, Analyze, Design and Verify
(DMADV) methodology for designing new or innovative processes or products.
The DMADV is an enhancement to new product development process, not a replacement (2006). Actually it is a business process which concentrates on improving profitability. Respect to the statement of the SRPC problem, i.e. improving the trucks congestion, the DMAIC method suits with the research objective.
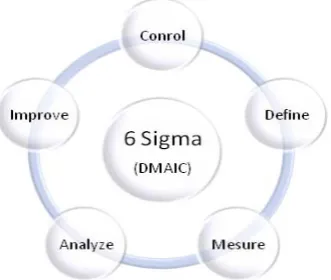
As shown in Figure 3, the DMAIC tactical approach to Six Sigma problem, involves five steps (2006):
• Define and set boundaries for problems,
• Measure problems, capabilities, opportunities, and
industry benchmark to determine the probable gap(s),
• Analyze causes of the problem through graphical
and statistical tools and determine how processes are working,
• Improve processes through reduction of variations
found in the processes
• Control implemented improvements, maintain
consistency, track progress financially and otherwise.
Fig. 2. Process of loading/discharging operation in marine container terminals
Fig. 3: Five Steps of the DMAIC method
Enter
Container
Exit
Road Trucks
Road Trucks
Delivering Export Containers
Picking up Import
Containers Quayside Operation
Road/Vessel Crane
Wieghbidges
Gate
Journal of the Persian Gulf (Marine Science)/Vol. 3/No. 8/June 2012/11/55-66
2.2. Proposed Method
As stated by Kumar (2006), the main idea behind
Six Sigma is that if the numbers of defects in a process
are measurable, it will be possible to systematically
figure out how to eliminate/reduce them to get as close
to zero defects as possible.
Achieving the purpose of this study and finding
the bottlenecks in the process of loading and
unloading operation, the following four main
patterns were examined:
• Arrival pattern of trucks at the main entrance of
the gate complex,
• Service pattern of weighbridges located at the both
entrance and transit gates,
• Departure patterns of trucks at main gate exit and
• Service patterns of weighbridges located at the
main exit of the gate complex.
After perusing the queue and waiting time,
histograms for both the entrance and exit and main
defects within them will be highlighted. This study
examined the applicability of the DMAIC method
using the following tools:
• SIPOC (Supplier – Input – Process – Output –
Customer) chart,
• Cause and effect diagram and
Failure Mode and Effect Analysis (FMEA) and
the data were gathered from the SRPC container
terminal during Jan. 2008 - Dec. 2009.
3. Results and Discussion
3.1. Define Phase
Define meant to establish the cause of a problem and to set the boundaries of the problem (2006) and was used to picture the process over time and provided insight about the areas which required improvement efforts.
3.2. SIOPC Chart
The SIOPC was used to analyze the business process mapping (2006) and contained the following terms:
• Supplier: A source or a group of sources that
provides the inputs to process.
• Input: Resources and information required to
complete the process.
• Process: A series of activities performing over one
or more inputs to produce the output according to the customer demands.
• Output: The product/service that results from the
process to satisfy customer demands.
• Customer: An individual/organization receiving
the final output.
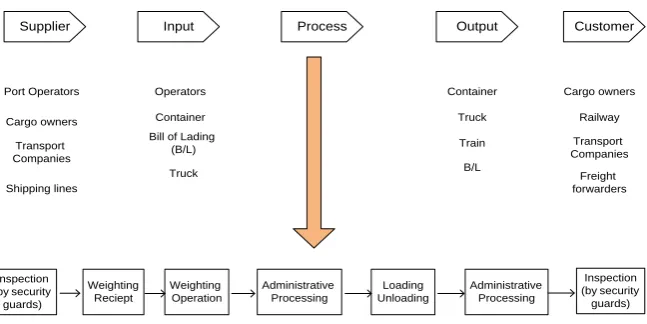
As mentioned earlier, marine container terminals can be adequately modeled as supplier-customer systems within which different service patterns could exist; thus, SIOPC charts were used for analyzing vast operations. Figure 4 represents the SIOPC chart of the case study.
Fig. 4: SIPOC chart (Loading/unloading operation of trucks)
Supplier Input Process Output Customer
Port Operators
Cargo owners
Transport Companies
Shipping lines
Operators
Container
Bill of Lading (B/L)
Truck
Container
Truck
Train
B/L
Cargo owners
Railway
Transport Companies
Freight forwarders
Inspection (by security
guards)
Weighting Reciept
Weighting Operation
Administrative Processing
Loading Unloading
Administrative Processing
Inspection (by security
guards)
Analysis of the SIOPC chart depicted that optimization of weighing operation was an important step for reducing congestion, achieving customer satisfaction and saving times/costs at loading/unloading operation of trucks. Therefore, Critical to Quality (CTQ) was the waiting time of trucks, which were weighed both at entrance and exit gates. With respect to the defined CTQ, data collection phase was planned due to waiting time of the entrance and exit gates for weighing operation of trucks.
3.2. Measuring Phase and Calculating Sigma Metric
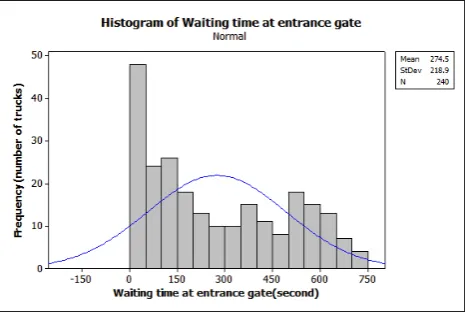
As per definition of CTQs explained earlier, data for waiting time of trucks in weighing operation at entrance and exit gates was collected and shown in Figures 5 and 6, respectively, using the MINITAB software.
Fig. 5: Waiting time histogram of trucks at the entrance gate with normal curve
Fig. 6: Waiting time histogram of trucks at the exit gate with normal curve
Based on the Central Limit Theorem (2006), both the arrival and departure patterns are fitted with the normal distribution. As shown in Fig5, the mean and standard (SD) deviations at the entrance gate were 274.5 and 218.9, respectively.
Values of the mean and standard deviation are 777.3 and 531.9, respectively (Figure 6). Accordingly, current and goal waiting time statistics are presented in Table 1.
Table 1. Current and goal waiting time statistics for weighing operation of trucks
Current statistics
Goal statistics Waiting time at queue
(second)
Queue of trucks
Sample
size (N) Mean SD Mean SD Entrance 240 274.5 218.5 60 60 Exit 78 777.3 531.9 200 200
Table 1 denotes short term goal statistics (take into account for this case due to the determination of the quantity of defects). Now, we assume the worst case scenario, wherein the long-term goal statistics may shift by 1.5 σ. Therefore, the longest acceptable waiting time satisfying the goal statistics would be:
= Goal mean + 4.5 (goal standard deviation) = 60 + (4.5 × 60) or 330 Seconds
The current sigma metric of the entrance gate was calculated in three steps:
Step 1- Entrance gate
This step was based on the calculation of the Z score for the current waiting time, i.e. 330 seconds. This was an acceptable limit of the goal waiting time:
Z = (Data point – mean value) / (standard deviation) = (330 – 274.5) / 218.9 = 0.2535
Thus, the acceptable limit of the goal waiting time was 0.2535.
Step 2- Entrance gate
The probability value at 0.2535 Z was obtained through an MS Excel spreadsheet as follows:
NORMSDIST (0.2535) = 0.600059
Journal of the Persian Gulf (Marine Science)/Vol. 3/No. 8/June 2012/11/55-66
Step 3- Entrance gate
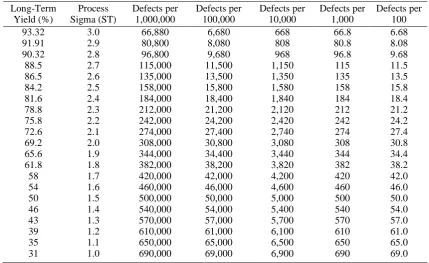
The probability value obtained in the step 2 was used in the Long-Term Yield column of Table 2 and the corresponding value is approximately computed 1.75 from the Process Sigma (ST) column in the mentioned Table. Therefore, the current waiting time for trucks at the entrance gate was 1.75 σ, approximately (in relation to the defined goal for the waiting time).
Current waiting time of the exit gate Sigma metrics for weighing operation of trucks could be similarly calculated:
= Goal mean + 4.5 (goal standard deviation)= 180 + (4.5 × 180)= 990 Seconds
Calculation steps of current sigma metric for exit gate were as follows:
Z score for the current waiting time, 990 seconds:
Z = (990 – 777.3) /531.9 = 0.3998
The probability value at 0.3998 Z was: NORMSDIST
(0.3998) = 0.655348
The probability value obtained in the step 2 was used in the Long-Term Yield column of Table 2. Then, the corresponding value was found to be
approximately 1.90 from the Process Sigma (ST) column in the same table. Therefore, the current waiting time for trucks is approximately at 1.90 σ (in relation to the defined goal for the waiting time).
Table 2 represents the quantity of defects per million opportunities for weighing operation of trucks (based on the goal statistics) at the entrance and exit gates which are were obtained as 399,941 and 344,652, respectively.
3.3. Analyze Phase
This phase attempts to identify the root causes of the major defects of the problem.
3.3. 1. Cause and Effect Diagram
Cause and effect diagram is an analysis tool that
provides a systematic way of looking at the effects
and at the causes that create or contribute to those
effects (2006). Figure 7 shows the cause and effect
diagram of the SRPC which was designed based on
the SIOPC chart.
Table 2. Sigma conversion to quantity of defects and long-term yield
Long-Term Yield (%) Process Sigma (ST) Defects per 1,000,000 Defects per 100,000 Defects per 10,000 Defects per 1,000 Defects per 100 93.32 91.91 90.32 88.5 86.5 84.2 81.6 78.8 75.8 72.6 69.2 65.6 61.8 58 54 50 46 43 39 35 31 3.0 2.9 2.8 2.7 2.6 2.5 2.4 2.3 2.2 2.1 2.0 1.9 1.8 1.7 1.6 1.5 1.4 1.3 1.2 1.1 1.0 66,880 80,800 96,800 115,000 135,000 158,000 184,000 212,000 242,000 274,000 308,000 344,000 382,000 420,000 460,000 500,000 540,000 570,000 610,000 650,000 690,000 6,680 8,080 9,680 11,500 13,500 15,800 18,400 21,200 24,200 27,400 30,800 34,400 38,200 42,000 46,000 50,000 54,000 57,000 61,000 65,000 69,000 668 808 968 1,150 1,350 1,580 1,840 2,120 2,420 2,740 3,080 3,440 3,820 4,200 4,600 5,000 5,400 5,700 6,100 6,500 6,900 66.8 80.8 96.8 115 135 158 184 212 242 274 308 344 382 420 460 500 540 570 610 650 690 6.68 8.08 9.68 11.5 13.5 15.8 18.4 21.2 24.2 27.4 30.8 34.4 38.2 42.0 46.0 50.0 54.0 57.0 61.0 65.0 69.0
Fig. 7: Cause and effect diagram (Loading/unloading operation of trucks)
As illustrated from the Figure 7, there are four main factors which caused truck congestion in the SRPC as follows:
• Port operators which work on different parts of the
SRPC,
• Port equipments (including both the hardware and
software),
• Trucks and their drivers and
• Owners of import/export/transit containers.
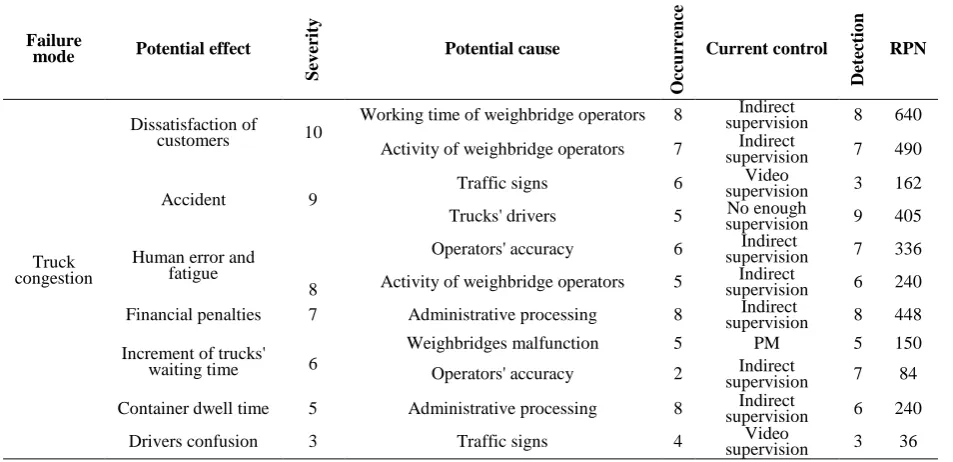
3.3.2. Failure Mode and Effect Analysis
As stated by Kumar (2006), FMEA is a structured and qualitative analysis of a system or function
which identifies potential system failure modes, their causes and the effects on the system operation associated with the failure mode's accuracy. Table 3 represents the FMEA of the SRPC problem, obtained according to the results of group brainstorming among the experts of the container terminal of the SRPC, based on the cause and effect diagram.
According to the results of the FMEA, followings are the main roots of congestion in the landside:
• Working time of weighbridge operators,
• Activity of weighbridge operators,
• Administrative processing,
• Trucks Drivers and
•
The accuracy ofoperators.
Table 3. FMEA for truck congestion at weighing operation step
Truck Congestion
Port Operators
Trucks
Port Equipment
Cargo Owners Working hours
Accuracy
Proficiency
Security guards
Crane operators
Weighbridge operators
Hardware & Software
Weighbridges
Landside cranes
Exhaustion Service patterns EDI implimentation Equipment defects
Port formalities
Custom formalities
Bill of Lading Exit pattern of trucks
Arrival pattern of trucks
Traffic signs
Drivers
Enter/exit processes
Failure
mode Potential effect
S
ev
eri
ty
Potential cause
O
ccu
rr
en
ce
Current control
D
et
ect
io
n
RPN
Truck congestion
Dissatisfaction of customers 10
Working time of weighbridge operators 8 supervision Indirect 8 640
Activity of weighbridge operators 7 supervision Indirect 7 490
Accident 9 Traffic signs 6
Video
supervision 3 162 Trucks' drivers 5 supervision No enough 9 405
Human error and fatigue
8
Operators' accuracy 6 supervision Indirect 7 336
Activity of weighbridge operators 5 supervision Indirect 6 240
Financial penalties 7 Administrative processing 8 supervision Indirect 8 448
Increment of trucks' waiting time 6
Weighbridges malfunction 5 PM 5 150
Operators' accuracy 2 supervision Indirect 7 84
Container dwell time 5 Administrative processing 8 supervision Indirect 6 240
Drivers confusion 3 Traffic signs 4 supervision Video 3 36
Journal of the Persian Gulf (Marine Science)/Vol. 3/No. 8/June 2012/11/55-66
Risk Priority Numbers (RPNs) obtained from the FMEA table denoted that additional control procedures and associated inspections were needed as monitoring tools on the working time and activity of weighbridge operators and truck drivers. In addition, serious consideration should be given to appraising of operator performance and improving the administrative systems, particularly during total working time of weighting operation.
3.3.4. Improvement Phase
Improvement phase focuses on reducing the amount of variations found in a process. The main concept behind this phase in the DMAIC method is that the suggestions are based on the analysis of the cause and effect diagram and the FMEA table, without any structural change in the system. `In this case, any factor which caused truck congestion was considered nonconformity. Table 3 shows a FMEA analysis of the perceived causes to truck congestion. The results suggested that the most relevant potential causes to address were operators working time (working time of weighting process) and their activity. The obtained results suggested that there should be more control (both direct/indirect) on the
weighbridge operators and weighting process aiming to increase the operational efficiency and accuracy.
4. Conclusion
Six Sigma is an accurate systematic framework for
quality improvement and business excellence which has not been academically used in marine industries. This paper proposed a novel Six Sigma methodology
aiming to reduce truck congestion in marine container terminals via smoothing the gate activities, in particular weighting process of trucks carrying
import/export/transit containers.
The DMAIC method along with the SIOPC chart, cause and effect diagram, and FMEA were used as
analysis tools in this research, focusing on managerial
operations in the entrance and exit gates of the SRPC as the case study.
Working time, activity and accuracy of weighbridge
operators, drivers of trucks, and administrative processing were the main causes of trucks congestion in the SRPC. As such, it is sugested followings be
considered for reducing trucks congestion:
• There should be more control on the weighbridge
working time.
• The service pattern of weighting operation should
be modified and changed to the normal distribution.
• The activity of weighbridge operators should be
under an accurate control system.
• There should be new traffic signs in the landside
area, aiming to reduce drivers confusion with the processes.
• EDI should be implemented in the administrative
processing, especially custom formalities and B/Ls.
References
Goh, T.N., 2002. A Strategic Assessment for Six Sigma, Quality and Reliability Engineering International. 18: 403-410.
Steenken, A., Vob, S. and Stahlbock, R., 2004. Container Terminal Operation and Operations Research- a Classification and Literature Review, OR Spectrum. 26: 3-49.
Huynh, N. and Walton, M, 2005. Methodologies for Reducing Truck Turn Time at Marine Container Terminals, MS Thesis, The University of Texas, USA.
Yang, T. and Hsieh, C.H, 2009. Six Sigma Project Selection Using National Quality Award Criteria and Delphi Fuzzy Multiple Criteria
Decision-Making Method. Expert Systems with
Applications. 36: 7594-7603.
Rajagopalan, R., Francis, M. and Suarez, W, 2004, Developing Novel Catalysts with Six Sigma, Research-Technology Management, 47 p: 13-16.
Hahn, G.J., Doganaksoy, N. and Horel, R., 2000, The Evaluation of Six Sigma, Quality Engineering. 12(3): 317-326.
Kumar, D., Nowicki, D., Marquez, J. and Verma, V, 2008. On the Optimal Selection of Process Alternatives in a Six Sigma Implementation, International Journal of Production Economics, 111: 456-467.
Kwak, Y.H. and Anbari, F.T., 2006. Benefits,
Obstacles and Futures of Six Sigma, International Journal of Technological Innovation, Entrepreneurship and Technology Management. 26 (5-6): 708-715.
Naumann, E. and Hoisington, S.H., 2001. Customer Centered Six Sigma Linking Customer Process Improvement and Financial Results, ASQ Quality Press.
Das, P,. 2005. Reduction in Delay in Procurement of Materials Using Six Sigma Philosophy, Total Quality Management and Business Excellence, 16: 645-656.
Su, C.T. and Chou, C.J., 2008. A Systematic Methodology for the Creation of Six Sigma Projects: A Case Study of Semiconductor foundry, Expert Systems with Applications, 34: 2693- 2703.
Chakravorty, S.S., 2009. Six Sigma Programs: An Implementation Model, International Journal of Production Economics. 119: 1-16.
Schroeder, R.G, Linderman, K., Liedtke, C. and Cheo, A.S., 2008. Six Sigma: Definition and Underlying Theory, Journal of Operations Management. 26: 536- 556.
Kozan, E, 2000. Optimizing Container Transfer at Multimodal Terminals, Mathematical and Computer Modeling, 31: 235-243.
Nam, K. and Ha, W, 2001. Evaluation of Handling
Systems for Container Terminals, Journal of
Waterway, Port, Coastal and Ocean Engineering. 127 (3): 171–175.
Khoshnevis, B. and Asef-Vaziri, A., 2000, 3D Virtual and Physical Simulation of Automated
Container Terminal and Analysis of Impact on In-Land Transportation, METRANS Transportation Center, University of Southern California, USA.
Lie, C., Jula, H. and Ioannou, P., 2002., Design, Simulation, and Evaluation of Automated Container Terminals, IEEE Transactions on Intelligent Transportation Systems. 3 (1): 12–26. Vis, I. and De Koster, R., 2003. Transshipment of
Containers at a Container Terminal: An Overview, European Journal of Operational Research. 147: 1-16.
Murty, K., Liu, J., Wan, Y. and Linn, R. 2003. A DSS (Decision-Support System) for Operations in a Container Terminal, working paper, University of Michigan, USA.
Nishimura, E., Imai, A., Janssens, G. and Papadimitriou, S., 2009. Container Storage and Transshipment Marine Terminals, Transportation Research: Part E. 45(5): 771-786.
Legato, P. and Mazza, R., 2001. Berth Planning and Resources Optimization at a Container Terminal via Discrete Event Simulation, European Journal of Operational Research. 133: 537–547.
Nishimura, E., Imai, A. and Papadimitriou, S., 2001. Berth Allocation Planning in the Public Berth System by Genetic Algorithms, European Journal of Operational Research 131: 282–292.
Imai, A., Sun, X., Nishimura, E. and Papadimitriou, S., 2005. Berth Allocation in a Container port: Using a Continuous Location Space Approach, Transportation Research: Part B. 39: 199-221.
Moorthy, R. and Teo, C. 2006., Berth Management in Container Terminal; the Template Design Problem, OR Spectrum. 28: 495-518.
Lee, Y. and Chen, C. 2009. An Optimization Heuristic for the Berth Scheduling Problem, European Journal of Operational Research. 196: 500-508.
Kia, M., Shayan, E. and Ghotb, F., 2002. Investigation
Journal of the Persian Gulf (Marine Science)/Vol. 3/No. 8/June 2012/11/55-66
of Port Capacity under a New Approach by Computer Simulation, Computer and Industrial Engineering. 42: 533- 540.
Parola, F. and Sciomachen, A. 2005. Intermodal Container Flows in a Port System Network: Analysis of Possible Growth via Simulation Models, International Journal of Production Economics. 97: 75- 88.
Bielli, M., Boulmakoul, A. and Rida, M. 2006. Object Oriented Model for Container Terminal Distributed Simulation, European Journal of Operational Research. 171: 1731- 1751.
Froyland, G., Koch, T., Megow, N., Duane, E. and Wren, H. 2008. Optimizing the Landside Operation of a Container Terminal, OR Spectrum. 30: 53-75.
Zeng, Q. and Yang, Z. 2009. Integrating Simulation and Optimization to Schedule Loading Operations in Container Terminals, Computers and Operations
Research. 39: 1935- 1944.
Regan, A. and Golob, T. 2000. Trucking Industry Perceptions of Congestion Problems and Potential Solutions in Maritime Intermodal Operations in California, Transportation Research: Part A. 34: 587-605.
Klodzinski, J. and Al-Deek, H. 2002. Using Seaport Freight Transportation Data to Distribute Heavy Truck Trips on Adjacent Highways, Proceedings of the 82nd Transportation Research Board Annual Meeting, 11 Jan., Washington DC, USA.
Murty, K., Liu, J., Wan, Y. and Linn, R. 2005. A Decision Support system for Operations in a Container Terminal, Decision Support Systems: 39: 309- 332.
Tkac, M. and Lyocsa, S. 2009. On the Evaluation of Six Sigma Projects, Quality and Reliability Engineering International. 26: 115-124.
Kumar, D. 2006. Six Sigma Best Practices, J. Ross Publishing, USA.
Nooramin et al. / A Systematic Framework for Implementing Six Sigma in the Landside…
Journal of the Persian Gulf (Marine Science)/Vol. 3/No. 8/June 2012/11/55-66
Journal of the Persian Gulf
(Marine Science)/Vol. 3/No. 8/June 2012/11/55-66