Study Navigator: An Algorithmically
Generated Aid for Learning from Electronic
Textbooks
∗
Rakesh Agrawal
Microsoft Research [email protected]
Sreenivas Gollapudi
Microsoft Research [email protected]
Anitha Kannan
Microsoft Research
Krishnaram Kenthapadi
Microsoft Research [email protected]
We present study navigator, an algorithmically-generated aid for enhancing the experience of studying from electronic textbooks. The study navigator for a section of the book consists of helpful concept referencesfor understanding this section. Each concept reference is a pair consisting of a concept phrase explained elsewhere and the link to the section in which it has been explained. We propose a novel reader model for textbooks and an algorithm for generating the study navigator based on this model. We also present an extension of the study navigator specialized to accommodate the information processing preference of the student. Specifically, this specialization allows a student to control the balance between references to sections that help refresh material already studied vs. sections that provide more advanced information. We also present two user studies that demonstrate the efficacy of the proposed system across textbooks on different subjects from different grades.
1 I
NTRODUCTIONWith the emergence of abundant online content, cloud computing, and electronic reading de-vices, the multi-billion dollar textbook industry is poised for transformative changes. Notwith-standing understandable misgivings (e.g. Gutenberg Elegies (Birkerts, 2006)), textbooks cannot escape what Walter Ong calls “the technologizing of the word” (Ong, 1982). Already, there are initiatives such as “no child left offline” that are centered around the availability of electronic textbooks for achieving the goal of “any time, any place, any pace” learning (CDE, 2012). There are ongoing efforts to create high quality free, open electronic textbooks (CK-12, ). A recent study estimated that 29% of adults in USA own tablet computers or eReaders compared to 2% less than three years ago (Meeker, 2012). These trends are not limited to USA or other developed nations alone. For example, the Government of India is said to be developing a low cost tablet,
∗A preliminary version of this paper appears with the title “Studying from Electronic Textbooks” in the
Aakash, pre-loaded with educational content for distributing to millions of students (IMHRD, 2012).
We believe electronic textbooks provide huge opportunity to invent new tools and techniques to facilitate effective use of this medium. Some of the new functionalities that can be enabled in future textbooks include:
• New navigations: The book can infer navigational aids beyond table of contents, back-of-the-book index, and simple hyperlinks.
• Adaptability: The book can be personalized to suit the student’s knowledge of the subject
material as well as learning styles. The presentation can be dynamically modified to adapt to the requirements of the student based on prior interaction with the book.
• Richer experiences: The book can be augmented with images, picture galleries, videos,
and live simulations to provide a better learning experience.
• Continuous self-assessment: The book can offer personalized assessments and recourses
to help students learn in a non-invasive way.
• Collaborative learning: The book can propose interactions with other students appropriate
for the part of the book a student is studying. It can also suggest compatible study groups that can span different geographical regions.
This paper presents one particular study aid we have designed specifically for electronic books, calledstudy navigator. It is generated algorithmically and accommodates the information processing preference of students. It provides easy access to concepts explained elsewhere in the book that are most relevant for understanding the present section. Refer to the pair consisting of a concept useful for understanding a section and the link to the section where it has been explained as aconcept reference. The study navigator consists of significant concept references for every section in the book. It can be activated by a student while reading a particular section and shows the corresponding concept references. Only a small number of significant concept references are shown to avoid undue cognition burden on the reader.
Our main technical contribution is the algorithmic mining of the concept references in the context of a reader model we propose for textbooks. Our reader model is inspired by the random web surfer model and personalized PageRank computation (Jeh and Widom, 2003). However, the random walk used in our model has significant differences, such as (1) the preference vec-tor gets updated during certain types of transitions while it is fixed in personalized PageRank computation, and (2) the return transition occurs with a large probability in our model unlike in PageRank computations.
We also present the results of two user studies for assessing the performance of our study navigator system. The first study did not use the specialization of the study navigator for reader types (and implicitly assumes curious readers). The overall finding of this study was that the judges found the references provided by the study navigator to be quite helpful. Our in-depth failure analysis revealed that in the cases where the judges preferred references other than those provided by the study navigator, it was mostly for sections that reminded them of the material covered earlier. Our second study confirmed the existence of reader types and helped us identify users who were dominantly curious or diligent. Now by providing references generated by the student-specific navigator to the respective types of readers, we found that the respective user types found the corresponding references useful.
The paper proceeds as follows. We begin with a discussion of related work in§2. We present the algorithms for generating the study navigator in§3 and its experimental evaluation in§4. We
next describe the student-specific navigator that incorporates reader types and its evaluation in
§5. We present conclusions and future directions in§6.
The thrust of this paper is on describing how the study navigator automatically generates concept references for various sections of a given textbook. The manner in which these concept references are surfaced and integrated in the user experience of studying from the electronic book is of paramount importance, but beyond the scope of this paper.
2 R
ELATEDW
ORKAuthoring tools for adaptive navigation and presentation: A prominent system in this category is InterBook (Brusilovsky et al., 1998), a tool for creating an electronic book that can adapt to users with different backgrounds, prior subject knowledge, and learning goals. The data required to enable this adaptation must be provided as input by the author. We aim to infer the concept references needed for building the study navigator by algorithmically mining the text of the book.
Adaptive educational hypermedia systems: The goal of these systems is to combine
hyperme-dia systems with Intelligent Tutoring Systems to adapt web-based educational material to the needs of particular users (Brusilovsky, 2001). They aim to help educators manually setup per-sonalized courseware based on the cognitive style (e.g., AES-CS (Triantafillou et al., 2004), EDUCE (Kelly, 2008)) or learning style (e.g., ELM-ART (Brusilovsky et al., 1996), ELM-ART II (Weber and Specht, 1997), KBS Hyperbook (Henze and Nejdl, 2001), INSPIRE (Papaniko-laou et al., 2003)). They operate under the premise that the underlying information to enable this personalization is available to the person creating the courseware. We, on the other hand, aim to provide automated techniques.
Exploratory hypermedia systems: We put various systems categorized as ASK systems (e.g.,
Trans-ASK (Bareiss and Osgood, 1993) and ASKTool (Cleary and Bareiss, 1996)) into this category. They aim to provide an interactive environment that mimicks conversing with an expert for its users to be able to find content of interest and/or ask follow-up questions to retrieve additional topics. In contrast, we look at the problem of identifying sections that are needed for understanding the current section.
In contrast to our system, these systems do not provide references to concepts/sections that are useful for understanding a given section.
Back-of-the-book indices: While related, there are fundamental differences between a
back-of-the-book index (Mulvany, 2005) and what we call concept references associated with each section of the book. In principle, one could do a sort on section numbers of a back-of-the-book index and thus find the important phrases present in each section. But it solves only half of the problem – if we know that a concept phraseϕis important for understanding a given section,
we can use this approach to know all the sections where ϕis possibly explained. But how do
we know whichϕis critical for understanding the present section? In fact, it is quite likely that ϕmight not even appear as a phrase in the present section1. For the same reason, hyperlinking
some phrases appearing in the current section is not sufficient. Another key difference is that back-of-the-book index generation algorithms compute global significance of concept phrases at the book level without taking into account where in the book the reader currently is or who the reader is.
3 S
TUDYN
AVIGATORThe study navigator system is designed to make it easy for a student to find concepts described elsewhere in the book that are most relevant to the material discussed in the present section. We refer to the pair consisting of a concept useful for understanding a section and the link to the section where it has been explained as aconcept reference. For the purposes of this paper, we represent a concept as a phrase, and denote it as cphr. Our goal is to determine a few hcphr,
sectionipairs that are most relevant for understanding the current section.
3.1 ALGORITHMIC INTUITION
Suppose that the set of cphrscontained in a section as well as the relationship between cphrs
is available. We then need to determine the concept references that are most significant for understanding a given section s. For this purpose, we need a score denoting how significant
is the description of a cphr c in a different section t for understanding section s. Given the
significance scores of every cphr in every other section for understanding section s, we can
orderhcphr, sectionipairs by their significance scores and include pointers to the topk hcphr,
sectionipairs in the study navigator for sections.
The significance score of a cphrin section tfor understanding a different sections can be
thought of in terms of how likely is the description of thiscphrin sectiontto be referred when
a reader is trying to understand sections. How do we formalize and quantify this likelihood?
We surmise that while reading a book, a reader would refer to more significantcphrsmore often.
Reader Model: Consider a student who is reading a textbook starting from the first section. When she is reading a sectioni, she comes across thecphrsin the orderci1, ci2, ci3, . . .. When the
1For example, consider the section titled “Ex ante and ex post” which is part of the chapter on income
s
1c
1c
2c
3s
2c
4c
2c
1s
3c
5c
3c
5s
4c
4c
5c
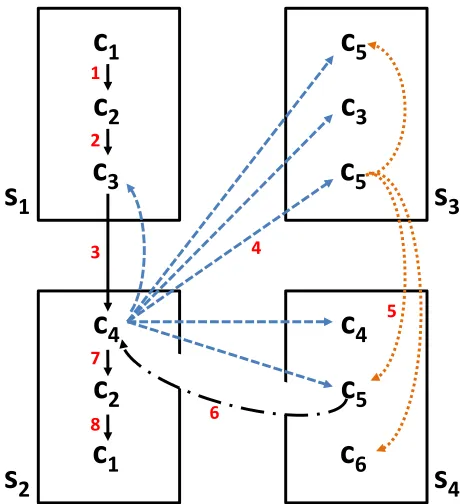
6 1 2 3 7 8 6 5 4Figure 1: Illustration of Reader Model: Consider a hypothetical textbook consisting of four sections (s1, . . . , s4) and sixcphrs(c1, . . . , c6). The reader reads the book starting froms1. The
path followed by the reader is indicated by numbers next to the arrows. Suppose the reader (after reading s1) does not understandcphr c4 in section s2, and hence is forced to refer to another
section containing c4 or acphr related toc4. Let{c3, c4, c5} be the set ofcphrs related toc4,
so that the available digression edges correspond to the edges consisting of dashes. The reader chooses a cphrfrom this set. Suppose she chose c5. Out of the three occurrences of c5 in the
book, suppose she selected the second occurrence of c5 ins3. Thus she follows the digression
edge marked 4, to read aboutc5 ins3. After reading aboutc5 ins3, the reader either returns to c4 ins2 with a large probability (the return edge not shown) or digresses further. Suppose she
digresses further. Let{c5, c6}be the set ofcphrs related toc5, so that the available digression
edges correspond to the edges consisting of dots. She selects c5 from this set and follows the
digression edge marked 5 to read about c5 ins4. Afterwards, she returns toc4 ins2 along the
edge marked 6, and persists to read further.
reader comes across acphrc, with a large probability, the reader will be persistent in continuing
to read the section. With a certain probability, she may not understand thecphrand hence may be forced to refer to another section to seek explanation.
Postulate that whenever the reader does not understandc, she refers to a section containing
the samecphrcor a differentcphrrelated toc. More precisely, the reader picks acphrc′ from
the set ofcphrsrelated tocwith equal probability, chooses an occurrence ofc′ amongst all
oc-currences ofc′ in the book with equal probability, and refers to the corresponding sectioni′ to
learn more aboutc′. It is possible thati′ is a section earlier thaniin the book or it is a later
sec-tion. After reading aboutc′ ini′, the reader has the following options: (a) return to the original
section iwith a large probability, and continue further reading, or (b) digress further to learn
more aboutc′ by referring to a section containingc′ or a differentcphrrelated toc′, that is, pick
acphrc′′ from the set ofcphrsrelated toc′ with equal probability and refer to a sectioni′′that
i
1c
3s
c
1c
2i
2c
4c
5t
c
Y X
X
X
Y
Z
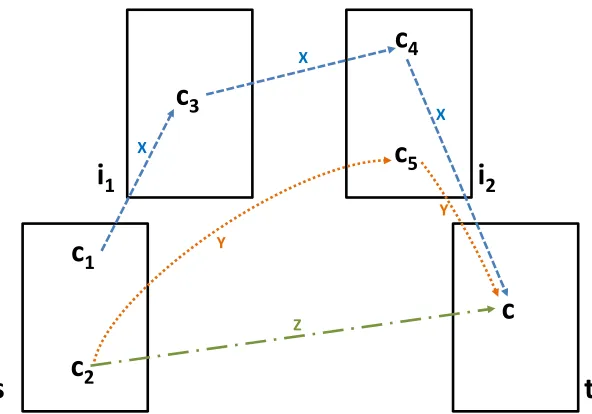
Figure 2: Illustration of how the significance score ofcphrcin sectiontfor understanding section sis computed: Consider three different readers trying to understandcphrsin section s. Reader X is unable to understand cphrc1, and hence digresses to other sections (shown using dashed
edges). She may first refer toc3in sectioni1, followed byc4in sectioni2, and finallycin section t. ReadersY andZare unable to understandcphrc2, but digress to different sections. ReaderY
refers toc5 in sectioni2, followed bycin sectiont(shown using dotted edges) while readerZ
directly digresses tocin sectiont(along the edge consisting of dashes and dots). The significance
score is obtained by computing the likelihood of each such digression for different readers that reachcin sectiontstarting from sections, and aggregating over many such digressions.
then returns to the original sectioni, or digresses further. Note that, while digressing, the reader
can revisit a sectioni′ (e.g., for reading aboutc′′′ which is also explained in sectioni′and which
is related toc′′). But the return from a digression is always to the starting sectioni(irrespective
of the number of hops digressed) as the reader is trying to understand sectioniand the purpose
of the digression is to seek better explanation forcoccurring ini. See Figure 1 for an illustration.
Computing Significance Scores: Consider different students trying to understand sections. We
obtain the significance score of acphrcin sectiont for understanding sectionsby computing
how often these students refer to the description of thiscphrin section twhen reading section s. More precisely, whenever a reader has difficulty understanding acphrin sectionsand hence
is forced to digress to other sections, we compute how likely is the reader to refer tocphr cin
sectiont. We then aggregate these likelihoods over many readers and over allcphrsin section s. See Figure 2 for an illustration.
We next formalize the algorithmic intuition presented above, and precisely formulate the reader model and the computation of significance scores.
3.2 NOTATIONS
LetS = {1,2, . . . , n}denote the set of sections in a given textbook. Let C denote the set of
cphrs (concept phrases) in the book. For each cphr c ∈ C, denote the set ofcphrs related
S Set of sections in the textbook (|S|=n) C Set ofcphrs(concept phrases) in the textbook
R(c) Set ofcphrsrelated tocphrc
λs(c, t) Significance score ofcphrcoccurring in a different sectiontfor understanding section
s
ks Number of desired concept references to be provided in the study navigator for a given sections
Table 1: Notations
c in a different section t for understanding section s. Let ks denote the number of desired hcphr, sectioniconcept references in the study navigator for sections. Table 1 summarizes key
notations.
3.3 FORMULATION OF READER MODEL
We formulate the reader model as a random walk over a concept graphG= (V, Ep∪Ed). Each nodeu = hi, cij, ji ∈ V is a hsection, cphr, positionitriplet corresponding to the occurrence ofcphr cij in sectioni and its sequential positionj amongst thecphrs in the section. Denote the associated section i by¯i(u) and the associated cphr cij by ¯c(u). There are two types of directed edges inG. The set of persistence edgesEp consists of directed edges corresponding to sequential reading of the book, that is, there is a directed edge fromhi, cij, jitohi, ci(j+1), j+ 1i
and from the last concept node in a section to the first concept node in the next section. The set of digression edges Ed consists of directed edges corresponding to forced digression, that is, there is an edge fromutov if ¯c(v) ∈ R(¯c(u))(ifcphrassociated with v is related tocphr
associated withu).
The random walk consists of three types of transitions:
1. Persistence transition: From any node u, follow the persistence edge, that is, the reader
persists to read sequentially from the cphr occurrence corresponding to u. Denote the
probability associated with such a transition as the persistence factor,α.
2. Digression transition: From any nodeu, follow a digression edge. Denote the total
proba-bility associated with a transition along one of the digression edges outgoing from a node as the digression factor,β. Suppose the reader picks a relatedcphrc′ ∈ R(¯c(u)). The reader then selects an occurrence ofc′ amongst all occurrences with equal probability.
3. Return transition: From any node to which the reader has digressed, return to the node from where the digression originated. This transition corresponds to the reader returning back to the starting point after a digression. Denote the probability associated with such a transition as the diligence factor,γ.
sequential reading, and further, a copy of(V, Ed)rooted at each nodeu ∈ V. The digressions that originate from any nodeuare confined to the copy ofV rooted atuand the return transitions
point toufrom all nodes in the copy rooted atu. By creating a separate copy of digression edges
for each sequential position (node), we implicitly keep track of the state from which the reader started the digression and thus the return transition can be determined based on just the current state.
3.4 COMPUTING SIGNIFICANCE SCORES
Consider the random digression walk starting from an arbitrary nodeu(that is, the walk
corre-sponding to the chain of digressions originating fromuconsisting of only digression and return
transitions but no persistence transitions). In this walk, the return transitions always point to
u and the digression transitions are determined based on the current state. Hence, this walk
induces a Markov chain over the strongly connected component reachable from node u. This
Markov chain is (a) finite (b) irreducible since the underlying directed graph for the Markov chain consists of a single strongly connected component [any two arbitrary nodesv1 andv2 in
this graph are reachable from each other since there are edges fromv1andv2touand paths from
u tov1 and v2], and (c) aperiodicsince self-loops are present at every node in the underlying
directed graph for the Markov chain [recall thatR(c)includesc, and hence there exists a
digres-sion edge from a node to itself]. Thus, the Markov chain satisfies the necessary conditions for applying the fundamental theorem of Markov chains (Motwani and Raghavan, 1995), leading to the claim below.
Claim 3.1 There is a unique stationary probability distributionπ(u, .)associated with the ran-dom digression walk starting from any nodeuinG.
By definition, the stationary probabilityπ(u, v)denotes the probability that the walk starting from nodeuis at nodevin the steady state. In other words, this probability corresponds to the
relative frequency with which the reader refers thecphr c¯(v) corresponding tov when trying
to understand the cphr corresponding tou and hence larger π(u, v)implies that the reader is more likely to refer tov. Thusπ(u, v)is a measure of the relative significance of an occurrence ofcphr¯c(v)in section¯i(v)corresponding tov for understanding the cphrcorresponding tou.
Considering the random walks starting from each concept node in a given sectionsof the book,
we can thus compute the significance of a single occurrence of cphr ¯c(v) in section¯i(v) for understandingcphrsin sections. Our goal is to compute the significance ofalloccurrences of
a cphrin a section. Hence we further aggregate the above score over all occurrences of cphr ¯
c(v)in section¯i(v). In this manner, we also incorporate the frequency of thecphrin the section. Note that we chose not to include persistence transitions for significance score computation since sequential reading is the default reading behavior, and we want to take into account the reader’s deviation from this behavior in the form of forced digressions.
We thus define the significance score λs(c, t) of a cphr c in section t for understanding sections in terms of the combined stationary probability associated with nodes corresponding
to all occurrences ofcint, summed over random walks starting from all concept nodes in section s. We remark that our definition ofλs(c, t)takes into account the following desired factors: the frequency ofcint, the number ofcphrsrelated tocand the likelihood that the description ofc
Definition 3.2 Given the stationary probabilitiesπ(., .)associated with the random digression walks, define the significance score of a cphrcin sectiontfor understanding sectionsas
λs(c, t) :=
X
v∈V:¯i(v)=t,¯c(v)=c
X
u∈V:¯i(u)=s
π(u, v).
In the above definition, the inner summation is over all occurrences of cphrs in section s
(corresponding to the digressions by readers who are unable to understand different cphrs in sections) and the outer summation is over all occurrences ofcphrcin sectiont(corresponding
to how often these readers refer to the description ofcin sectiont).
3.5 REMARKS
Number of concept references: We note that the number of desired references for a section can be determined in multiple ways. It can either be a small fixed number across all sections, or be determined based on the distribution of the significance scores for each section. In the latter case, given a limitkmax (say, 5) on the maximum number of references to be shown and a de-sired coverage κ(say, 75%), we can set ks to be the minimum of (i)kmax and (ii) the number of tophcphr, sectioni pairs for section sneeded to cover κfraction of the sum of significance
scores over allhcphr, sectionipairs for this section.
Parameter Values: In our implementation of the reader model, there is effectively one parameter that determines the probabilities of the three types of transitions. When digression originates from a node, there are exactly two choices, to persist reading or to digress, and henceα+β = 1. Similarly, for subsequent nodes in the digression, there are exactly two choices, to return back to starting node or to digress further, and hence γ +β = 1. Thus α = γ = 1 −β. This
relationship betweenαandγis in agreement with the following natural intuition: one’s tendency
to read forward in a section is the same as the tendency to return to the starting point after a digression, since both these tendencies try to achieve the same goal of one’s disciplined reading and completion of the entire book.
We experimented with different choices of the digression factor, and confirmed that the results from our reader model are robust to these choices. Higher digression factor would imply that the reader is more likely to digress to other sections when reading a section and hence would assign greater significance score to each hcphr, sectioni pair for understanding other
sections. As sequential reading is the dominant mode in the reader model and hence large β
values are undesirable, we considered the following values: β = 0.1,0.3,and 0.5. First, we observed that the values of the significance scores of individualhcphr, sectioni pairs increase
linearly with the digression factor. This follows from the random digression walk performed in the reader model. For example, whenβ increases by factor 3 from 0.1 to 0.3, so does the
mass transferred from a cphr to a related cphr in the concept graph. Next, we measured the sensitivity of the digression factor on the relative significance of thehcphr, sectionipairs since the study navigator makes use of only the relative ordering and not the absolute values. To do so, we computed the top 25 hcphr, sectioni pairs for each value of β and measured the
andd(O0.5, O0.9) = 18. This shows that the number of inversions observed are small compared
to the maximum inversions of 25 2
= 300. We got similar results when we measured the distance between each pair of orderings using Spearman’s footrule. Since the relative ordering ofhcphr,
sectionipairs remained quite robust, we useβ = 0.3in the experimental results reported in the paper. This choice corresponds to the reader starting a digression 30% of the time and persisting to read sequentially 70% of the time.
3.6 RELATIONSHIP TO RANDOM SURFER MODEL AND PERSONALIZED PAGERANK
COMPUTATION
Our reader model might appear similar to the random web surfer model and personalized PageR-ank computation (Jeh and Widom, 2003). However, random walks used in these models have key differences. Represent the current stateV¯ of the random walk as a |V|-dimensional vec-tor, where each field represents ahsection,cphr, positioninode inV and the fields are listed in
the order of occurrences ofcphrsin the book. LetU¯ denote the preference vector correspond-ing to the return transition. LetAdenote the transition probability matrix corresponding to the
digression transition.
The preference vector is fixed in personalized PageRank computation. However, in our model, it gets updated during each persistence transition. Initially,U¯ ← (1,0, . . . ,0). During each persistence transition, the preferred node (the field having unity value) gets shifted to the right. Formally, the preference vector gets updated as: U¯ ← PU¯, where P is a permutation matrix (on |V| dimensions) that transforms a unit vector along a given direction to the unit vector along the right adjacent direction, that is, Pi,i−1 = 1 ∀2 ≤ i ≤ |V|, P1,|V| = 1 and
all other entries of P are zero. As the preference vector changes over time, we need to keep
track of both the preference vector (node from where the digression originated) and the current position of the reader (node in the digression) in order to compute the probability distribution of the reader’s state after a certain number of transitions. However, we can obtain the following approximation by combining persistence and return transitions and assuming that the preference vector gets updated in each step:
¯
V ←β·AV¯ + (1−β)·PU.¯
Another difference is that digression occurs with a small probability and the return transition occurs with a large probability in our model (since persistent reading is the dominant behav-ior) whereas the return transition (“teleportation”) occurs with a small probability in PageRank computations.
3.7 STUDY NAVIGATOR WITH SECTION REFERENCES
the digressed section from beginning to end, and then determines whether to digress to another section or return to the starting section.
Simplified Significance Score Computation: The significance score computation for section ref-erences can be approximated using the following simplified algorithm. For eachcphrcin section s, determine other sections that mentionc(say, using the back-of-the-book index if present) and
then obtain the significance score of sectiontfor sectionsas the number of distinctcphrsthat
are present in boths andt. This algorithm tries to simulate a reader who uses the
back-of-the-book index to determine other sections to refer to while reading a section. This algorithm uses only information local to a section and other sections that share commoncphrswhile the reader model based algorithm performs a global computation using random walks. The former can be viewed as approximating the latter, analogous to how in-degree (a local measure) can be used to approximate PageRank (a global measure) (Fortunato et al., 2008).
4 U
SERS
TUDYWe carried out extensive experiments to understand the performance characteristics of the study navigator system and present the results in this section. The goal of our evaluation is to determine whether users find the references provided by the study navigator system useful.
4.1 METHODOLOGY
4.1.1 Data Sets
We used a corpus of Indian high school textbooks published by the National Council of Edu-cational Research and Training (NCERT). We selected this corpus because these books were readily available online. This corpus has also been used in prior studies related to textbooks (e.g., (Agrawal et al., 2011)). The corpus consists of books from grades IX–XII, covering four broad subjects: Sciences, Social Sciences, Commerce, and Mathematics. For the purpose of in-depth analysis, we use Grade XII Economics textbook. We also present results for two other books from very different subjects: Grade X Science and Grade XII History. We observed similar results for other books in the corpus.
4.1.2 Concept Phrases and Relationship between them
If a textbook includes a back-of-the-book index (Mulvany, 2005), it can be used for obtaining concept phrases. Unfortunately, not all books contain such indices; e.g., in a study reported in (Bakewell, 1993), only 55% of the 113 books examined included them. Moreover, tests of indexer consistency lend strong evidence to the subjective nature of human indexing. They reveal that indexers are likely to be in poor agreement among themselves, and the same indexer indexes the same document differently at different times (Fidel, 1994).
using linguistic patterns, with the help of a part-of-speech tagger (Toutanova et al., 2003). We use the pattern A∗N+, where A refers to an adjective and N a noun, which was found to be
particularly effective in identifyingcphrsin (Agrawal et al., 2011). Examples of phrases satisfy-ing this pattern include ‘cumulative distribution function’, ‘fiscal policy’, and ‘electromagnetic radiation’. The initial set of phrases is further refined by exploiting complementary signals from different sources. First, WordNet (Fellbaum, 1998), a lexical database is used to correct errors made by the part-of-speech tagger. Next, both malformed phrases and very common phrases are eliminated, based on the probabilities of occurrences of these phrases on the Web, obtained using Microsoft Web N-gram Service (Wang et al., 2010). The reason for eliminating common phrases is that they would be already well understood.
We first attempted to induce relationships between concepts by mapping concept phrases to Wikipedia articles and use the link structure between the Wikipedia articles to infer relationship between concepts. We discovered the following issues. Many Wikipedia articles have asym-metric hyperlink structure, plausibly due to the encyclopedic nature of Wikipedia: there are relatively less links from articles on specialized topics to articles on more general topics. For instance, the Wikipedia article titled ‘Gaussian surface’ mentions ‘electric field’ 11 times but does not have a link to the latter. Furthermore, while Wikipedia provides good coverage for universal subjects like Physics and Mathematics, it has inadequate coverage for concepts related to locale-dependent subjects such as History. We, therefore, derive the relationship between
cphrsdirectly from textbooks using co-occurrence. More precisely, we defined R(c)to be the set ofcphrs(includingc) that co-occur withcin at leastesections such that bothcand the
co-occurringcphrc′ occur within a window of sizel in each of theseesections. The requirement
of co-occurrence in multiple sections and co-occurrence within a window size ensures that we only considercphrpairs that are significantly related to each other. We usede= 2andl = 500 words, after confirming through sensitivity analysis that the results were not sensitive to these choices.
4.1.3 Helpfulness Index
Given the unavailability of a standard benchmark, we used the following procedure to evaluate the usefulness of the references proposed by the study navigator. For a given section, we first determined the top three sections referred by the study navigator. Ideally, we would have liked to compare them with those that an expert human judge (such as a teacher using the book or a student studying from the book) finds most useful after reading the entire book. In the ab-sence of the availability of this subject population to us, we used the Turkers from the Amazon Mechanical Turk platform as judges. However, we could not recruit Turkers who were willing to read the entire book. We, therefore, changed the task to determine if the Turkers can dif-ferentiate the sections suggested by the study navigator from other sections. For this purpose, we obtained three arbitrary sections from the book and provided the original section along with these six sections to a judge, after scrambling the ordering between the referred sections. The judge was asked to read the original section, followed by all the six referred sections. Then the judge was asked to select exactly three most useful amongst the referred sections. This exercise was carried out using multiple judges.
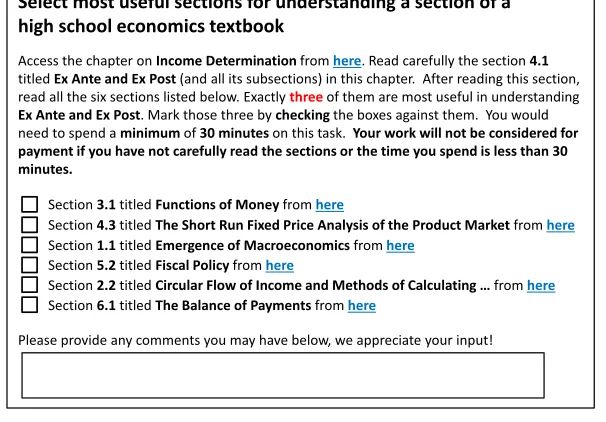
Select most useful sections for understanding a section of a high school economics textbook
Access the chapter on Income Determination from here. Read carefully the section 4.1
titled Ex Ante and Ex Post (and all its subsections) in this chapter. After reading this section, read all the six sections listed below. Exactly three of them are most useful in understanding
Ex Ante and Ex Post. Mark those three by checking the boxes against them. You would need to spend a minimumof 30 minutes on this task. Your work will not be considered for payment if you have not carefully read the sections or the time you spend is less than 30 minutes.
Section 3.1 titled Functions of Money from here
Section 4.3 titled The Short Run Fixed Price Analysis of the Product Market from here
Section 5.2 titled Fiscal Policy from here
Section 2.2 titled ✁✂✄☎ ✆ ✝✂✞✆✟ ✠✟ ✡☛☞ ✄✟ ✌✍✝☞ ✎✏✍✑ ✒✟ ✎ ✓✟ ✡ ✝✆✄☎✆✝✑✁☞ ✔✕from here
Section 6.1 titled The Balance of Payments from here
Please provide any comments you may have below, we appreciate your input! Section 1.1 titled Emergence of Macroeconomics from here
Figure 3: A sample HIT
referenced sections and zero point each to the remaining three. Denote the total number of points a section obtained from the judges as its vote score. Consider the set of three sections with the largest vote score. These are the sections voted as most relevant by the judges according to Borda’s method.
Out of these Borda winners, we determine the number of sections that were also suggested by the study navigator and define thehelpfulness indexas the number of study navigator references in this set divided by three (size of the set). Thus, in the absence of ties, the helpfulness index for each section will be equal to one of the following four values: 1,2/3, 1/3, and 0. A value of 1 means that the top three sections voted by the judges were the same as the top three study navigator section references and a value of 0 means that the judges considered the arbitrary sections as more relevant than the study navigator section references.
However, it may not be possible to uniquely determine the set of three sections with the highest vote because of ties. In this case, we compute the helpfulness index by taking the expectation over all possible choices of this set, as explained in the following example. Let
i1, i2andi3be the study navigator section references with vote scores of 4, 3 and 3 respectively
andr1, r2 andr3 be the arbitrary section references with vote scores of 6, 3 and 2 respectively.
The winner set always includesr1 (section with the largest vote score) andi1 (section with the
second largest vote score). However, there are three possible candidates for the third section:
i2, i3 orr2. Thus, possible choices arehr1, i1, i2i,hr1, i1, i3iandhr1, i1, r2i, with corresponding
helpfulness index of2/3,2/3and1/3respectively. Hence, the helpfulness index in expectation will be 2/3+2/3+1/3
3 = 5/9. Thus, the helpfulness index for a section can be one of a small set
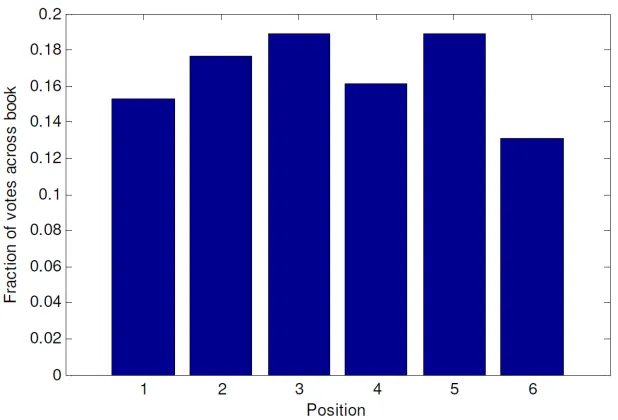
Figure 4: Distribution of all judgments across the six positions
4.1.4 Judges
Figure 3 shows the HIT (Human Intelligence Task) provided to the judges. In this example HIT, Sections 2.2, 4.3 and 5.2 are study navigator section references and Sections 1.1, 3.1 and 6.1 are arbitrary sections. Notice that the sections have been randomly ordered.
Each HIT was judged by seven judges. There were 158 distinct judges who took part in the study. We specified that a judge spend a minimum of half an hour on a HIT. We required our judges to have performed at least 1000 HITs in the past with an approval rating of at least 96%. Such judges have a strong interest in retaining their high rating. The judges had at least High School degree. We followed best practices suggested in the literature in accepting HITs (Ama-zon, 2011).
We also validated the quality of judgments along different dimensions. For example, Fig-ure 4 shows the distribution of judgments across the six positions, that is, how often the judges marked the sections at position 1, 2, 3, 4, 5 and 6 respectively. We observe that the judgments did not exhibit position bias suggesting that the judges based their decisions after going through all six referred sections and were not unduly influenced by the (randomized) order in which the six sections were presented in each HIT. Similarly, we also verified that the judges did not have a backward bias (that is, tendency to favor earlier sections in the book) or a forward bias (that is, tendency to favor later sections). Figure 5 shows the distribution of judgments across the six positions for the top 20 judges who participated in the most number of HITs. This figure shows that the distribution of position-wise judgments varied across the judges, which indicates the absence of impostor judges who repeatedly judged a HIT using multiple identities.
4.2 PERFORMANCE RESULTS
Figure 5: Distribution of position-wise judgments for top 20 judges who participated in the most number of HITs
bar. The results are very encouraging. The average helpfulness index for Grade XII Economics and Grade XII History books is 80% and 78% respectively, and this index is as high as 91% for Grade X Science book.
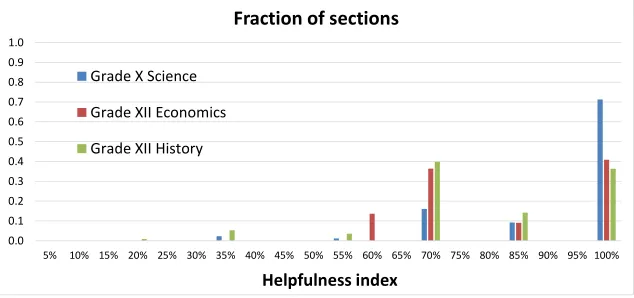
We next show the performance broken down at the section level. Figure 7 gives the fraction of sections with certain helpfulness index for the three books. For 71% of sections in Grade X Science book, the helpfulness index is 100%, that is, the judges considered all three study navigator section references as useful. For over 90% of sections, the helpfulness index exceeds 67%, that is, the judges considered at least two out of the three study navigator section references as useful. For 40% of sections in Grade XII Economics book and for 36% of sections in Grade XII History book, the helpfulness index is 100%. Furthermore, for 80% of sections in Grade XII Economics book and for 90% of sections in Grade XII History book, the judges considered at least two out of the three study navigator section references as helpful.
Grade X Science book has a higher helpfulness index because chapters are relatively self-contained in this book. On the other hand, in Grade XII Economics and Grade XII History books, even an arbitrary section can be considered relevant to the original section since common concepts are discussed across many chapters.
4.3 IN-DEPTH ANALYSIS
We next provide in-depth analysis of the results for Grade XII Economics book. We chose to present the analysis for this book because its helpfulness index is in between the indices for the other two books. We ourselves read the book carefully in order to be able to analyze the performance.
0% 10% 20% 30% 40% 50% 60% 70% 80% 90% 100%
Grade X Science Grade XII Economics Grade XII History Helpfulness index
Figure 6: Performance of Study Navigator system for the three textbooks
0.0 0.1 0.2 0.3 0.4 0.5 0.6 0.7 0.8 0.9 1.0
5% 10% 15% 20% 25% 30% 35% 40% 45% 50% 55% 60% 65% 70% 75% 80% 85% 90% 95% 100%
Helpfulness index Fraction of sections
Grade X Science
Grade XII Economics
Grade XII History
Figure 7: Fraction of sections with different helpfulness index in the three textbooks
in the judgments, we also show the extreme values using an error bar in addition to the expected value. We observed that for 9 out of 22 sections, the judges unanimously preferred all three of the study navigator sections over the arbitrary sections. For another 10, judges preferred at least two of the study navigator sections. Only for three sections, judges selected one study navigator section, assuming ties were broken in favor of arbitrary sections. There was no such section when the ties were broken the other way.
For further analysis, we employ the schematic shown in Figure 9.
0% 10% 20% 30% 40% 50% 60% 70% 80% 90% 100%
1.0 1.2 2.0 2.1 2.2 2.3 2.4 2.5 3.1 3.2 3.3 4.0 4.1 4.2 4.3 5.0 5.1 5.2 6.0 6.1 6.2 6.3
Section number
Helpfulness index (Grade XII Economics)
Figure 8: Helpfulness index for sections in Grade XII Economics textbook
4.1 2.2 5.2 3.1 1.1 6.1 7 4 2 2 0 4.3 6
(a) Section 4.1
2.1 1.2 4.0 1.1 4.3 3 3 6 3 2.2 4 6.2 2
(b) Section 2.1
3.3 2.0 5.1 1.2 6.2 3 3 0 3 4.2 5 3.2 7
(c) Section 3.3
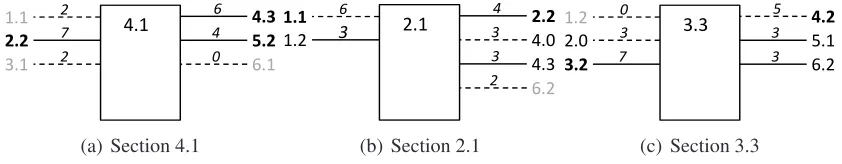
Figure 9: References provided to judges and their votes (Grade XII Economics textbook). In this schematic, the rectangle represents the original section. The thick lines point to the three study navigator section references and the dashed lines point to the arbitrary sections. Sections occurring before the original section in the book are placed to the left and those occurring after the original section are placed to the right. The number of judges who voted for a section is shown above the corresponding line. The clear winners are indicated in bold face, clear losers in light face, and ties in normal face.
Section 5.2 (“Fiscal policy”). Section 2.2 presents the circular flow of income and explains three different methods for computing national income, and thus is useful for understanding the rela-tionship between consumption, investment and aggregate demand in the context of the current section. Similarly, Section 4.3 discusses the relationship between demand, supply and price of final goods, and hence helps the reader better understand why ex post values can differ from ex ante values. Likewise the discussion of fiscal policy in Section 5.2 helps the reader appreciate how government policies can result in ex post values differing from ex ante values. Thus, the helpfulness index for this section is 100%. Note that the judges preferred by wide margin Sec-tion 4.3 over arbitrary SecSec-tions 1.1 and 3.1 that come earlier as well as SecSec-tion 6.1 that comes later. It suggests that the judges diligently went through the original section as well as the six candidate sections and did not blindly favor back or forward references.
We next report our analysis of two of the three sections that had the least helpfulness index. The conclusions from the third section (Section 4.3) were similar.
cap-ital goods, stocks & flows and investment. The three study navigator section references for this section are Section 2.2 (“Circular flow of income and methods of calculating national in-come”), Section 4.3 (“The short run fixed price analysis of the product market”) and Section 1.2 (“Context of the present book of macroeconomics”). Section 2.2 presents the circular flow of income and explains three different methods for computing national income, and in the process, describes the relationship between different concepts introduced in the current section. Hence it can lead to a deeper understanding of Section 2.1. The dissonance that merits discussion is why judges preferred 1.1 over 4.3. We found that Section 1.1 is a short section discussing the emergence of the subject of macroeconomics and provides a historical perspective to the ba-sic concepts of the subject. Section 4.3 on the other hand discusses the relationship between equilibrium output, aggregate demand, supply and price of final goods. Thus, Section 1.1 will be preferred by a reader who wants to be reminded of the context in which she is reading the current section, whereas Section 4.3 might appeal to a reader who wants to learn more about the relationship between concepts introduced in the current section. In general, our algorithm tends to rank sections that have deeper explanations higher.
Section 3.3: Figure 9(c) shows the schematic for Section 3.3 which is part of the chapter on money and banking. This section describes the role of the central bank in regulating the sup-ply of money through its instruments of monetary policy. It is primarily focused on the money creation in the banking system with emphasis on the internal operations of maintaining reserve and loaning out money for wealth creation. Towards this end, the section describes how the instruments of money creation are used in stabilizing the stock of money in the economy from external shocks. The concept of external shocks is illustrated using an example of investors around the world buying in domestic markets using foreign currency and how this activity can lead to inflation, if not kept in check through the process of sterilization by the central bank. The three study navigator section references for this section are Section 6.2 (“Foreign exchange market”), Section 3.2 (“Demand for money”) and Section 5.1 (“Components of the government budget”). Section 3.2 discusses the motives for holding money which is needed for understand-ing the current section, and is unanimously liked by the judges. We investigate why judges marginally preferred Section 4.2 (an arbitrary section) over Section 6.2 (a study navigator sec-tion). It turns out that Section 4.2 describes graphical techniques for analyzing relationships between mathematical variables. Section 6.2 on the other hand explains how foreign exchange rates are determined and studies how differences in inflation and interest rates between countries can lead to adjustment in exchange rates. Thus, Section 4.2 is likely to be preferred by a reader who is looking for tools to plot and visualize the equations in the current section, whereas Sec-tion 6.2 might appeal to a reader who wants to understand the illustraSec-tion used for explaining external shocks. Explanation for Section 5.1 is similar.
5 S
TUDENT-S
PECIFICN
AVIGATORWe now describe the extension of study navigator to incorporate the information processing preference of the student. In the student-specific navigator, we associate with each student the extent to which the student is disposed to referring later sections and denote it as thecuriosity factor. Letγ ∈ [0,1]represent the curiosity factor. A student preferring to refer only the prior sections has a curiosity factor of 0 while a student wanting to refer only the later sections has a curiosity factor of 1. Thus we allow students to control the balance between sections that help refresh material already read vs. sections that provide more advanced information.
We modify the reader model (§3.1) to take into account the curiosity factor, and compute the
significance scores based on this new model as in§3.4. Whenever the reader seeks explanation
of acphrcin sectioni, she first picks a relatedcphrc′ fromR(c)with equal probability. Then, she tosses a biased coin for which the probability of head equals γ. If the outcome is a tail
(head), the reader chooses an occurrence of c′ occurring before (after) section i, and refers to
the corresponding sectioni′ to learn more aboutc′. Thus, the modification to the model is that
instead of choosing an occurrence of acphr c′ amongst all occurrences of c′ in the book with
equal probability at each step, the reader favors a prior or a later occurrence depending on her curiosity factor. The subsequent digressions of the reader proceed in a similar fashion as before, but are biased by her curiosity factor.
5.1 USER STUDY
The goal of this study was to first validate the existence of users with different reading styles, and then to evaluate whether the corresponding study navigator is useful for them. For this study, we used 0.25 and 0.75 as two representative values of the curiosity factor. The choice,γ = 0.25 (0.75) represents diligent (curious) readers and we denote the corresponding study navigator as diligent (curious) navigator.
5.1.1 Existence of Diligent and Curious Users
Ideally we would have liked to make use of the manner in which students read from textbooks to determine their reading style. Since the adoption of electronic textbooks is still in infancy and we did not have access to usage logs, we resorted to the following procedure. For a given section, we determine the top three sections each referred by the diligent and curious navigators. We now ask a user (a Turker on the Amazon Mechanical Turk) to read the original section, followed by all the six referred sections (after randomly ordering the referred sections). The user then selects exactly three most useful sections for understanding the section out of the six referred sections. The results for each section were examined by fifteen users. We carried out this procedure for half of the sections in Grade XII Economics book (and used the remaining sections for evaluating the usefulness of the study navigator in§5.1.2).
0% 10% 20% 30% 40% 50% 60% 70% 80% 90% 100%
2.1 2.2 2.4 3.0 3.2 3.3 4.1 4.3 5.0 5.1 5.2
Section number
Relevance index (Grade XII Economics)
Figure 10: Relevance index for sections in Grade XII Economics textbook
both types of references. We define the set of diligent (curious) users to be those with curiosity index<-0.25 (>0.25). Using this procedure, we obtained 12 diligent and 5 curious users.
5.1.2 Usefulness of the Student-Specific Navigator
Given the sets of diligent and curious users, we evaluated whether the corresponding study navi-gator references are useful for these readers. We performed this experiment for half the sections in Grade XII Economics book that were not used in determining user types (see §5.1.1). For
a given section, we determined the top three sections referred by the diligent navigator as well as the top three sections referred by the curious navigator. We now provide the original section along with the top three sections referred by the diligent (curious) navigator to a diligent (curi-ous) user, after randomly ordering the referred sections. The user was asked to read the original section, followed by all the three referred sections. Then the user was asked to mark whether each referred section was useful for understanding the original section. We then computed the
relevance indexas the average fraction of references that the users considered useful.
The relevance index, averaged over all sections in Grade XII Economics book used in the evaluation, is 71%. Figure 10 shows the relevance index for different sections in this book (recall that half the sections were used for determining diligent and curious users). We observe that for 8 out of 11 sections, users considered at least two of the study navigator sections on average as useful. Thus, we conclude that the references provided by the student-specific navigator were found useful by respective type of users. We also carried out in-depth analysis similar to§4.3
that corroborated this result.
6 C
ONCLUDINGR
EMARKSWe presentedstudy navigator, one such novel functionality that can enhance the experience of studying from electronic textbooks. The goal of the study navigator is to help a student learn the material better and faster by providing easy access to concepts explained elsewhere in the book that are most relevant for understanding the present section. Our major contributions include:
• A complete design and implementation of the study navigator system.
• A novel reader model for textbooks and an algorithm for generating the study navigator based on this model.
• An extension of the study navigator and the reader model to accommodate the information
processing preference of the student. Specifically, this specialization allows a student to control the balance between references to sections that help refresh material already studied vs. sections that provide more advanced information.
• An end-to-end evaluation over a corpus of high school textbooks, demonstrating the ef-fectiveness of the proposed system across textbooks on different subjects from different grades.
R
EFERENCESAGRAWAL, R., GOLLAPUDI, S., KANNAN, A.,ANDKENTHAPADI, K. 2011. Data mining for
improv-ing textbooks.ACM SIGKDD Explorations Newsletter 13,2.
AMAZON. 2011.Amazon Mechanical Turk, Requester Best Practices Guide. Amazon Web Services.
ANDERSON, J. R. 1982. Acquisition of cognitive skill.Psychological review 89,4.
BAKEWELL, K. 1993. Research in indexing: More needed?Indexer 18,3.
BAREISS, R. AND OSGOOD, R. 1993. Applying AI models to the design of exploratory hypermedia
systems. InACM Conference on Hypertext.
BIRKERTS, S. 2006.The Gutenberg Elegies: The Fate of Reading in an Electronic Age. Faber & Faber.
BRUSILOVSKY, P. 2001. Adaptive hypermedia.User modeling and user-adapted interaction 11,1-2.
BRUSILOVSKY, P., EKLUND, J., AND SCHWARZ, E. 1998. Web-based education for all: A tool for
development adaptive courseware. InWWW.
BRUSILOVSKY, P., SCHWARZ, E.,ANDWEBER, G. 1996. ELM-ART: An intelligent tutoring system on
World Wide Web. InITS.
CDE. 2012. California Education Technology Task Force Recommendations. California Department of Education.
CHI, E. H., HONG, L., GUMBRECHT, M., AND CARD, S. K. 2005. ScentHighlights: Highlighting
conceptually-related sentences during reading. InIUI.
CHI, E. H., HONG, L., HEISER, J., AND CARD, S. K. 2006. ScentIndex: Conceptually reorganizing
subject indexes for reading. InIEEE Symposium On Visual Analytics Science And Technology. CK-12. CK-12 Foundation. http://www.ck12.org/.
CLEARY, C. AND BAREISS, R. 1996. Practical methods for automatically generating typed links. In
ACM Conference on Hypertext.
FELLBAUM, C. 1998.WordNet: An electronic lexical database. MIT Press.
FIDEL, R. 1994. User-centered indexing.Journal of the American Society for Information Science 45,8.
FORTUNATO, S., BOGUN˜A´, M., FLAMMINI, A., AND MENCZER, F. 2008. Approximating pagerank
from in-degree.Algorithms and Models for the Web-Graph, LNCS 4936.
HENZE, N. AND NEJDL, W. 2001. Adaptation in open corpus hypermedia. International Journal of
Artificial Intelligence in Education 12,4.
IMHRD. 2012.Report on Aakash tablet. Indian Ministry of Human Resource Development. JEH, G.ANDWIDOM, J. 2003. Scaling personalized web search. InWWW.
JURAFSKY, D.ANDMARTIN, J. 2008.Speech and language processing. Prentice Hall.
JUSTESON, J. S. AND KATZ, S. M. 1995. Technical terminology: Some linguistic properties and an
algorithm for indentification in text.Natural Language Engineering 1,1.
KELLY, D. 2008. Adaptive versus learner control in a multiple intelligence learning environment.Journal
of Educational Multimedia and Hypermedia 17,3. MEEKER, M. 2012. Internet trends. Tech. rep., KPCB.
MOTWANI, R.ANDRAGHAVAN, P. 1995.Randomized Algorithms. Cambridge University Press.
MULVANY, N. 2005.Indexing books. University of Chicago Press.
PAPANIKOLAOU, K. A., GRIGORIADOU, M., KORNILAKIS, H.,AND MAGOULAS, G. D. 2003.
Per-sonalizing the interaction in a web-based educational hypermedia system: The case of INSPIRE. User Modeling and User-Adapted Interaction 13,3.
REMDE, J. R., GOMEZ, L. M.,ANDLANDAUER, T. K. 1987. SuperBook: An automatic tool for
infor-mation exploration – hypertext? InACM Conference on Hypertext.
SAARI, D. 2001.Decisions and elections: Explaining the unexpected. Cambridge University Press.
SALTON, G., ALLAN, J., BUCKLEY, C., ANDSINGHAL, A. 1994. Automatic analysis, theme
genera-tion, and summarization of machine-readable texts.Science 264,5164.
THAYER, A., LEE, C. P., HWANG, L. H., SALES, H., SEN, P., ANDDALAL, N. 2011. The imposition
and superimposition of digital reading technology: The academic potential of e-readers. InCHI. TOUTANOVA, K., KLEIN, D., MANNING, C. D., AND SINGER, Y. 2003. Feature-rich part-of-speech
tagging with a cyclic dependency network. InNAACL–HLT.
TRIANTAFILLOU, E., POMPORTSIS, A., DEMETRIADIS, S.,AND GEORGIADOU, E. 2004. The value
of adaptivity based on cognitive style: an empirical study. British Journal of Educational Technol-ogy 35,1.
WANG, K., THRASHER, C., VIEGAS, E., LI, X., AND HSU, P. 2010. An overview of Microsoft Web
N-gram corpus and applications. InNAACL–HLT.
WEBER, G. AND SPECHT, M. 1997. User modeling and adaptive navigation support in WWW-based