Automated Time Study of Forwarders using
GPS and a vibration sensor
Martin Strandgard, Rick Mitchell
Abstract
Manual time and motion studies are the most common method to collect forest harvesting machine performance data. However, manual methods require skilled observers and are gener-ally limited in duration, making it difficult to obtain a sufficiently large sample for machines with long cycle times such as skidders and forwarders. Of the automated data capture tech-niques studied previously, few have the breadth and ease of application to conduct long term autonomous studies for a range of harvesting machines. Analysis of Global Positioning System (GPS) data has been successfully trialled previously to conduct time studies of comparable accuracy with skilled observers, however, these approaches have been limited by the need for a degree of manual data processing.
The current study trialled a fully automated system using analysis of GPS and vibration sensor data to estimate cycle times and time elements, and compare them with those determined using traditional time and motion studies for three forwarders at different sites. The mean difference between the cycle times estimated by the two methods was <1 second. This demon -strated the automated system’s ability to accurately determine each log landing location and extent and each work cycle start and end points. The correspondence between time elements using each approach was poorer. This was mainly caused by mislabelling of brief periods by the automated system as loading events when the forwarder slowed to negotiate steep areas at one study site. These errors may be able to be addressed by adding further rules to the auto-mated system.
Keywords: forwarder, global positioning system, multidat, automated time study, vibration sensor
1. Introduction
Time and motion studies of forest harvesting ma-chines are an important component of forest opera-tions research. In the last four years, over 20% of the articles published in the Croatian Journal of Forest Engineering and the International Journal of Forest Engineering were based on the results of time and mo-tion studies. However, tradimo-tional manual time and motion studies of forest harvesting machines are typ-ically time consuming, costly, limited in duration and involve potentially hazardous work in close proximity to heavy machinery. Direct observation of harvesting machines also requires skilled observers in order to minimise data collection errors (Nuutinen et al. 2008) and can bias study results by influencing the
opera-tor’s performance (the »Hawthorne Effect« (Hogg 2009, Magagnotti and Spinelli 2012)).
of studies have been published using harvester OBC data (e.g. Purfürst 2010, Strandgard et al. 2013). How-ever, OBCs are still rarely installed on other harvesting machines. Other automated approaches that have been used to collect harvesting machine performance data include John Deere’s TimberLink system (Gera-simov et al. 2012), CANBus (Controller Area Network) signal monitors (Nuutinen et al. 2008), dataloggers such as FPInnovation’s MultiDat (Davis and Kellogg 2005), and Global Positioning System (GPS) data log-gers (McDonald and Fulton 2005). McDonald and Ful-ton (2005) suggested that automated time study tech-nology needs to meet a number of requirements before it can be used as a research tool. The technology must:
Þ be simple to install to minimize downtime for participants in production studies;
Þ be useful across the widest possible range of machinery systems without requiring extensive reconfiguration of the data collection system for every machine and site;
Þ survive under harsh operating conditions;
Þ produce data that duplicates that produced by a skilled field crew working on site.
Most automated data collection approaches fail to meet all the requirements: the TimberLink system is limited to late model John Deere machines; CANBus signal monitors need reconfiguration for different ma-chine types, brands and models, and; to achieve its full potential, the Multidat needs to be hardwired into the machine and can require operator input. GPS data log-gers are theoretically able to meet all the requirements (at least for skidders and forwarders). However, to meet the last requirement, requires development of methods to automatically interpret machine activities from the GPS data.
Use of GPS data in forest harvesting research is particularly suited to monitoring the activities of pri-mary transport machines, such as skidders and for-warders, because their ability to move rapidly and cover large distances makes them difficult subjects for traditional time and motion study techniques and their movements, location and speed largely define the activities they perform. In addition, their long cycle times relative to harvesting machines requires a longer period of time to collect a statistically sufficient sample size, particularly for forwarders. A number of studies have used GPS data to interpret the activities of har-vesting machines, primarily skidders (e.g. Veal et al. 2001, McDonald and Fulton 2005, Cordero et al. 2006, de Hoop and Dupré 2006). The major limitation of these studies is that they have required one or more manual steps to analyse the GPS data. de Hoop and
Dupré (2006) conducted a GPS time and motion study on skidders that involved completely manual interpre-tation of the GPS data, whereas McDonald and Fulton (2005), in their time and motion study of skidders, manually defined site specific features, such as a poly-gon defining the log deck boundaries, as an initial step prior to automated extraction of machine activities from the GPS data. Manual entry of site specific fea-tures, such as used by McDonald and Fulton (2005), may require repeated site visits by the researcher or data collection by a member of the harvesting crew or a supervisor. Ideally, an automated time and motion study system would dispense with these manual com-ponents and extract details of machine activities di-rectly from analysis of the GPS data.
The objective of the current study was to determine whether a fully automated time study system (ATSS) could be created to analyse GPS and vibration sensor data from a forwarder to accurately estimate the for-warder total cycle time and the type and duration of individual time elements.
2. Material and methods
Three sites were used in the study (Table 1). Two sites were in short rotation Eucalyptus globulus planta-tions being clearfelled for chiplogs (each studied for a part day) and one was in a thinned Pinus radiata plan-tation being clearfelled for sawlogs and pulplogs (studied over two consecutive days). Total observation time was 17.5 hours. The weather was fine and sunny for all four days. Different forwarders (Table 1) and operators were studied at each site. All the operators were experienced.
Cycle time started when the forwarder commenced travelling empty from a log landing, and ended when the forwarder had completed unloading and was about to start travelling empty. Cycles were divided into the following time elements: »Travel empty«, »Loading«, »Moving during loading«, »Travel load-ed«, »Unloading«, »Movement during unloading« and »Delays« (Table 2).
2.1 Automated time study system
using only GPS data. To overcome this limitation, the output of the Multidat internal vibration sensor was used. For each forwarder, the duration of each work cycle and type, and duration of each work element were determined through analysis of the GPS and vi-bration sensor data by the ATSS.
The methodology used by the ATSS to analyse the GPS and vibration sensor data was as follows: Step 1 (Determine the location and extent of each log landing)
The GPS used in the study recorded data to 5 dec-imal places – equivalent to an on-ground resolution of approximately 1 metre. The ATSS tallied the number of times each pair of GPS coordinates was recorded within a GPS dataset. GPS points with a high tally count relative to the remainder of the harvesting area were primarily log landings or log pickup areas. The ATSS labelled GPS points as part of a log landing if their tally count exceeded a user defined limit. Adja-cent log landing GPS points were flagged as part of the same log landing. The boundary of each log land-ing was defined by a four sided polygon generated by
the ATSS to encompass each region of high GPS point density. Polygon boundaries were extended by 5 m to allow for noise in the GPS data.
Step 2 (Find start of first work cycle)
The forwarder was defined as being at a landing if its GPS coordinates were within one of the log landing polygons defined in »Step« 1 and its speed and dis-tance travelled between consecutive GPS points fell below the user defined thresholds (1 kmh-1 and 8 m, respectively). This definition allowed for occasions when the forwarder travelled through log landings without stopping. Cycles began and ended at a log landing so the ATSS detected the start of the first work cycle as the first instance when the forwarder was at a log landing at a GPS point and then travelling at the next GPS point.
Step 3 (Identify forwarder work elements)
»Travel empty/loaded« and »Moving during un-loading/loading« were identified when the forwarder speed and distance travelled between GPS points ex-ceeded user defined thresholds. »Travel empty« and
Table 1 Site and forwarder details
Location Central Victoria South-west, Western Australia South-west, Western Australia
Species Eucalyptus globulus Eucalyptus globulus Pinus radiata
Mean tree volume, m3 0.16 0.14 1.4
Age 12 10 32
Slope, ° <5 <5 7–24
Forwarder Valmet 890.2, >10.000 engine hours Valmet 890.4, 3500 engine hours Valmet 890.3, >9000 engine hours
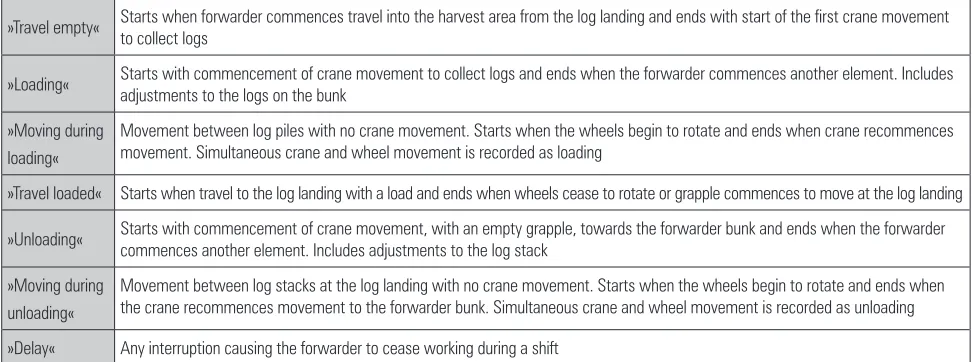
Table 2 Forwarder time element definitions
»Travel empty« Starts when forwarder commences travel into the harvest area from the log landing and ends with start of the first crane movement to collect logs
»Loading« Starts with commencement of crane movement to collect logs and ends when the forwarder commences another element. Includes adjustments to the logs on the bunk
»Moving during loading«
Movement between log piles with no crane movement. Starts when the wheels begin to rotate and ends when crane recommences movement. Simultaneous crane and wheel movement is recorded as loading
»Travel loaded« Starts when travel to the log landing with a load and ends when wheels cease to rotate or grapple commences to move at the log landing
»Unloading« Starts with commencement of crane movement, with an empty grapple, towards the forwarder bunk and ends when the forwarder commences another element. Includes adjustments to the log stack
»Moving during unloading«
Movement between log stacks at the log landing with no crane movement. Starts when the wheels begin to rotate and ends when the crane recommences movement to the forwarder bunk. Simultaneous crane and wheel movement is recorded as unloading
»Travel loaded« were distinguished by whether the for-warder had been identified as »Loading« since it was last at a log landing. »Moving during unloading« or loading was determined as travel between »Loading« or »Unloading« occasions, respectively. »Loading« was identified as periods when the forwarder was not at a landing and its speed and distance travelled fell below user defined thresholds. »Unloading« was identified as periods when the forwarder was within a log landing polygon and its speed and distance travelled between GPS points were below user defined thresholds. »De-lays« were identified as periods when the Multidat vi-bration sensor recorded that the vivi-bration had dropped below the user defined threshold for working.
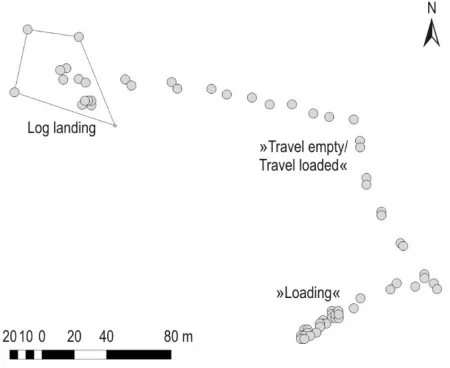
The key to the operation of the ATSS is accurate identification of the location and extent of each log land-ing. As the ATSS was designed for long observation periods, the observation periods for the study may have been too short to accurately identify all the log landings. Therefore, data from a longer time period than that used for the manual time and motion (T&M) studies at each site were analysed by the ATSS and the results corresponding to each T&M study period were extract-ed. Fig. 1 shows an example of the GPS points repre-senting a forwarder cycle and a log landing.
Extraction distance in each cycle was also esti-mated by the ATSS by adding the estiesti-mated dis-tance between consecutive GPS point coordinates (Mean extraction distance = 359 m, Range = 152–868 m). A comparison with manual distance estimation ap-proaches was not made in this study.
2.2 Time and motion studies
At the two Eucalyptus globulus sites, forwarder ele-mental times (Table 2) were recorded by single observ-ers using the TimerPro Professional software (www. acsco.com) installed on a Personal Digital Assistant (PDA). At the Pinus radiata site, the forwarder activities were captured using a digital video camera and ele-mental times were later recorded from the video record-ings using the TimerPro Professional software. 2.3 Data analysis
The ATSS and T&M data for forwarder cycle times and »Loading«, »Unloading«, »Travel empty«, »Trav-el loaded« and »D»Trav-elay« »Trav-elemental times were com-pared using the Bland Altman Method (Bland and Altman 1986). Mean bias (mean difference between the T&M and ATSS values), limits of agreement (bias ±1.96 x standard deviation of the bias (SD)) and percentage error (1.96 x SD divided by the mean ATSS and T&M cycle or elemental times) were calculated for cycle and elemental times. The acceptable percentage error limit was set at ±30% (Critchley and Critchley 1999). Root Mean Square Errors (RMSE) were also cal-culated. »Moving« during loading and »Moving« dur-ing unloaddur-ing elements were excluded from the anal-ysis as they were minor components of the forwarder work cycles and did not occur in every cycle.
3. Results
3.1 Cycle timesThirty one forwarder cycles were recorded by the ATSS and manual T&M (8 per Eucalyptus globulus site, 15 at the Pinus radiata site). At the Pinus radiata site, the GPS signal was lost for periods of approximately 5 hours on each study day (study data was collected prior to GPS signal loss on each day). Analysis using Trimble’s mission planning software (http://ww2.trim-ble.com/planningsoftware_ts.asp) suggested the sig-nal was lost due to occlusion of several GPS satellites by the hill the forwarder was working on. When the GPS signal was available, the ATSS was able to detect 100% of the forwarder cycles.
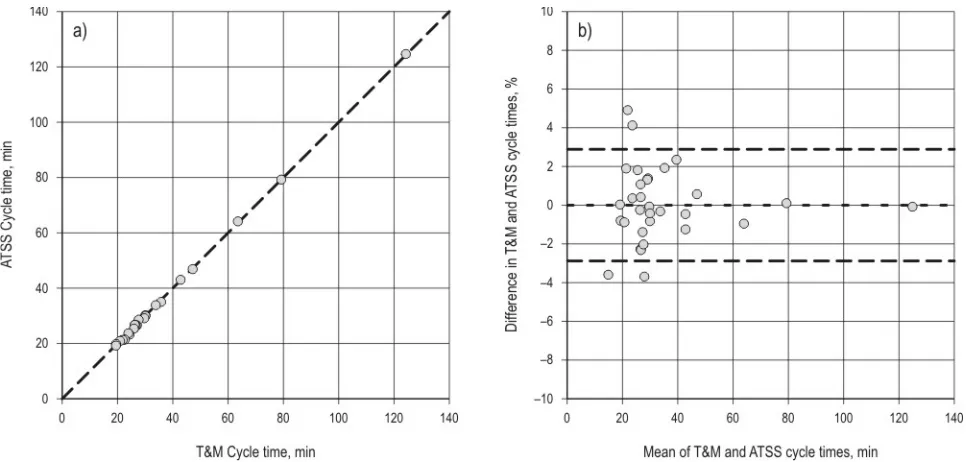
Individual forwarder cycle times estimated from the ATSS and T&M were very close with a mean dif-ference of less than one second (Fig. 2 and Table 3). The percentage error for the ATSS and T&M cycle time differences was well within the limit of acceptability.
3.2 Elemental time
»Unloading« times and »Delay« times were the most consistent elemental times between the ATSS and
Fig. 1 Example of GPS points representing a forwarder cycle
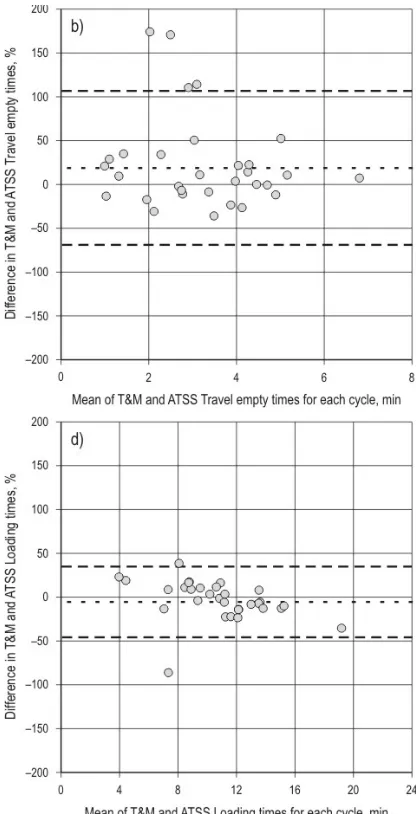
T&M estimates (Fig. 3a, Fig. 3e, Fig. 4a and Fig. 4e) and »Travel empty« and »Travel loaded« times (Fig. 3b, Fig. 3c, Fig. 4b and Fig. 4c) were the least consistent. Percentage error values reflected the differences in consistency, with the percentage error values for »Un-loading« and »Delay« times being within the limit of acceptability, whereas those for the »Travel empty« and »Travel loaded« times were well outside the limit of acceptability (Table 3). The major cause of the varia-tion between the ATSS and T&M travel times were instances when the operator stopped or slowed the forwarder while travelling, which were interpreted by the ATSS as a Loading event, which caused the misla-belling of subsequent travel times. Although »Load-ing« times (Fig. 3d and Fig. 4d) were reasonably
con-sistent between the ATSS and T&M times, the percentage error for this element was outside the lim-it of acceptabillim-ity. The outliers resulted from a number of »Movement« during loading events that were re-corded in the T&M study, but was just below the ATSS speed threshold used in the study (1 km h–1).
4. Discussion
The ATSS analysis detected all 31 forwarder cycles observed during the corresponding traditional T&M studies and accurately estimated cycle times com-pared with the results of the T&M studies, however the correspondence between individual time elements was poorer. This is comparable to the findings of
Mc-Table 3 Mean, limits of agreement, percentage error and RMSE of cycle times and elemental times for travel empty, loading, travel loaded,
unloading and delays (minutes)
Cycle or elemental time Mean (ATSS) Mean (T&M) Limits of agreement % error RMSE
»Cycle time« 34.2 34.2 –1.0 to 1.0 2.9 0.48
»Travel empty« 2.9 3.5 –2.2 to 3.4 86.4 1.5
»Loading« 11.0 10.4 –4.9 to 2.16 39.4 2.2
»Travel loaded« 2.6 3.0 –3.4 to 4.2 130.8 1.9
»Unloading« 9.8 9.2 –3.2 to 2.2 27.9 1.4
»Delay« 5.6 5.9 –1.3 to 2.1 29.2 0.96
Fig. 2 a) Plot comparing ATSS and T&M cycle times (1:1 line shown); b) Difference in cycle times (T&M–ATSS) (%) against the mean of
ements. They suggested implementing additional rules to detect these unusual events, which may be a possible solution for the ATSS.
Although the percentage error for the differences in the ATSS and T&M »Delay« times was within the limit of acceptability, the mean T&M delay time was slightly higher than the mean ATSS delay time. This was caused by the Multidat being set to record delays of one minute or greater, which resulted in a number of minor delays being included in the T&M data but not the ATSS data. In future studies, the Multidat min-imum delay length could be set to a smaller value to examine the impact on mean delay values.
The main deficiency of using GPS data analysis for automated productivity studies is that there is no means of determining the product types and load weight or volume being carried by the forwarder. However, the use of a forwarder equipped with a set of grapple or bunk load scales could address this issue for single product harvest operations. Long term au-tomated productivity studies using GPS can reveal trends that are not apparent in typical short term time and motion studies, such as the differences in produc-tivity between days of the week noted by Cordero et al. (2006) and the potential areas for harvest system improvement suggested by McDonald and Rummer (2002). Absence of an observer, when using automated time study technology, is assumed to overcome the »Hawthorne Effect«, however, there may still be an effect on machine operator performance from the pres-ence of the data collection technology, especially if it has been temporarily installed for the duration of a study.
GPS signal loss has been reported from a number of machine tracking studies (McDonald et al. 2000, Veal et al. 2001, McDonald and Fulton 2005, Hejazian et al. 2013), although only Veal et al. (2001) found a cause to the signal loss in their study (tree canopy). The GPS signal loss that occurred on the Pinus radiata
site in the current study was believed to result from the occlusion of satellites close to the horizon caused by the hill the forwarder was working on. Use of Glob-al Navigation Satellite System (GNSS) receivers that combine signals from both the GPS and GLONASS constellations is likely to significantly reduce instanc-es of signal loss and also to improve the positional accuracy as they can access signals from over 50 satel-lites. However, as mentioned previously, the GNSS data would need to be combined with a means of de-tecting delays, such as the Multidat vibration sensor or a link to the engine management system to record engine rpm and/or load.
Donald and Fulton (2005) in their GPS based auto-mated time study of skidders. The good correspon-dence between the ATSS and T&M cycle times in the current study probably reflected the well-defined cy-cle start/end point, which has a strong contrast in ac-tivity when the forwarder finishes unloading at a log landing and commences travelling empty (typically operating at its highest travel speed (Stankić et al. 2012)).
The good correspondence between the ATSS and T&M cycle times also suggested the ATSS was able to accurately identify the location and extent of the log landings at the three sites. As mentioned previously, this step is critical to the operation of the ATSS. Poten-tial log landing identification errors are:
Þ erroneously labelling an area as a log landing (false positive);
Þ failing to detect a log landing (false negative). However, for a false positive to impact the analysis, the forwarder speed and distance, when travelling through an incorrectly labelled area, would need to be below the threshold values. This is likely to be a rare occurrence, although it is theoretically possible that a terrain feature could concentrate the forwarder activ-ity in an area, and slow it sufficiently for it to be both incorrectly labelled as a log landing and for travel to be recorded as unloading. A false negative could occur when a log landing is used infrequently or the GPS data were collected over part of the harvesting opera-tion. For the latter reason, GPS data collected over a period greater than that for the T&M study were used to generate the ATSS results. There was no evidence of false positives or false negatives occurring during the study.
el-5. Conclusion
Time and motion studies of forest harvesting ma-chines are an important component of forest opera-tions research. However, traditional time and motion studies are generally impractical for long term studies. In the current study, the mean forwarder cycle time estimated using automated analysis of GPS and vibra-tion sensor data was less than 1 second from the mean cycle time determined from traditional time and mo-tion studies. The percentage error was also well with-in the limit of acceptability. For harvest areas produc-ing a sproduc-ingle product, combinproduc-ing the cycle times estimated from the GPS and vibration sensor data with output from a forwarder grapple or bunk load scale could be used to conduct long term, autonomous forwarder productivity studies which would allow examination of long term trends in forwarder produc-tivity. However, results for individual time elements were poorer, mainly due to mislabelling of brief peri-ods, when the forwarder stopped or travelled slowly manoeuvring on a steep slope. Inclusion of additional rules in the automated GPS data analysis may address this issue.
Acknowledgements
The authors would like to thank the forest manag-ers and harvesting contractors, and in particular the forwarder operators at each of the three sites without whom the study would not have been possible.
6. References
Bland, J.M., Altman, D.G., 1986: Statistical methods for as
-sessing agreement between two methods of clinical mea
-surement. Lancet 327(8467): 307–310.
Cordero, R., Mardones, O., Marticorena, M., 2006: Evalua
-tion of forestry machinery performance in harvesting op
-erations using GPS technology. In: P.A. Ackerman, D.W. Längin, M.C. Antonides (Eds.), Precision Forestry in Planta -tions, Semi Natural and Natural Forests. Proceedings of the International Precision Forestry Symposium, Stellenbosch University, South Africa.
Critchley, L.A., Critchley, J.A., 1999: A meta-analysis of stud -ies using bias and precision statistics to compare cardiac
output measurement techniques. Journal of Clinical Moni
-toring and computing 15(2): 85–91.
Davis, C.T., Kellogg, L.D., 2005: Measuring machine produc -tivity with the MultiDAT datalogger: A demonstration on three forest machines. USDA Forest Service. Gen. Tech. Rep. PSW-GTR-194.
de Hoop, C., Dupré, R.H., 2006: Using GPS to Document
Skidder Motions – A Comparison with Manual Data Collec
-tion. Council on Forest Engineering (COFE) Conference
Proceedings: »Working Globally – Sharing Forest Engineer
-ing Challenges and Technologies Around the World«. Coeur d’Alene, July 22–2 August.
Gerasimov, Y., Senkin, V., Väätäinen, K., 2012: Productivity of single-grip harvesters in clear-cutting operations in the
northern European part of Russia. European Journal of For
-est Research 131(3): 647–654.
Hejazian, M., Hosseini, S., Lotfalian, M., Ahmadikoolaei, P., 2013: Possibility of global positioning system (GPS) applica -tion for time studies in forest machinery. European Journal of Experimental Biology 3(4): 93–98.
Hogg, G.A., 2009: Multistem mechanised harvesting opera
-tion analysis – Applica-tion of discrete-event simula-tion. Un -published Master of Science in Forestry thesis. University of Stellenbosch, 2009.
Magagnotti, N., Spinelli, R., (eds.)., 2012: Good practice guidelines for biomass production studies. COST Action
FP-0902, WG 2 Operations research and measurement method
-ologies. 1–44.
McDonald, T.P., Fulton, J.P., 2005: Automated time study of skidders using global positioning system data. Computer and Electronics in Agriculture 48(1): 19–37.
McDonald, T., Rummer, B., 2002: Variation in skidder pro
-ductivity over time in timber harvest. In: Proceedings of the
25th Annual COFE Meeting on Forest Engineering Chal
-lenges: A Global Perspective. Auburn, AL. Council of Forest Engineers, Portland, OR, 1–5.
McDonald, T.P., Rummer, R.B., Taylor, S.E., 2000: Automated time study of feller bunchers. In: Proceedings, 23rd annual
meeting of the Council on Forest Engineering. 11–14 Sep
-tember, Kelowna, BC. Corvallis, OR: Council on Forest En
-gineering: 1–4.
Nuutinen, Y., Väätäinen, K., Heinonen, J., Asikainen, A., Röser, D., 2008: The accuracy of manually recorded time study data for harvester operation shown via simulator screen. Silva Fennica 42(1): 63–72.
Purfürst, F.T., 2010: Learning Curves of Harvester Operators. Croatian Journal of Forest Engineering 31(2): 89–97. Skogforsk, 2012: StanForD. Listing of variables by category.
Retrieved May 6, 2014, from http://www.skogforsk.se/Page
-Files/60712/AllVarGrp_ENG_120418.pdf.
Stankić, I., Poršinsky, T., Tomašić, Ž., Tonković, I., Frntić M.,
2012: Productivity Models for Operational Planning of Tim
-ber Forwarding in Croatia. Croatian Journal of Forest Engi -neering 33(1): 61–78.
Strandgard, M., Walsh, D., Acuna, M., 2013: Estimating har -vester productivity in Pinus radiata plantations using Stan -ForD stem files. Scandinavian Journal of Forest Research 28(1): 73–80.
Received: October 09, 2014 Accepted: January 28, 2015
Authors’ address: Martin Strandgard*
e-mail: [email protected]
Australia Forest Operations Research Alliance (AFORA)
University of the Sunshine Coast 500 Yarra Boulevard
3121 Richmond AUSTRALIA Rick Mitchell
e-mail: [email protected]
Australia Forest Operations Research Alliance (AFORA)
University of the Sunshine Coast 35 Shorts Place
6330 Albany AUSTRALIA