Study on Effect of Process Parameters on Tensile
Properties of Groundnut Shell-Vinyl Ester Composites:
Analysis Using Design of Experiments
G. U. Raju
1*, S. Kumarappa
2, V. N. Gaitonde
31 Department of Mechanical Engineering, B. V. B. College of Engineering and Technology Hubli, Karnataka,
India.
2 Department of Mechanical Engineering, Bapuji Institute of Engineering and Technology, Davangere,
Karnataka, India
3 Department of Industrial and Production Engineering, B. V. B. College of Engineering and Technology,
Hubli, Karnataka, India.
* Corresponding author: Email: [email protected], [email protected] Manuscript submitted May 26, 2015; accepted October 8, 2015.
Abstract: Natural lignocellulosic fibers have an excellent potential as reinforcement in polymer industries. Further, ecological concern has triggered a significant interest in effective utilization of natural resources to produce eco-friendly products. The study emphasizes on the characterization of lignocellulosic composites using groundnut shell particles as reinforcement. The samples were prepared with different process parameters, namely, particle size, filler loading and alkali treatment of particles. The experiments were planned as per full factorial design. The relationships between process parameters and tensile strength and tensile modulus have been established by developing response surface methodology based models. The RSM based second order mathematical models are used to predict the tensile properties. The adequacy of the proposed second order mathematical models has been tested through the analysis of variance (ANOVA). The statistical measures and the validation tests show the excellent adequacy of the quadratic models. From parametric analysis, it is revealed that tensile strength and tensile modulus increase with increased filler loading up to 50-wt % and beyond 5% NaOH treatment of particles.
Key words: Groundnut shell particle, vinyl ester, Design of Experiments (DOE), Response Surface Methodology (RSM), mechanical properties
1.
Introduction
natural fibres have got high mechanical and thermal properties [1-2] and hence used as an alternative for the artificial fibres. Low specific weight, which results in a higher specific strength and stiffness than glass is a benefit especially in parts designed for bending stiffness. Lignocellulosic natural fibers such as jute, flax, hemp coir and sisal have all proved to be good reinforcement in polymer matrices and are being used in automotive applications [3-4], packaging industries [5] and in construction [6].
Singha and Thakur [7] prepared the new composite material using hibiscus sabdariffa fiber as a reinforcing material in urea–formaldehyde (UF) polymer matrix and investigated the mechanical properties. The reinforcing of the resin with hibiscus sabdariffa fiber was accomplished in three different forms: particle size, short fiber and long fiber. It was observed that the composites with particle reinforcement showed more tensile and compressive strength, which was followed by short and long fiber reinforced composites. The particle reinforcement decreases the wear rate to a much more extent than short and long fiber reinforcements. From these results, it is revealed that particle reinforcement is more effective than short and long fiber reinforcements, mainly due to larger surface area and more fiber-matrix interaction in the particle reinforced composites. Bakare [8] developed the composite materials from locally available agricultural based renewable resources. The natural fiber-reinforced rubber seed oil-based polyurethane composites were prepared and it was observed that the tensile strength and modulus, flexural strength and modulus of the composites increase with increased fiber loading.
The extensive studies on properties of polymer composites filled with natural fibers such as, kenaf [9], jute [10], sisal [11], rice husk [12], bagasse [13], pineapple [14] and Lantana camara fiber [15] have also been carried out. Kalaycioglu and Neemli [9] investigated the usage of kenaf stalks as raw material for particleboard manufacturing and the results showed that kenaf is a superior agricultural residue in terms of its dimensional stability, physical and mechanical properties. Rahman et al.[10] fabricated jute fiber reinforced polypropylene composites with 20 to 35wt % fiber loadings. It was found that post-treated jute fiber reinforced composites exhibit better mechanical properties as compared to raw ones and 30% filler loaded composites had the optimum set of mechanical properties. Deo and Acharya [15] studied the moisture absorption behavior and its effect on mechanical properties of Lantana camara fiber reinforced epoxy composite. It was found that tensile and flexural strength increase with increased fiber content up to 30%. The tensile and flexural strength of composites decreased with the moisture absorption.
The natural fiber composites found many applications in automotive industries, construction and packaging. However, the drawbacks of these fibers have prevented extended utilization, especially in higher load carrying applications. The lack of adhesion to the polymeric matrices is one of the obstructions for the lignocellosic fibers. The hydrophilic nature of the natural fibers adversely affects the adhesion to the hydrophobic matrix, resulting in poor strength properties. To improve this condition, the fiber surfaces need to be treated in order to promote good adhesion between the fibers and the matrix. Better adhesion between the fiber and the polymeric matrix is basically enhanced through a hydrophobic fiber surface. It is necessary to impart hydropobicity to natural fibers by appropriate techniques such as chemical treatment, acetylation, etc. The chemical treatment allows a better adhesion between the fiber-matrix and considerably reduces the thermal contact resistance [16]. It has also been reported that NaOH treatment of fiber allows significant increase of thermal and mechanical properties of composites [17]. By the dissolution of lignin in alkali some pores are formed on the fiber surface that improves the contact area between the fiber and the matrix.
available in abundance at low cost. Hence, the present work planned at the development and characterization of novel green composites comprising of groundnut shell particle as reinforcement and vinyl ester polymer as matrix. The effects of three process parameters, namely, particle size, percent NaOH and percent filler weight on tensile properties have been studied.
The conventional method of experimentation involves the variation of one parameter at a time, while keeping the other parameters at fixed levels. This method is generally time consuming and requires a considerable number of experiments to be carried out and does not include interactive effects among the variables. The response surface methodology (RSM) using statistical design of experiments (DOE) proved to be an efficient modeling tool [18-20]. The methodology not only reduces the cost and time, but also gives the required information about the main and interaction effects with reduced number of experiments. Hence, in the present study, the experiments were conducted as per full factorial design (FFD) to analyze the interaction effects of process parameters on tensile properties. The influence of the process parameters are investigated simultaneously to study their effects using second order RSM based mathematical models.
1.1. Response Surface Methodology
The response surface methodology (RSM) is an efficient modeling tool used for establishing the relationship between the independent process parameters and the responses with the desired criteria. The RSM is useful for developing, analyzing, improving and optimizing the process, which provides an overall perspective of the system response within the design space [18-20]. The modeling of desired criteria to various input process parameters can be obtained through design of experiments (DOE) and then applying the regression analysis. RSM adopts both the mathematical and statistical techniques to describe the influence of the interactions of parameters on responses when they are varied simultaneously.
In many situations, it is possible to represent the independent process parameters in quantitative form and these parameters can be thought of having a functional relation or response, which can be expressed as [18-20].
)
x
,...
x
,
x
,
x
(
Y
1 2 3 k(1) where Y is the response, x1, x2, x3,…. xk are the process parameters and ϕ is the response function. When the
mathematical form of response function is not known, it can be approximated within the experimental region by a polynomial. Higher the degree of polynomial better the correlation but the experimentation costs increase.
2.
Experimental Details
2.1. Planning of Experiments
The planning of experiments is essential to construct the mathematical models based on RSM. The mathematical modeling provides reliable equations obtained through the data of properly designed experiments that can significantly reduce the number of experiments as compared to traditional experimental design. In the present study, particle size, % NaOH and % filler weight are considered as the process parameters. The ranges of the process parameters were selected based on preliminary experiments. Three levels for each of the three parameters were selected to study the non-linearity effect of the process parameters and thus twenty-seven trials based on 33 full factorial design (FFD) were planned
Table 1. Process Parameters and Their Levels
Parameters Unit Designation Levels
Natural Form Coded Form -1 0 1
Particle size mm P X1 0.3 0.6 1
NaOH % N X2 1 5 10
Filler weight % F X3 10 30 50
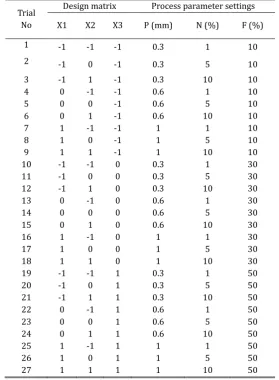
Table 2. Design Matrix and Experimental Layout Plan as Per FFD
Trial No
Design matrix Process parameter settings
X1 X2 X3 P (mm) N (%) F (%)
1 -1 -1 -1 0.3 1 10
2 -1 0 -1 0.3 5 10
3 -1 1 -1 0.3 10 10
4 0 -1 -1 0.6 1 10
5 0 0 -1 0.6 5 10
6 0 1 -1 0.6 10 10
7 1 -1 -1 1 1 10
8 1 0 -1 1 5 10
9 1 1 -1 1 10 10
10 -1 -1 0 0.3 1 30
11 -1 0 0 0.3 5 30
12 -1 1 0 0.3 10 30
13 0 -1 0 0.6 1 30
14 0 0 0 0.6 5 30
15 0 1 0 0.6 10 30
16 1 -1 0 1 1 30
17 1 0 0 1 5 30
18 1 1 0 1 10 30
19 -1 -1 1 0.3 1 50
20 -1 0 1 0.3 5 50
21 -1 1 1 0.3 10 50
22 0 -1 1 0.6 1 50
23 0 0 1 0.6 5 50
24 0 1 1 0.6 10 50
25 1 -1 1 1 1 50
26 1 0 1 1 5 50
27 1 1 1 1 10 50
2.2. Materials
2.2.1.
Groundnut shell
2.2.2.
Vinyl ester
A vinyl ester resin has excellent physical and mechanical properties and is well known for its versatility as a composite matrix. With the development of a promising room temperature molding technology, the processability of vinyl ester resin at low temperatures, superior chemical resistance and fast chemical set has attracted considerable attention from the composite industry. The vinyl ester of grade polyflex GR 200-60 was used with hardener (Di methyl aniline), catalyst (methyl ethyl ketone peroxide) and accelerator (cobalt octate) with 1.5wt % to prepare the composite specimens.
Table 3. Chemical Composition of Natural Resources
Species Cellulose
(wt%)
Hemicellulose (wt%)
Lignin (wt%)
Ash (wt%)
Reference No.
Coir 32-43 0.15-0.25 40-45 - [21]
Sisal 63-64 12 10-14 - [21]
Jute 61-71.5 12-20.4 11.8-13 2 [22]
Kenaf 31-39 21.5 15-19 - [22]
Hemp 70.2-74.4 17.9-22.4 3.7-5.7 - [22]
Bagasse 40-46 24.5-29 12.5-20 1.5-2.4 [23]
Groundnut shell 35.7 18.7 30.2 5.9 [24]
Rice husk 31.3 24.3 14.3 23.5 [24]
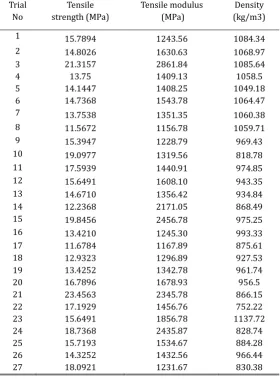
Table 4. Tested Values of Tensile Properties as Per FFD
Trial No
Tensile strength (MPa)
Tensile modulus (MPa)
Density (kg/m3)
1 15.7894 1243.56 1084.34
2 14.8026 1630.63 1068.97
3 21.3157 2861.84 1085.64
4 13.75 1409.13 1058.5
5 14.1447 1408.25 1049.18
6 14.7368 1543.78 1064.47
7 13.7538 1351.35 1060.38
8 11.5672 1156.78 1059.71
9 15.3947 1228.79 969.43
10 19.0977 1319.56 818.78
11 17.5939 1440.91 974.85
12 15.6491 1608.10 943.35
13 14.6710 1356.42 934.84
14 12.2368 2171.05 868.49
15 19.8456 2456.78 975.25
16 13.4210 1245.30 993.33
17 11.6784 1167.89 875.61
18 12.9323 1296.89 927.53
19 13.4252 1342.78 961.74
20 16.7896 1678.93 956.5
21 23.4563 2345.78 866.15
22 17.1929 1456.76 752.22
23 15.6491 1856.78 1137.72
24 18.7368 2435.87 828.74
25 15.7193 1534.67 884.28
26 14.3252 1432.56 966.44
2.3.
Preparation of Composite Specimens
A mould with suitable dimensions was used to prepare the groundnut shell particles reinforced vinyl ester (GSPV) composite boards. Proper measured quantity of groundnut shell particles and vinyl ester resin were stirred thoroughly to get homogeneous mixture. 1.5wt % of Di methyl aniline hardener, 1.5wt % of methyl ethyl ketone peroxide catalyst and 1.5wt % of cobalt octate accelerator was used to prepare the composite specimens. After adding the hardener, catalyst and accelerator, the mixture was again stirred and thoroughly mixed mixture was placed in the mould and compressed uniformly. This set up was kept for 2 hours for curing and then the composite board was taken out from the mould. The specimens required for tensile and density tests have been cut from the GSPV boards as per the dimensions specified in ASTM standards. The experiments were conducted on GSPV composite specimens as per FFD (Table 2) on tensile properties.
2.3.1.
Tensile test
The tensile test method determines the tensile properties of GSPV composites in accordance with ASTM D638 standard. The test specimens were cut from the composite board and finished to accurate size. A computerized universal testing machine with a constant rate of loading of 5mm/min was used. The stress, strain and hence tensile strength and tensile modulus were calculated. Four specimens for each composite board were tested as per the standard and average value was computed.
2.3.2.
Density test
Each specimen of size 10 mm thickness, 75 mm wide and 50 mm long has been prepared as specified in ASTM D792-91 standard. The dimensions of specimen are measured to an accuracy of 0.02 mm and each specimen was weighed to an accuracy of ± 0.2 gm and then density of GSPV composite specimens was calculated.
The tested values of tensile strength (MPa), tensile modulus (MPa) and density (kg/m3) for 27 prepared
composite specimens are summarized in Table 4.
2.4.
Development of Mathematical Models
For the current investigation, the RSM has been applied for developing the mathematical models in the form of multiple regression equations. In applying RSM, the dependent parameter was viewed as a surface to which a mathematical model is fitted. For the development of regression equations related to various responses, the second order response surface has been assumed as [18-20]:
j k
j i
i ij k
i
k
i i ii i
i
X
b
X
b
X
X
b
b
Y
2
1 1
2
0
(2)
The Equation (2) assumed the surface Y, which contains linear, squared and cross product terms of variables Xi’s. The coefficient bo is the free term, the coefficients bi, are the linear terms, the coefficients bii,
are the quadratic terms, and the coefficients bij are the interaction terms. The regression coefficients of RSM
based mathematical models are determined by [18-20]:
Y
X
X
X
b
(
T)
1 T(3)
models of proposed properties in terms of actual parameters as determined by multiple regression analysis are given by:
F F F 38414 . 3 F 13719 . 0 82919 . 8 49907 . 20 Ts * N * 0.005322 * P * 0.061992 N * P * 0.44179 -* 0.001999 N * 0.102254 P * * N * 0.7165 P
* 2 2 2
(4) F F 309606 . F 142237 . 371377 . 93 . 2094 F 7686 . 9 8202 . 44 309 . 2816 3612 . 525 Tm * N * 0.016388 * P * 8 N * P * 178.035 -* 0 N * 2 P * * N * 1 P
* 2 2 2
(5) F 02308 . 0 F F 4973 . 7 F 7344 . 12 03886 . 35 02627 . 14 198 . 1113 * N * * P * 0.570327 N * P * 13.4164 -* 0.147324 N * 2.41446 -P * * N * P
* 2 2 2
(6)
where, P in mm, N in % , F in % , Ts in MPa, Tm in MPa and in Kg/m3.
The adequacy of the proposed second order mathematical models has been tested through the analysis of variance (ANOVA) [18-20]. The ANOVA consists of sum of squares and degrees of freedom and the fundamental technique is a partitioning of total sum of squares and mean squares into components such as data regression and its residual error. The mean square is the ratio of sum of squares to degrees of freedom. As per ANOVA, the calculated value of F-ratio of developed model should be more than F-table for the model to be adequate for a specified confidence interval. The ANOVA results of the proposed quadratic models are given in Table 5.
Table 5. ANOVA Results of Proposed Mathematical Models of Mechanical Properties
Properties Sum of squares Degrees of freedom Mean square F-ratio
Regression Residual Regression Residual Regression Residual
Tensile strength 145.692 74.626 9 17 16.19 4.39 3.69*
Tensile modulus 3714586 1687677 9 17 412732 99275 4.16*
Density 139235 114696 9 17 15471 6747 2.29**
*Significant at 99% confidence interval ** Significant at 90% confidence interval
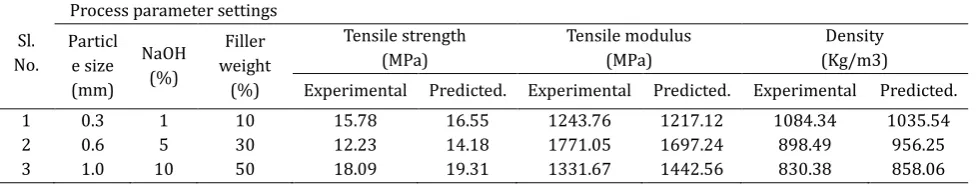
The confirmation tests were carried out to test the reliability of the developed models by performing random experiments within the ranges of the parameters selected other than those usedin FFD. The measured values were then compared with the predicted values from the developed models and it was found that these values are close to the predicted values (Table 6).
Table 6. Results of Confirmation Experiments
The statistical measures as explained above and the validation tests show the excellent adequacy of the quadratic models. Hence the proposed quadratic models are quite adequate and demonstrate the
Sl. No.
Process parameter settings Particl e size (mm) NaOH (%) Filler weight (%) Tensile strength (MPa) Tensile modulus (MPa) Density (Kg/m3)
Experimental Predicted. Experimental Predicted. Experimental Predicted.
1 0.3 1 10 15.78 16.55 1243.76 1217.12 1084.34 1035.54
2 0.6 5 30 12.23 14.18 1771.05 1697.24 898.49 956.25
independent, quadratic and interactive effects of the parameters on tensile properties. These RSM based second order mathematical models (Eqs. 4-6) are used to predict the tensile properties and density by substituting the values of particle size, % NaOH and % filler weight within the ranges of the parameters selected.
3.
Results and Discussion
In order to analyze the interaction effects of process parameters on the proposed tensile properties, the graphs were plotted considering two parameters at a time, while the other parameter was kept at center level. The variations of tensile strength, tensile modulus and density with respect to particle size, % NaOH and % filler weight are depicted in Fig. 1-Fig. 3.
3.1. Analysis of Tensile Strength
The interaction effects of process parameters on tensile strength are presented in Fig. 1, which clearly exhibit non-linear behaviour. As seen from Fig. 1(a), for any given value of NaOH treatment, the tensile strength gradually decreases as the particle size is increased from 0.3 to 1 mm. It is also observed that, for the developed GSPV composites, as the NaOH treatment increases from 1 to 3%, the tensile strength decreases and with further increased NaOH treatment, the tensile strength also increases. The maximum tensile strength was 19 MPa for 10% NaOH with 0.3 mm particle size.
As depicted in Fig. 1(b), for all values of filler loading, the tensile strength decreases sharply as the particle size increases. However, for the developed composites, as the percentage of filler loading increases from 10 to 20%, the tensile strength decreases and further increase in filler loading beyond 20%, the tensile strength increases. The maximum tensile strength of 16.86 MPa was found for 50% filler loading with particle size of 0.3 mm.
(a)
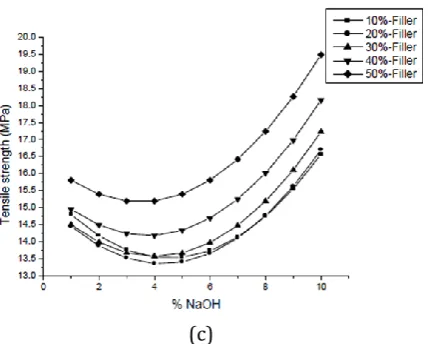
(c)
Fig. 1. Interaction effects of process parameters on tensile strength
Fig. 1(c) gives the estimated tensile strength in relation to NaOH treatment and filler loading. It is observed that for all % filler loading, the tensile strength initially decreases with increase in % NaOH up to 4% and then increases non-linearly with increased NaOH beyond 4%. At lower percent of NaOH treatment, its effectiveness in removing the impurities on the filler surfaces was low, thus resulting in poor adhesion between the filler and the matrix. The poor adhesion causes the formation of micro-voids between particles and polymer matrix, which interferes with the stress distribution and results in low tensile strength. The enhancement of tensile strength beyond 4% and till 10% alkali treated composites is attributed to the improvement in the interfacial bonding. Owing to the rough surface topology of particles after treatment resulted in mechanical interlocking of fillers with the resin that promotes more polymer-filler interpenetration at the surface [25]. This results in improved wetting of particles with resin and better filler–matrix adhesion. It is observed that for the developed composites, as percentage of filler loading increases from 10 to 20%, tensile strength decreases and further increase in filler loading beyond 20%, the tensile strength increases. The maximum tensile strength of 19.48 MPa was found for 50% filler loading with 10% NaOH treatment.
In general, tensile strength increases with increased filler content even though this increase is marginal. It is also observed that NaOH treatment of the fibers enhanced the tensile strength. Furthermore, it can be noted that tensile strength decreases with increase in particle size. The decrease in the tensile strength due to increase in particle size can be attributed to the weak interfacial adhesion or interaction between the vinyl ester matrix and the groundnut shell particles for larger particle sizes. Also, poor
interfacial bonding
between the fibers and the matrix causes inefficiency of stress transfer when stress is applied on a tensile specimen.reinforced glycerol–plasticized starch composites have been reported by Corradini et al [28] and Karmarkar et al [29].
3.2.
Analysis of Tensile Modulus
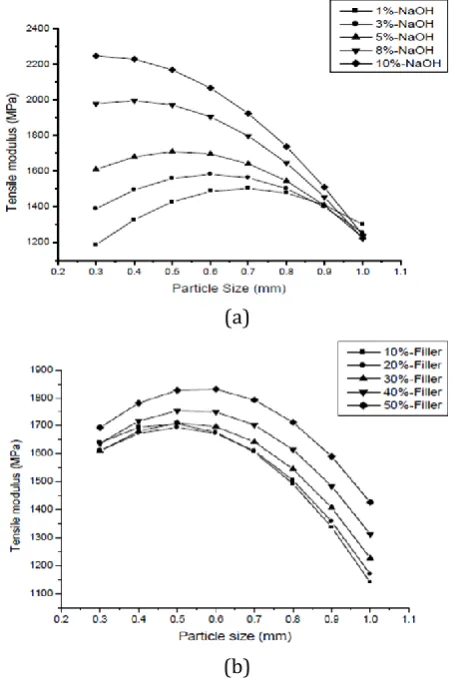
The variations due to particle size with NaOH treatment, particle size with filler loading and NaOH treatment with filler loading on tensile modulus are shown in Fig. 2.
Fig. 2(a) indicates that for 1% NaOH, the tensile modulus non-linearly increases as the particle size increases from 0.3 to 0.6 mm and with further increase in the particle size from 0.6 to 1 mm, the tensile modulus decreases. The similar behaviour is observed for 3% and 5% NaOH treatment, however for 8% and 10% NaOH treatment, the tensile modulus decreases as the particle size increases from 0.3 to 1 mm. Fig. 2(a) also indicates that tensile modulus is sensitive to variations in NaOH treatment at lower values of particle size as compared to particle size values and it is also seen that the influence of NaOH treatment is less on tensile modulus at higher values of particle size. The tensile modulus is found to be maximum (2247.60 MPa) at high NaOH treatment (10%) with low particle size (0.3 mm).
Fig. 2(b) shows the interaction plot of particle size with filler loading on tensile modulus. For all values of filler loading, the tensile modulus increases with increased particle size from 0.3 to 0.5 mm and thereafter the tensile modulus decreases beyond 0.5 mm particle size. It is also observed that, for the developed composites, as the percentage of filler loading increases the tensile modulus increases. The maximum tensile modulus of 1830MPa was found for 50% filler loading with 0.6 mm particle size.
Fig. 2(c) represents the behaviour of NaOH treatment with filler loading on tensile modulus, which clearly indicates synergetic interaction. The tensile modulus increases linearly with increase in NaOH treatment for a given value of filler loading and with further increase in filler loading the tensile modulus increases. The tensile modulus is maximum (2202 MPa) at high filler rate (50%) with high NaOH treatment (10%).
(a)
(c)
Fig. 2. Interaction effects of process parameters on tensile modulus
The experimental results show that the maximum tensile modulus is for higher filler loading and this observation may lead to the conclusion that this property does not depend on the particle–matrix interface properties, but more likely on the filler content. Increase in tensile modulus for higher filler loads are due to particles with higher stiffness than the matrix. It was noted that the most prominent effect of particles is the increase in modulus of the resultant composites.
3.3.
Analysis of Density
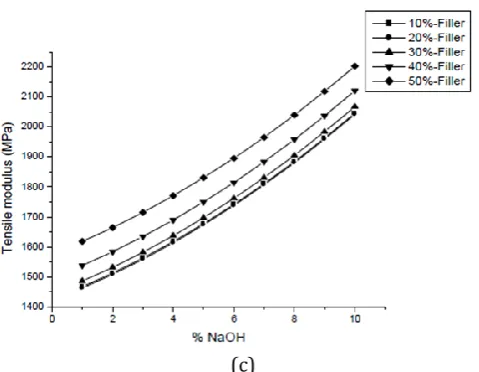
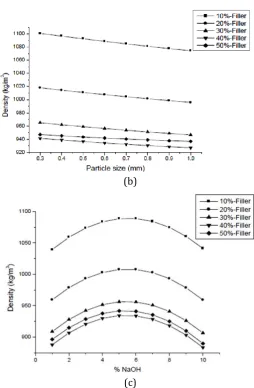
The graphs showing the interaction effects of process parameters on density are presented in Fig. 3. As seen from Fig. 3(a), for 5, 8 and 10% NaOH treatment of particles, the density linearly decreases with increased particle size from 0.3 to 1 mm. However, the density is highly sensitive to variations in NaOH treatment of particles at higher values of particle size compared to lower values. On the other hand, for 1% NaOH treatment of particles, the density sharply increases with particle size and the density almost remains constant for 3 % NaOH treatment of particles. The maximum density is observed at 965 kg/m3 for 0.3 mm particle size with 5% NaOH treatment of particles. On treating the groundnut shell particles with NaOH, the surface wax and other organic materials are removed that leads to decrease in particle size. But, the reduction in size is more significant beyond 3% NaOH concentration as shown in Fig. 3(a). Moumita Bera et al. [30] also reported the similar behaviour for jute fiber treated with different concentration of NaOH. It was observed that linear density of fiber reduced significantly beyond 4% NaOH concentration. Mohanty et al. also [31] reported that alkali treatment reduces the fiber diameter.
(b)
(c)
Fig. 3. Interaction effects of process parameters on density
Fig. 3(b) displays the interaction effect of particle size with filler loading. As seen from this figure, for a given value of filler loading, the density sharply decreases with increased particle size and with increase in filler loading the density further decreases linearly. It is observed that the particle size is highly sensitive to variations to density at all values of filler reading. There are no significant variations in the density values for 40% as well as 50% filler loading. The maximum density of 1100 kg/m3 would appear at 0.3 mm particle size with 10% filler loading.
Fig. 3(c) shows the estimated response surface for the density in relation to the processing parameters of NaOH treatment of particles with filler loading. As can be clearly seen from figure, the density value tends to increase with NaOH treatment to a maximum value and after which it tends to decrease beyond 6% NaOH for all values of filler loading. However, with increase in filler loading, the density decreases. The composites having particles treated with 6% NaOH shows maximum density of 1088 for 10% filler loading.
4.
Conclusions
has been used to analyze the experimental results. The adequacy of the developed models RSM based second order mathematical models was tested through the analysis of variance (ANOVA) and the confirmation experiments. The mechanical properties evaluation has been analyzed according to the developed mathematical models to yield the following conclusions. There exist non-linear relationships between the proposed tensile properties and the process parameters for groundnut shell particles reinforced vinyl ester composites, thus justifying the use of RSM based quadratic models. By increasing the filler loading up to 50-wt % with 0.3 particle size, the tensile strength of the groundnut shell particle reinforced composites increased. NaOH treatment of particles above 5% would be advantageous for increased tensile strength, certainly due to the increase in adhesion property of the particles. Tensile modulus increased by increasing the particle size upto 0.7 mm and subsequently decreases by further increasing the particle size. The groundnut shell particle reinforced vinyl ester composites satisfy the minimum requirement as specified by EN Standard 312-2 (11.5 MPa), which is used for the general application such as interior fitment. This developed composite could be used for substitution of wooden material in the application of some automobile and structural applications such as hood, roof panel, heavy-duty racks, interior designs, etc.
References
[1] Pothan, L. A., Oommen, Z., & Thomas, S. (2003). Dynamic mechanical analysis of banana fiber reinforced polyester composites. Composites Science and Technology, 63(2), 283-93.
[2] Corbiere-Nicollier, T., Laban, B. G., Lundquist, L., Leterrier, Y., Manson, J. A. E., & Jolliet, O. (2001). Life cycle assessment of biofibres replacing glass fibres as reinforcement in plastics. Resources, Conservation and Recycling, 33(4), 267-287.
[3] Marsh, G. (2003). Next step for automotive materials. Materials Today, 6(4), 36-43.
[4] Chen, Y., Chiparus, O., Sun, L., Negulescu, I., Parikh, D. V., & Calamari, T. A. (2005). Natural fibers for automotive nonwoven composites. Journal of Industrial Textiles, 35(1), 47–62.
[5] Puglia, D., Biagiotti, J., & Kenny, J. M. (2005). A review on natural fibre-based composites- Part II: Application of natural reinforcements in composite materials for automotive industry. Journal of Natural Fibers, 1(3), 23–65.
[6] Mohanty, A. K., Misra, M., & Drzal, L. T. (2002). Sustainable bio-composites from renewable resources: opportunity and challenges in the green materials world. Journal of Polymers and the Environment, 10(2), 19–26.
[7] Singha, A. S., & Thakur, V. K. (2008). Mechanical properties of natural fibre reinforced polymer composites. Bulletin of materials Science, 31(5), 791-9.
[8] Bakare, I. O., Okieimen, F. E., Pavithran, C., Abdul, K. H. P. S., & Brahmakumar, M. (2010). Mechanical and thermal properties of sisal fiber-reinforced rubber seed oil-based polyurethane composites. Materials and Design, 31(9), 4274–4280.
[9] Kalaycioglu, H., & Neemli, G. (2006). Producing composite particleboard from kenaf (Hibiscus cannabinus) stalks. Industrial Crops and Products, 24(2), 177-180.
[10] Rahman, M. R., Huque, M. M., Islam, M. N., & Hasan, M. (2008). Improvement of physico-mechanical properties of jute fiber reinforced polypropylene composites by post-treatment. Journal of Composites Part A, 39(11), 1739-1747.
[11] Silva, R. V., Ueki, M. M., Spinelli, D., Bose, F. W. W., & Tarpani, J. R. (2010). Resin-based composites thermal, mechanical and hygroscopic behavior of sisal fiber/polyurethane. Journal of Reinforced Plastics and Composites, 29(9), 1399-1417.
properties of plasticized PVC composites containing rice husk fillers. Journal of Reinforced Plastics and Composites, 27 (3), 229-243.
[13] Gajender, S., Narula, A. K., Choudhary, V., & Bhardwaj, R. (2010). Effect of particle size and alkali treatment of sugarcane bagasse on thermal, mechanical and morphological properties of PVC-bagasse composites. Journal of Reinforced Plastics and Composites, 29 (5), 731-740.
[14] Mukherjee, P. S., & Satyanarayana, K. G. (1986). Structure and properties of some vegetable fibres -Part 2 pineapple fibre. Journal of Materials Science, 21, 51-56.
[15] Deo, C., Acharya, & S. K. (2010). Effect of moisture absorption on mechanical properties of chopped natural fiber reinforced epoxy composite. Journal of Reinforced Plastics and Composites, 29(16), 2513-2521.
[16] Maries, I., Abderrahim, B., Umadevi, L., Ibos, L., Yves, C., & Thomas, S. (2006). Thermophysical properties of natural fibre reinforced polyester composites. Composites Science and Technology, 66(15), 2719-2725.
[17] Abdelmouleh, M., Boufi, S., Belgacem, M. N., & Dufresne, A. (2007). Short natural-fibre reinforced polyethylene and natural rubber composites: Effect of silane coupling agents and fibres loading.
Composites Science and Technology, 67(7-8), 1627-1639.
[18] Myers, R. H., & Montgomery, D. C. (1995). Response Surface Methodology: Process and Product Optimization Using Designed Experiments. New York: John Wiley and Sons.
[19] Khuri, A. I., & Cornell, J. A. (1996). Response Surfaces Designs and Analyses. New York: Marcel Dekker. [20] Montgomery, D. C. (2004). Design and Analysis of Experiments, New York: John Wiley and Sons.
[21] Swamy, R. P., Mohan, K. G. C., Vrushabhendrappa, Y., & Joseph, V. (2004). Study of areca-reinforced phenol formaldehyde composites. Journal of Reinforced Plastics and Composites, 23(13), 1373-1382. [22] Mohanty. A. K., Misra, M., & Hinrichsen, G. (2000). Biofibres, biodegradable polymers and
biocomposites: An overview. Macromolecular Materials and Engineering, 276-277(1), 1-24.
[23] Lu, J. Z., Qinglin, W., Negulescu, I. I., & Chen, Y. (2006). The influences of fiber feature and polymer melt index on mechanical properties of sugarcane fiber/polymer composites. Journal of Applied Polymer Science, 102(6), 5607-5019.
[24] Raveendran, K., Ganesh, A., & Khilar, K. C. (1995). Influence of mineral matter on biomass pyrolysis characteristics. Fuel, 74 (12), 1812-1822.
[25] Nor, A. I., Wan, M. Z. W., Yunus, Maizatul O., & Khalina A. (2011). Effect of chemical surface treatment on the mechanical properties of reinforced plasticized poly (lactic acid) biodegradable composites.
Journal of Reinforced Plastics and Composites, 30(5), 381-388.
[26] Raju, G. U., & Kumarappa, S. (2011). Experimental study on mechanical properties of groundnut shell particle reinforced epoxy composites. Journal of Reinforced Plastics and Composites, 30(12), 1029-1037. [27] Sultan O. (2010). Effect of fiber loading on the mechanical properties of Kenaf and Fiberfrax fiber-reinforced Phenol-Formaldehyde composites. Journal of Reinforced Plastics and Composites, 44, 2265-2287.
[28] Corradini, E., Morais, L. C., Rosa, M. F., Mazzetto, S. E., Mattoso, L. H., & Agnelli, J. A. M. (2006). A preliminary study for the use of natural fibers as reinforcement in starch–gluten–glycerol matrix.
Macromolecular Symposia, 245-246, 558-564.
[29] Karmarkar, A., Chauhan, S. S., Modak, J. M., & Chanda, M. (2007). Mechanical properties of wood-fiber reinforced polypropylene composites: Effect of a novel compatibilizer with isocyanate functional group.
Composites Part A, 38 (2), 227-233.
[31] Mohanty, A. K., Misra, M., & Drzal, L. T. (2001). Surface modifications of natural fibers and performance of the resulting biocomposites: An overview. Composite Interface, 8(5), 313-343.
Dr. G. U Raju, Associate Professor in the Department of Mechanical Engineering of B V Bhoomaraddi College of Engineering & Technology, Hubli -580 031, Karnataka, India.
Email: [email protected], [email protected]
Dr. S. Kumarappa, Associate Professor in the Department of Mechanical Engineering of Bapuji Institute of Engineeringand Technology, Davanagere -570004, Karnataka, India.
Email: [email protected]
Dr. V.N.Gaitonde, Professor, in the Department of Industrial & Production Engineering of B V Bhoomaraddi College of Engineering & Technology, Hubli -580 031, Karnataka, India.