Iranian Journal of Electrical & Electronic Engineering, Vol. 11, No. 2, June 2015 165
Modifying Nodal Pricing Method Considering Market
Participants Optimality and Reliability
A. Soofiabadi* and A. Akbari Foroud**(C.A.)
Abstract: This paper develops a method for nodal pricing and market clearing mechanism considering reliability of power system. The impacts of power system component reliability on electricity price, market participants’ profit and system social welfare is considered in this method. This paper considers reliability both for evaluation of market participant’s optimality as well as for fair pricing and market clearing mechanism. To achieve fair pricing, nodal price is obtained through a two stage optimization problem and to achieve fair market clearing mechanism, comprehensive criteria are introduced for optimality evaluation of market participant. Social welfare of the system and system efficiency are increased under proposed modified nodal pricing method.
Keywords: Cost Allocation, Locational Marginal Pricing (LMP), Market Clearing, Market Participant Evaluation, Nodal Pricing.
1 Introduction1
Pricing and market clearing mechanism are challenging issues in power market articles. Yet nodal pricing or Locational Marginal Pricing (LMP) is applied in some energy & ancillary service markets and even for transmission cost allocation and system planning [1-4]. LMP depends on line flows, generation and customer location in the network, lines losses and … hence this dependencies cause sometimes unfair nodal prices. In the following, some of the LMP defects are discussed more in details.
Based on LMP mechanism the Transco revenue doesn’t relate to the extent of generators and customers gain from transmission network [1]. For instance consider a two bus system with a load and generator at each bus. When generation in power transmitter bus increases, naturally the price in this bus increases. Despite the load of this bus decreases the line congestion between two buses, this load should pay more to gain this line caused by price increase in this bus and this is irrational. From another aspect, in this pricing method part-loaded generator determines the bus price so when a generation of a part-loaded generator increases, the bus price and therefor generator revenue increase too, without considering the efficiency of generators. The defects of LMP are discussed more in detail in [5]. Ultimately, LMP appears to be necessary, but it (in conventional format) is not certainly fair pricing method in competitive electricity markets.
Iranian Journal of Electrical & Electronic Engineering, 2015. Paper first received 21 Sep. 2014 and in revised form 20 Jan. 2015. * The Authors are with the Department of Electrical Engineering, Semnan University, Semnan.
E-mails: [email protected] and [email protected].
Some literature have been tried to address the defects of nodal pricing and related market clearing mechanism [5-18], but each of them has its own superiorities and defects. To address the LMP imperfections some papers modify the LMP through modifying OPF objective function and its constraints [5-8].
While the above researches tend to achieve fair pricing and market clearing mechanism, they don’t consider the probabilistic nature of power system. Generation, transmission and loads can affect the system reliability and fail of every generation unit or transmission line can affect LMPs. Forced outage of every market participant can face the power market to new generation commitment and new line flows and hence new LMPs.
Customer’s reliability level which is one of the key elements of improved power market has not been considered in the previous researches. The load interruption cost for each customer in a contingency state, should be modeled and considered in pricing method. From another aspect, the reliability level of each component of power system should affect its revenue. For instance, the Forced Outage Rate (FOR) of a generation unit or line should affect the revenue of the Genco and the Transco.
As a matter of fact, neglecting reliability of the system causes unfair pricing and then unfair market clearing mechanism. This paper considers the power system reliability not only for evaluation of power market participant optimality, but also for pricing and cost allocation. The effects of power system components reliability on electricity price, market participants’ profit and system social welfare is considered in proposed nodal pricing method. This
166 Iranian Journal of Electrical & Electronic Engineering, Vol. 11, No. 2, June 2015 paper modifies nodal pricing method through a two
stage optimization method considering reliability and optimality of each power market participant. At first, comprehensive benchmarks are introduced to evaluate whole system efficiency. To achieve fair pricing, nodal price has been obtained through a two stage optimization problem and to achieve fair market clearing mechanism, comprehensive criteria has been introduced for optimality evaluation of market participant. Social welfare and efficiency of power system are increased under proposed modified nodal pricing method.
In this paper in section 2 some basic relations is explained to introduce the proposed nodal pricing method. In section 3 the proposed nodal pricing method is introduced. Section 4 contains numerical result of this pricing method and also comparison of proposed method with other pricing methods and section 5 concludes the paper.
2 Basics of the Proposed Nodal Pricing Method
In proposed method at first the whole power system is divided to three parts: 1-whole system generators, 2-whole system loads, 3-Transco.
Each of these three parts has its own effects on the whole system efficiency. A criterion is introduced to evaluate the role of every part in the whole system efficiency. This comprehensive criterion is called Total Social Welfare (SWt). It is equal to the summation of whole system generators’ profit (Gprofit), whole system loads’ profit (Lprofit) and Transmission Company’s profit (Nprofit) as Eq. (1). After substituting the profits with revenue minus cost, the SWt is equal to the load revenue minus generation cost and instruction cost of lines as Eq. (1). This equation can be a comprehensive benchmark to evaluate the whole system efficiency [5]. SWt = Gprofit + Lprofit + Nprofit
= GR – GC + LR – LC + NR – IC
= – NR – GC + LR + NR – IC (1) = LR – GC – IC ($/h)
where R stands for revenue, C stands for cost, G stands for generations, L stands for loads and N stands for transmission network. In the following, the share of every group from total social welfare is determined according to its Profit Share (PS) of total social welfare.
By running an OPF (as below) the generation vector Pgand demand vector Pl are determined and then SWt
can be calculated using Eq. (1).
OPF problem:
{
}
2
min ( ( ))
,
g g g
g
GC P a P b P
GC Pg P δ
+
= × ×
∑
( )
(2)
subject to: Pgi-Pli-P(V,θ)=0, Qgi-Qli-Q(V,θ)=0, Fk≤Fkmax,
min max
gi gi gi
P ≤P ≤P , min max
gi gi gi
Q ≤Q ≤Q and
min max
i i i
V
≤
V≤
V .Allocating SWt between power market participants comes about in 2 steps. In first step it is divided to 3 parts between generation companies, Transco and customers according to their role in the optimality of whole system. Eq. (3) signifies a criterion for assessing the optimality of act for each participant group with respect to all participant groups best act. For this purpose, the present performance of each group, their optimal performance and the situation of eliminating them from the system, should be investigated. In the following a criterion for optimality evaluation of each group can be defined as Eq. (3). This equation will be utilized to settle the participant groups’ profit share. The term “co” in Eq. (3) alludes to every participants group. SWtpresence,Co, SWtabsence,Co, and SWtbest,Co represent the
Total Social Welfare for the present system , the system without the entity, and the system with its best possible behavior, respectively. Details about these quantities are described as follows.
p resen ce,C o a bsen ce,C o C o
b est,C o ab sence,C o
C o
S W t S W t
P S
(S W t S W t )
− =
−
∑
(3)2.1 Profit Share of Transco
To obtain the PS of Transco through Eq. (3) at first the SWtpresence is calculated through Eq. (1) after running
OPF (Eq. 3). The best state of a transmission company is called Reference Transmission Network (RTN) as described in detail in [1] so the SWtbest for Transco is
the total social welfare when network lines capacity are same as to RTN lines capacity. The SWtabsence for
Transco denotes the SWt in the case of removing all network lines, so just local loads & generations benefits are considered in Eq. (1). After calculating the SWtpresence, SWtabsence and SWtbest and substituting them
in Eq. (3), the PS of Transco is obtained. Now the profit share of Transco from the SWt is determined through Eq. (4).
Pr
. .
TransCo TransCo
Co Customers odusers TransCo Co
PS PS
Nprofit SWt SWt
PS PS PS PS
= =
+ +
∑
(4)2.2 Profit Share of Whole System Generators
To obtain the PS of whole system generators through Eq. (3) at first the SWtpresence is calculated
through Eq. (1) after running OPF (Eq. (2)). To calculate the SWtbest for generation companies, at first
the best state of generation companies should be defined. The best state of whole system generation is obtained through the OPF problem without considering of the generation upper limit. The SWtabsence for
Generation companies is zero since no supply and demand exists in the system without generation units. After calculating the SWtpresence, SWtabsence and SWtbest
and substituting them in Eq. (3) the PS of whole system generation is obtained. Now the profit share of Generation companies from the SWt is determined through Eq. (5).
Soofiabadi & Akbari Foroud: Modifying Nodal Pricing Method Considering Market Participants … 167
Pr
Pr
Pr
.
.
odusers Co Co
odusers
Customers odusers TransCo
PS
Gprofit SWt PS
PS
SWt PS PS PS
= =
+ +
∑
(5)2.3..Profit Share of Whole System Loads
To obtain the PS of whole system loads the SWtpresence has been calculated through Eq. (1). Load
revenue is calculated via equation αPl^2+βPl [5]. The
SWtabsence of loads is equated to zero since without
system loads, no generation exists and so the SWtabsence
for loads is equated to zero. The best state of whole system load doesn’t make any sense since the loads don’t carry out any operation or task in the system to have the best state. In another word the loads don’t have participation in any system expansion planning, neither transmission expansion plans nor generation expansion plans. So loads don’t have the best state to determine, hence the SWtbest for loads is equal to their SWtpresence.
Ultimately by calculating the SWtpresence, SWtabsence and
SWtbest and substituting them in Eq. (3) the PS of whole
system loads is calculated and the profit share of the whole system loads can be calculated through Eq. (6).
.
.
Customers Co Co
Customers
Customers produsers TransCo
PS
Lprofit SWt PS
PS
SWt PS PS PS
= =
+ +
∑
(6)Totally, according to above descriptions, each group in power system should benefit according to its effect on system efficiency. The second step of SWt allocation is allocating Lprofit, Gprofit and Nprofit between loads, Gencos and Transco respectively, which comes about via running the second stage of optimization as describe in detail in section 3-2.
3 The Proposed Nodal Pricing Method
3.1 Optimality Evaluation of Market Participants to Allocate Lprofit, Gprofit and Nprofit Between
Loads, Gencos and Transco Respectively
3.1.1 Gencos Optimality Evaluation
To allocate Gprofit between Gencos, at first a criterion should be introduced to evaluate each Genco efficiency. As regards the outage of a generation unit can increase cost of the system and also electricity price. So the force outage rate of every generator or in another word, the reliability of a Genco should affect its revenue, so the generation efficiency vector is defined as the vector containing the ratios of the producers’ expected mean revenue to their expected costs, according to Eq. (7). The symbol λ* and
λ
* denotes tothe nodal price and the average electricity price in the system respectively as defined in Eq. (7).
_
* *(1 ) / ( *(1 ))
G =λ G −FOR ⋅ G −FOR
η Q GC Q (7)
FOR is the generator unavailability possibility and the term 1-FOR denotes the generator availability possibility, therefore the term QG*(1-FOR) denotes the
available power of a generator. In another word, the power generation of a generator is QG and the revenue
of a generator is λ*Q
G if the generator is available.
3.1.2 Loads Optimality Evaluation
As expressed previously, the optimality evaluation of loads doesn’t make any sense hence the gain of a load from transmission network is considered as a criterion to allocate the Lprofit between system loads. The usage of loads from transmission network (UD) is
directly related to the net power (pi) of the bus i as Eq.
(8). The denominator of the fraction is the summation of whole inflow and outflow power at bus i. If the demand and generation are equal at bus i the net power piand
therefore UD will be zero for the load at this bus. If the
net power of bus i (pi) is positive the UD is equated to
zero since this bus injects power to the system and loads at this bus have no usage from transmission network and if the net power of bus i (pi) is negative represents
that this bus is receiving power from the system.
1
, 0
{ } , 1,2,...,
0 , 0
B
i
N i
j
D iD B
j
i
p if p
p
u i N
if p = −
⎧ < ⎫
⎪ ⎪
⎪ ⎪
= =⎨ ⎬ =
⎪ ⎪
⎪ ≥ ⎪
⎩ ⎭
∑
U (8)
By obtaining UD through above equation and
multiplying itto the instruction cost of network lines (IC), the share of each load from network instruction cost is obtained. In another word, the share of each load from the instruction cost of the lines relates to the usage of each load from transmission network (UD). Then after
subtracting the load revenue from network usage cost of load (IC*UD), the efficiency of load can be formulated
like generator efficiency as below. The dominator of this fraction denotes the load payment or load cost. As much as this cost decrease, load efficiency increase.
(
( ( ) * ) /( * ))
D = D −IC D ⋅ λ D
η L R Q U Q (9)
3.1.3 Transco Optimality Evaluation
In this paper Transco is modeled as a unique company and doesn’t have any rival in the system. Therefore Nprofit is paid to this unique company and the efficiency of Transco is just evaluated in the first stage of SWt allocation (section 2-A).
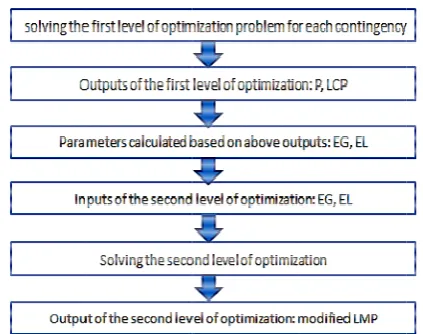
In reviewing of explained sections graphically, the two steps of SWt allocation are depicted in the Fig. 1. According to this figure the first step of SWt allocation occurs between Gencos, Transco and whole system Loads as explained in section 2. After performing the first step of SWt allocation, Lprofit, Gprofit and Nprofit are determined. Then the second step of SWt allocation allocates Lprofit, Gprofit and Nprofit between loads, Gencos and Transco, respectively.
168 Fig. 1 The tw participants.
The seco solving the t In section 3 optimization explained.
3.2 Expec (EG) C
To mod interruption first stage o customer wi electricity is This means system, custo be indirectly cost, which service for c from the vie groups are agriculture, estimated the to give secto each group, system with parameters f component, c 1 b j c c pr U = =
∏
1 b j c c D μ = =∑
+ 1 / j jd = D
wo step of SWt
nd step of SW two stage opt 3, in the fo problem t
cted Load (EL Calculation th
Optimiza
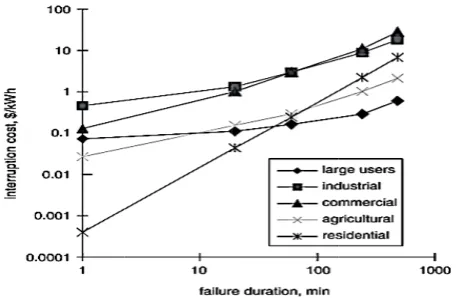
del the dem cost of load f optimization ill reduce con s higher than when a cont omer response y measured b expresses th customers. Cu
wpoint of ele : large us residential ca e customer in or Customer which is dep Nc independ for the contin can be calcula
1 c N c c b A = + ×
∏
1 c N c c b λ = + +∑
Ir allocation betw Wt allocation timization pro ollowing basi to modifyL) & Expecte hrough the Fir ation Problem
mand side should be c n problem. It nsumption wh
the custome tingency occu e to the variat by the custo he importanc ustomers class ectricity value er, industria ategories. Ref terruption cos Damage Fun picted in Fig. dent componen ngency state ated by applyi
ranian Journa
ween power ma
comes about oblem presen is of two st nodal price
ed Generatio rst Stage of m
reliability, onsidered in t is obvious t hen the price er marginal c urs in the pow
tion of prices mer interrupt ce of electri
ified in 5 gro e for them. Th al, commerc f. [19] has b sts of each gr nctions CDFs 2. In the pow nt, the reliabi
j with b fa ng Eqs. (10-1 (
( (
al of Electrica
arket via ted. tage is n the the that e of cost. wer can tion city oups hese cial, been oup for wer ility iled 2): 10) (11) (12) Fig cus opt loa sta bus acc con cap ma vol cod Fir Mi
g N∈
∑
OC P P Δ j ik S 0≤ j i V (ge pow of Ge
l & Electronic g. 2 Customer stomers.
The objecti timization pro ad curtailmen ate j, subject to
Constraint ( s. Constraint cording to c ntingency sta pacity limits, aximum perm
ltage limits re ded in Matpow rst stage of op
in f j
i Ng g
i N s NL ∑ = ∈ ∈ ∑ ∑ ∈ ∈ Subject to: 1 j j i i j ig NG s NL
N
j j i k i
P
V V Y
∈ = −
∑
∑
∑
( ) j j is isC LCP =LC
,min
j j
ig≤P ig≤ ,
j low j ig ig P ≤P −P
min ,max
j j
k ≤Sik
j is LCP LC ≤ ≤ min j j i V ≤ ≤ The output eneration vect
wer vector) a calculating eneration (EG)
c Engineering
damage funct
ive function oblem is to mi nt cost (Eq. ( o Eqs. (14-20)
14) represent (15) determi customers’ da ate j. Constrai units ramp missible load espectively. Th
wer in Matlab ptimization pr
( )
(
j j
Cig igP j NGi
j j
OCis LCPis j NLi ∑ ∈ ∑ 0 ( cos( j j is is j j
ik i k
P LCP
Y θ θ
−
−
(
j
is s
CP ×CDF d
,max
j ig
P
0 ,
j j upp ig ig P ≤ ΔP
,max j is CP max j i V of this stag tor) and LCPj at each contin Expected L ) at each bus.
g, Vol. 11, No.
tions for differ
of the fir inimize genera
13)) in every ).
ts power bala ines load cur amage functi ints (16)-(20) rates, lines d curtailment he optimizatio b software. roblem: ) ) j s + ) ) j j k ik θ δ = −
)
j d ge of optim(load curtailm ngency which Load (EL) an
2, June 2015
rent groups of
rst stage of ation cost and y contingency ance at every rtailment cost ion in every ) depict units flow limits, and buses’ on problem is
(13) (14) (15) (16) (17) (18) (19) (20) ization is Pj
ment of active are the basis nd Expected 5 f f d y y t y s , ’ s ) j e s d
Soofiabadi & Following here two pa contingency expected EG the continge These param stage of optim
At each power which
1
SN LCP=
∑
In the ab contingency contingencie normal situat
E L = D − For each power variat normal state below:
1
* SN ( p = ∑
The p*co
result of op generator is plus p*.
0
EG = p + p Fig. 3 relationship second stage by running th & LCP are o through Eqs. Then thes second stage modified nod
Fig. 3 Relat optimization p
& Akbari Foro g the first st arameters are
nature of pow G at each bus a ency nature o meters are calc
mization as ex bus the LCP h can be calcul
* j j LCP pr bove formula j. SN den es. Then EL su tion load minu
L C P h generator,
tion in contin generation (p
0 (p− p ) *pr ould be positiv ptimization p defined equa * p is graphica between inpu of optimizati he first step o obtained and u
(21)-(24). se parameters e of optimiza dal prices.
tionships betw problem.
oud: Modifying age of optim e introduced wer system at
are parameters of power syst
culated after xplained below
is load curta lated as below
prj denotes th
notes the nu upplied at eac us LCP.
p* is the ge
ngency states p0), which can
j
r ve or negative problem. The al to normal
al summary ut and outputs
ion problem. A of the optimiz utilized to calc
s (LE & EG) a ation problem
ween the stag
g Nodal Prici mization probl to consider each bus. EL s which repres tem at each b running the f w.
ailment of act w:
(2 he probability umber of t ch bus is equa
( enerator’s act with respect n becalculated
( e according to en EG for e state generat
( expresses s of the first As Fig. 3 depi zation problem
culated EL &
are applied to to calculate
ges of two st
ing Method Co em, the and sent bus. first tive 21) y of otal al to (22) tive t to d as (23) the each tion (24) the and icts, m, P EG the the tage wil (λ* mu rat pro as sec cos pro eff cal LC the com pay min con opt ( Mi λ + λ LR gen (ca cau (ca fair and of sta sta (λ)
4
RB opt con
onsidering Ma
3.3 Basis of
In second st ll be modified *EG) and exp uch as possible
The rational ional profit p ofit of a gene
expressed in ction 3-1-1).
Also for loa st) is equal t ofit. The ratio ficiency as e lculated in sec ( D) ( C Q =LR
In this stage e expected rev mpanies and yment and th nimized sub nstraints (Eq timization is f
( [ ( [ ( in EG EL E ⎧ × − ⎨ ⎩ ⋅× − λ G λ LR
Subject to th EG GC G R λ EL L
The first c neration com alculated in s
uses the whole alculated in se
r allocation o d customers a
the system. The EG and age of optimiz age of optimiz ) at each bus.
Numerical R The propose BTS reliability timization the nsidered. arket Particip
f the Second S Probl
age of optimi d so that the e ected load pay e to their ratio
revenue of a plus its genera rator is direct the Eq. (25)
ds, the payme to its revenue onal load prof
expressed in ction 3-1-2).
) D
Q −Lprofit
of optimizati venue and rati
the differen he rational p bject to sa qs. (28)-(29)) formulated as ( ) ) * EG Gprofi EL Lprofit + − ⋅ GC η
he following co Gprofit ∑ Lprofit ∑ constraint ca mpanies prof section 2 ) a e system load ection 2). Tota of SWt betw according to t
d EL vector a zation. Ultim zation problem
Results
ed nodal pric y test system e first and se
pants …
Stage of Opti lem
ization, the no expected gene
yments (λ*EL onal values.
a generator is ation cost and tly related to
(ηG has been
. ∑ ent of a custo e minus the fit is directly below equa * t⋅
∑
D D η ηion the differ ional revenue nce between payment of c atisfaction o ). The seco
below: * ]) ]) fit × ⋅×
∑
∑
G G D D η η η DBu η onstraints: SWT SWT auses the w fit be equal and The seco ds profit be eq ally these con een generatio their role in tare constant i mately the resu
m is modified
cing method i [20]. In the cond order co
169
imization
odal price (λ) erator revenue L) get close as
s equal to its d the rational its efficiency calculated in
(25) omer (or load
rational load related to its ation (ηD is
(26) ence between of generation the expected customers are of following nd stage of
⎫ ⎬ ⎭ GBuses uses (27) (28) (29) whole system l to Gprofit nd constraint qual to Lprofit nstraints cause on companies the efficiency
in the second ult of second d nodal price
is applied on first stage of ontingency is 9 ) e s s l y n d d s s n n d e g f ) m t t t e s y d d e n f s
170 Table 1 Gener
Unit capacity
(MW)
5 10 20 20 40 40
Table 2 The c
Load R LR(D
Table 3 Exp
1
0 2
1
56.95 13
Fig. 4 RBTS d
rating units’ rel
FO Number of Units
0. 0. 0.0 0.0 0. 0. 2 1 4 1 1 2
coefficients of d
Revenue (LR) D)=A*D^2+B
ected Load & E
EL of 2 3
20 83.49223 3
EG of 2 3
31.1 0
diagram with lo
Ir
liability data.
M ( MTTF
(h) OR
4380 2190 3650 1752 2920 1460 01 02 015 025 02 03
demand revenue
A
-0.011
Expected Gener
Bus (MW) 4 5
39.86294 19.45
Bus (MW) 4 5
0 0
oad & generatio
ranian Journa Bus Number TTR (h)
2 1 2 1 2 1 45 45 55 45 60 45
e function.
B
50
ration at each bu
5 6
5538 19.5512
5 6
0 0
on data.
al of Electrica r
us.
loa rel Als dep cho con
ma exi cau con alle Ex oth hig on pow gre fol for
cas wit sec me bot dep con thi ma
bus is d to gen dec gen pro inc dec
Fig
l & Electronic The diagram ad & generat iability data o so the coeffi picted in Tab oosing larger nsumedly.
Result of T aximum LCP istence of the uses congestio ntingencies a eviated throug xpected Load her buses. Rev gh value load
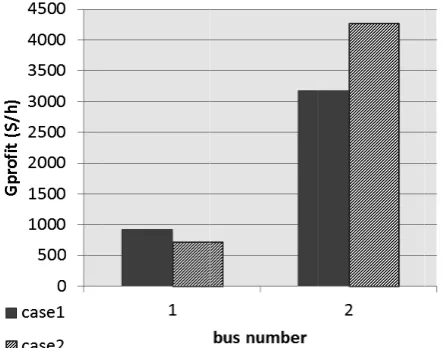
that bus. Tot wer system i eat but this llowing) have r on profit of g
Fig. 5 depic se is nodal p
thout conside cond case is n ethod in this a th for pricing picted in th nsiderable cha
s causes gre arket participa As Fig. 5 ill s 1 is lower th due to more e
bus 1. Accor nerating unit creases while nerating units oposed metho creases while
creases.
g. 5 Nodal price
c Engineering m of 6 bus re tion data is of generating u icient of dem le 2 as Ref. [ r test case
Table 3 deno among the o major part of on on lines con
and congest gh load curtai
(EL) in this versely bus 2 d and also exi ally variation in comparison
slight chang considerable generation uni ts buses’ pric prices resulte ering reliabili
nodal prices r article (consid g and market p
his figure ange with resp
at change in ants.
lustrates, the han the price a fficient genera rding to Fig.
(case 2), th at bus 2 incr s at bus 2 in c od generating e generating
es in cases 1 and
g, Vol. 11, No. eliability test
depicted in units is depict mand revenue [5]. It should
increases the
otes that bu other buses. T
f system load nnected to thi ion in thes ilment in bus
bus decrease has no LCP b istence of gen s in load and n to normal ges (as expla e effect on pri
its and loads. ces in two ca ed from Ref. ity of the sys resulted from dering reliabil participant ev the nodal pect to Ref. [5 n profits and
determined n at bus 2 in bo ator at bus 2 i 3 by conside he nodal pri reases due to s
comparison to g units’ reven units’ reven
d 2.
2, June 2015 system with Fig. 4. The ed in Table 1. e function is be noted that e calculation
s 3 has the This is due to d in bus 3 that is bus in some se lines are 3. Hence the es more than because of the neration units generation of state are not ained in the ice and there
ases. The first . [5] method stem and the the proposed lity of system valuation). As prices have 5] method and revenues of
nodal price at th cases. This in comparison ering FOR of ice at bus 1 small FOR of o bus1. So in nue at bus 2 ue at bus 1
5 h e . s t n
e o t e e e n e s f t e
t d e d m s e d f
t s n f
f n 2
Soofiabadi & Also at b nodal price d due to low consideration price at bus transmission Figs. 6 an at buses in c the generatio considerably consideration is increased i at bus 2 and generators at has a conside 4 has low v case 2. Also 2 due to high In this te supplied thro generators ar
Fig. 6 Generat
Fig. 7 Load pr
& Akbari Foro bus 3 in comp decreases whi w value load n in proposed ses 4-6 incre
lines by the l nd 7 illustrate cases 1 and 2 on profit and l y when reliab
n in case 2. Th in case 2 caus d their lower t bus 1 decrea erable change alue loads, so
whole system h nodal price a est system th ough generat re more efficie
tion profit in ca
rofit in cases 1 a
oud: Modifying parison to bus ile in case 2 i d at bus 4
d method. In eases due to
oads at these b the generatio . As depicted load profit ha bility of the s he profit of ge sed by more ef r FOR; where ases. Also loa e in compariso o its profit de m loads profit
at buses in cas he major par tors at bus 2 ent and have s
ases 1 and 2 at b
and 2 at each bu
g Nodal Prici s 4, in case 1 increases. Tha
that comes n both cases more usage buses. on and load pr d in these figu ave been chan
system comes enerators at bu fficient genera eas the profit ad profit at bu on to case 1. B ecreases more decreases in c se 2.
rt of the load 2 and also th
small FOR.
buses 1 and 2.
us.
ing Method Co the
at is to the e of
rofit ures nged s to us 2 ator t of us 4
Bus e in case
d is hese
Fig
rev of
bus tot dep in dem usi
pro of rel com
5
two and firs eva sta & the Als opt ben dem me pro in hig on sys can me pri res par
onsidering Ma g. 8 the social w
In case 2 op venues of thes
generators at As the resul s 2 increases al load profi picted in Fig.
comparison monstrates th ing the propos
Ultimately a oposed pricing
market parti iability criter mparison to th
Conclusions
This paper m o stage optim d optimality st, comprehe aluate whole age of optimiz EG are calcul e second stage so in the seco timality criter nefits vary monstrates tha ethod has grea ofits of marke market that i gher than the results, the p stem efficienc n affect noda ethod without icing. The ult sult of conside rticipant simu
arket Particip
welfare in case 1
ptimality of t ses generators
bus 2. lts demonstra
in case 2 (as it decrease ( 8 the social w
to case 1. at whole syst sed pricing me according to g method whi icipants in p ria for cost he Ref. [5] pri
s
modifies nodal mization meth of each pow ensive benchm
system effic zation, two pr lated for ever e of optimizati ond stage of o ria causes tha
according to at considering at effect on no et participants is cleared wit previous nod proposed noda cy. Results d al pricing co
considering timate result ering optimali ultaneously.
pants …
1 and case 2.
these generato s and increase
ates generator s shown in Fi as shown in welfare of cas
This incre tem efficiency ethod.
the numerica ich considers ricing and a allocation is icing method.
l pricing meth hod consideri wer market pa
marks are in ciency (SWt)
robabilistic p ry bus which a
ion to modify optimization, r at each mark o its optima g reliability in odal prices and s. Also total s th the propos dal pricing me
al pricing met demonstrate th
onsiderably h the reliability is fair pricin ity and reliabi
171 ors affect the es the revenue
s’ benefits at ig. 6) and the Fig. 7). As se 2 increases ease in SWt y is increases
al results, the the reliability lso considers s superior in
hod through a ing reliability articipant. At ntroduced to . In the first arameters EL are applied to y nodal prices. reliability and ket participant ality. Results nodal pricing d therefore on social welfare sed method is ethods. Based hod increases hat reliability hence pricing y is not a fair ng that is the lity of market
1 e e
t e s s t s
e y s n
a y t o t L o . d t s g n e s d s y g r e t
172 Iranian Journal of Electrical & Electronic Engineering, Vol. 11, No. 2, June 2015
Nomenclature
Here are symbols which are used in this paper.
Ng: Generation bus.
Nl: Load bus.
QG: Column vector of active power generation of
generator (MW).
UP G
Q : Column vector of higher active power generation limit of generator (MW).
QD:Column vector of demand of bus (MW).
δ: Column vector of voltage angle (rad).
P(δ): Column vector of net active power injected to system buses (MW).
f: Column vector of power flow in the system lines(MW).
B: transmission network susceptance matrix (NB*NB).
H: sensitivity matrix f=Hδx (NL*NL).
SWt: Total Social welfare, i.e summation of all participant economic profit in the network after running OPF ($/hour).
SWLG: Loads & Generators Social Welfare in the network after running OPF.
Gbenefit: Generators benefit in the network after running OPF ($/hour).
Lbenefit: Loads benefit in the network after running OPF ($/hour).
Nbenefit: Network benefit in the network after running OPF ($/hour).
NR: Network Revenue in the network after running OPF ($/hour).
IC:Instruction cost of lines in the network after running OPF ($/hour).
LR: Loads Revenue in the network after running OPF ($/hour).
LC: Loads Cost in the network after running OPF ($/hour).
GC: Generators Cost in the network after running OPF ($/hour).
GR: Generators Revenue in the network after running OPF ($/hour).
LCP: Load curtailment of active power.
FOR: Forced outage rate.
U: Unavailability of a component.
A: Availability of a component.
λc: Failure rate of a component.
µc: Repair rate of a component.
dj: The mean repair time of a failed component.
References
[1] D. Kirschen and G. Strbac, Front Matter: Fundamentals of Power System Economics, John Wiley & Sons, Ltd, 2004.
[2] M. Ghayeni and R. Ghazi, “Multiarea Transmission Cost Allocation in Large Power Systems Using the Nodal Pricing Control Approach”, Iranian Journal of Electrical and Electronic Engineering, Vol. 6, No. 4, pp. 238-247, 2010.
[3] A. Soofiabadi and A. Akbari Foroud, “Nodal Market Power Detection under Locational Marginal Pricing”, Iranian Journal of Electrical and Electronic Engineering, Vol. 10, No. 1, pp. 45-54, 2014.
[4] M. Amirahmadi and A. Akbari Foroud, “Optimal Spinning Reserve Requirement Determination Considering Reliability Preferences of Customers”, Arabian Journal for Science and Engineering, Vol. 39, No. 6, pp. 4945-4962, 2014.
[5] M. R. Baghaiypour and A. Akbari Fourod, “A New Market Clearing Mechanism, based on Comprehensive Welfare Allocation, Considering Participants Optimality, Efficiency and Extent of Transmission Use”, European Transaction on Electrical Power, Vol. 23, No. 6, pp. 1335-1364, 2013.
[6] H. A. Gil, F. D. Galiana and E. L. da Silva, “Nodal Price Control: A Mechanism for Transmission Network Cost Allocation”, IEEE Transactions on Power Systems, Vol. 21, No. 1, pp. 3-10, 2006.
[7] A. R. Abhyankar and S. A. Khaparde, “Electricity transmission pricing: tracing based point-of-connection tariff”, International Journal of Electrical Power & Energy Systems, Vol. 31, No. 1, 2009.
[8] B. L. P. P. Perera, E. D. Farmer and B. J. Cory, “Revenue reconciled optimum pricing of transmission services”, IEEE Transactions on Power Systems, Vol. 11, No. 3, pp. 1419-1426, 1996.
[9] P. Wang, Y. Ding and Y. Xiao, “Technique to Evaluate Nodal Reliability Indices and Nodal Prices of Restructured Power Systems”, IEE Proc.-Gener. Trans & Distrib. Vol. 152, No. 3, pp. 390-396, 2005.
[10] D. Shirmohammadi, V. Filho, B. Gorenstin and M. V. P. Pereira, “Some Fundamental Technical Concepts about Cost Based Transmission Pricing”, IEEE Transactions on Power Systems, Vol. 11, No. 2, 1002-1008, 1996.
[11] A. R. Abhyankar, S. A. Soman and S. A. Khaparde, “Min-Ma Fairness Criterion for Transmission Fied Cost Allocation”, IEEE Transactions on Power Systems, Vol. 22, No.4, pp. 2094-2104, 2007.
[12] A. R. Abhyankar, S. A. Soman and S. A. Khaparde, “An Optimization Approach to Real Power Tracing: An Application to Transmission Field Cost Allocation”, IEEE Transactions on Power Systems, Vol. 21, No. 3, pp. 1350-1361, 2006.
[13] J. M. Zolezzi and H. Rudnick, “Transmission Cost Allocation by Cooperative Games and Coalition Formation”, IEEE Transactions on
Soofiabadi & Akbari Foroud: Modifying Nodal Pricing Method Considering Market Participants … 173 Power Systems, Vol. 17, No. 4, pp. 1008-1015,
2002.
[14] X. Tan and T. T. Lie, “Application of the Shapley value on transmission cost allocation in the competitive power market environment”, IEE Proceedings-Generation, Transmission and Distribution. Vol. 149, No. 1, pp. 15-20, 2002. [15] A. J. Conejo, J. Contreras, D. A. Lima and A.
Padilha-Feltrin, “Zbus Transmission Network Cost Allocation”, IEEE Transactions on Power Systems, Vol. 22, No. 1, pp. 342-349, 2007. [16] J. Pan, Y. Teklu, S. Rahman and K. Jun, “Review
of Usage-Based Transmission Cost Allocation Methods under Open Access”, IEEE Transactions on Power Systems, Vol. 15, No. 4, pp. 1218-1224, 2000.
[17] S. Chaitusaney and B. Eua-Arporn, “AC power flow sensitivities for transmission cost allocation”, IEEE Transmission and Distribution Conference and Exhibition 2002: Asia Pacific, IEEE/PES, Vol. 2, pp. 858-863, 2002.
[18] C. W. Yu, “Transmission Embedded Cost Allocation Using Sensitivity Analysis”, IEE Proc-Gener. Trans. & Distrib., Vol 149, No 5, pp. 627-632, 2002.
[19] G. Wacker and R. Billinton, “Customer cost of electric service interruptions”, Proceedings of the IEEE, Vol. 77, No. 6, pp. 919-930, 1989.
[20] R. Billinton, S. Kumar, N. Chowdhury, K. Chu, L. Goel, E. Khan, P. Kos, G. Nourbakhsh and J. Oteng-Adjei, “A reliability test system for educational purposes-basic results”, IEEE Transactions on Power Systems, Vol. 5, No. 1, pp. 319-325, 1990.
Alireza Soofiabadi was born in Rey, Tehran, Iran in 1989. He received B.Sc. degree and M.Sc. degree in electrical engineering faculty from Semnan University, Semnan, Iran. His research interests include power market and reliability in power system.
Asghar Akbari Foroud was born in Hamadan, Iran in 1972. He Received B.Sc. degree from Tehran University and M.Sc. and Ph.D. degrees From Tarbiat-Modares University, Tehran, Iran. His research interests include power system dynamics, operation and restructuring.