BIO-HEAT TRANSFER SIMULATION OF SQUARE AND
CIRCULAR ARRAY OF RETINAL LASER IRRADIATION
Arunn Narasimhan∗and Kaushal Kumar Jha
Heat Transfer and Thermal Power Laboratory, Department of Mechanical Engineering, Indian Institute of Technology Madras, Chennai - 600036, India
ABSTRACT
Pan Retinal photocoagulation (PRP), a retinal laser surgical process, is simulated using a three-dimensional bio-heat transfer numerical model. Spots of two different type of array, square array of3×3spots and a circular array of six spots surrounding a central spot, are sequentially irradiated. Pennes bio-heat transfer model is used as the governing equation. Finite volume method is applied to find the temperature distribution due to laser irradiation inside the human eye. Each spot is heated for100msand subsequently cooled for100mswith an initial laser power of0.2W. Based on the outcome of temperature distribution, the laser is pulsated in subsequent simulations to reduce the average peak temperature of spots to minimize the temperature induced cell damage. A method to reduce the laser power to attain the peak temperature towards photocoagulation temperature (60◦C) is also presented.
Keywords: Three-dimensional model, Bio-heat transfer, Laser surgery, Eye, Transient simulations, Retinopathy, Retinal heat transfer, Numerical simulations, Square array, Circular array, Sequential heating, Pulsation.
1. INTRODUCTION
The interaction of laser with biological tissues can cause photo-ablative, photo-thermal and photo-acoustic effects, which are used to treat a variety of diseases. The photo-thermal effects of laser on tissue is used in ophthalmology to treat retinopathy and macular degeneration maladies of the eye (Niemz, 1996; Sanghvi et al., 2008; Modiet al., 2009). Pan Retinal Photocoagulation (PRP) is an extensively used laser treatment for retinal diseases (Lindblom, 1992; Buckley et al., 1992; Lövestam-Adrian et al., 2003, 2004; Palanker et al., 2007; Sanghvi et al., 2008; Jixianet al., 2009; Modiet al., 2009). In conventional PRP, a single laser spot, of diameter ranging between 200 and 500µm is applied to the diseased retina for a duration of 50ms or more. The power of the laser varies between 50mW to 200mW, and 700 to 1500 spots on the retina are irradiated. Advances in medical laser technology have enabled multi-spot irradiation where the required number of spots can be irradiated in rapid succession with a pre-defined array shape (e.g. square array, circular array etc.), thus offering better control over spot size, power and inter-spot distances than possible in conventional PRP machines (Luttrullet al., 2005; Blumenkranzet al., 2006; Paysseet al., 2007; Palankeret al., 2007; Sanghviet al., 2008; Modiet al., 2009).
During laser surgery, the intense and collimated laser beam can locally heat the retinal spot to temperatures higher than that required to coagulate the diseased tissue. This can affect the adjoining healthy regions, resulting in unnecessary damage to the eye (Tillet al., 2003). On the other hand, inadequate irradiation may not instigate coagulation in the target area, thus rendering the treatment ineffective. Computer modeling and simulation studies can help understand the temperature evolution during laser irradiation and prescribe optimum parameters for
∗
Corresponding author. Email: [email protected]
safe and effective treatments.
An early model of heat transport in the human eye was presented by Cain and Welch (1974) using bio-heat transfer equation and corroborated with experiments conducted on the rabbit eye. Lagendijk (1982) used a computational grid that approximated the shape of the lens and other ocular structures to present models of human and rabbit eyes.
Frontiers in Heat and Mass Transfer (FHMT), 2, 033005 (2011) DOI: 10.5098/hmt.v2.3.3005
Global Digital Central ISSN: 2151-8629
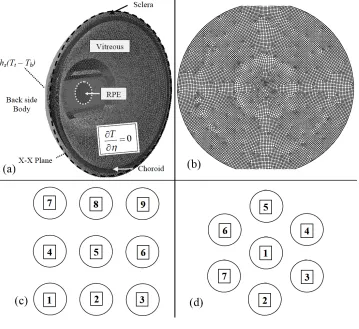
Fig. 1Three-dimensional schematic of the physiology of the human eye adapted and modified from wikipedia (2011)
during numerical simulation along a simple three-dimensional geometry of the eye, than earlier work by one of the authors Lagendijk (1982). Hirata (2007) performed steady state simulation on the effect of microwave radiation on human eye using an improved numerical model of the irradiated eye. Nget al. (Ng and Ooi, 2006; Ooiet al., 2007) reported steady state simulation of a two-dimensional model of the eye, which was followed by a three-dimensional model by Ng and Ooi (2007).
In the present study, multi-spot retinal laser surgery is numerically simulated using a truncated three-dimensional model of the human eye and flat-top laser beam. Two different arrays are studied: a square array of nine spots and circular array of seven spot. The spots are distributed uniformly within the array and irradiated sequentially. Finite volume formulation of Pennes bio-heat transfer (Pennes, 1948) is employed as the governing equation to simulate the transient temperature distribution. Transient simulations of pulsatile irradiation and reduced laser power are also performed for both arrays and shown to prevent thermal damage of the eye by overheating.
2. MATHEMATICAL FORMULATION AND BOUNDARY CONDITIONS
The energy equation in the eye domain must be solved with its boundary conditions in order to predict temperature distribution resulting from the laser irradiation. The Pennes bio-heat transfer equation (Pennes, 1948) can be written as
ρct∂Tt ∂t =λ(
∂2Tt
∂x2 +
∂2Tt
∂y2 +
∂2Tt
∂z2 ) +Q
000
+ ˙mblcbl(Tbl−Tt) (1)
When compared with the cross sections of the eye (24mm), the retinal and scleral region are very small (around or less than 1mm). In this, the RPE thickness is about 10µm. Since this is where most of the laser irradiation is absorbed, our reasoning is to treat this RPE region as a lumped system. Such a treatment will not affect overall temperature distribution in the other section of the eye during simulations for interpreting the results. The references for choosing RPE region properties are indicated in Table 1 - the data for which is collected from Boettner and Wolter (1962) and Chewet al.(2000). The resulting heat generation rates (Q000) are presented in Table 2. The metabolic heat generation rate is in the order of 103 W m−3, whereas the resulting volumetric heat generation rate in the RPE resulting from laser power applied in the present study (200mW) is in the order of1010W m−3.
Thus error due to neglecting of metabolic heat generation rate will be negligible. The last term in Eq. (1) is the blood perfusion term representing choroidal blood flow that cools the eye from the rear. The choroidal blood mass flow rate can be calculated as
˙
mbl=ω×Vc (2)
whereωis the blood perfusion rate andVcis the volume of the choroid in the interior of eyeball. Suitable values forωare taken from Flycktet al. (2006) and other literature.
The present three-dimensional model is truncated at cutting plane shown in Fig. 2. An adiabatic boundary condition is applied at cutting plane.
λ∂Tt
∂η = 0 (3)
During validation, the alternative of modeling the blood perfusion through the choroid is invoked. For enabling this, a convection type boundary condition is imposed at the sclera (see Fig. 2), written as
λ∂Tt
∂η =hs(Tt−Tb) (4)
The initial temperature is considered as 37◦ C, throughout the computational domain as only posterior half of eye is considered (Narasimhanet al., 2010).
3. EYE GEOMETRY AND PROPERTIES
Figure 1 shows the cross section of the eye. The diameter of the eye, along the pupillary axis is about24mm. The vertical diameter is about
23mm(L’Huillier and Apiou-Sbirlea, 2000). The posterior half of the human eyeball is almost spherical (Forresteret al., 2001). Each region is assumed to be homogeneous and the eye is assumed to be symmetrical about the pupillary axis.
For the present modeling, only the posterior section of eye comprising the vitreous humour, retinal pigmented epithelium (RPE), choroid and sclera is considered. The thickness of sclera varies from
0.6mmat the limbus to0.5mmat the equator and1mmat the exit of optic nerve. The retina varies in thickness from0.5mmto 0.1mm, being thick around the optical disk and thinning at the equator. The retina has ten layers; the inner nine layers are considered neural retina and the exterior layer comprises pigmented epithelium also known as RPE.
Table 1 Thermal properties of various part of the human eye taken from references (a) Boettner and Wolter (1962), (b) Emeryet al. (1975), (c) Neelakantaswamy and Ramakrishnan (1979), (d) Lagendijk (1982), (e) Scott (1988), (f) Chewet al.(2000), (g) Flycktet al.(2006).
Property λ c ρ γ
Medium (W m−1K−1) (J kg−1K−1) (kgm−3) (%)
Cornea 0.58 4178 1050 22
(b) (e) (c) (f)
Aqueous humour 0.58 3997 1000 5
(b) (e) (e) (a)
Lens 0.4 3000 1050 7
(d) (e) (c)
Vitreous humour 0.603 4178 1000 10
(e) (e) (e)
RPE 0.603 4178 1000 100
(e) (e) (e)
Sclera 0.603(e) 4178(e) 1000(e) 0
Fig. 2(a) Three-dimensional computational domain truncated at X-X section of Fig. 1 (b) grid structure at RPE plane (c) square array of3×3spots marked with sequence of heating(d) circular array with seven sequential heating spots
Table 2Heat generation in all zones.
Spot Diameter = 500µm Laser Power = 0.2W
Medium
γ Energy Volume Q000 Length
Absorbed (×10−12) (×106)
(%) (W) (m3) (W m−3) (mm)
Cornea 22 0.044 102.24 430.94 0.52
Aqueous humour 5 0.0078 589.05 13.24 3
Lens 7 0.0103 706.86 14.68 3.6
Vitreous humour 10 0.0138 3118.03 4.42 15.88
RPE 100 0.1240 1.96 63174.78 0.01
Sclera 0 0 194.39 0 0.99
RPE cells have specialized with multiple essential functions and serve as ‘nurse cells’ for the retina. RPE absorbs and delivers nutrients to the neurosensory retina and transports the metabolic end products to the choroid. RPE cells have elaborate mechanisms to remove toxic molecules and free radicals produced by light and thus contribute to a stable and safe retinal environment. The melanin pigment in the RPE protects the photoreceptors from short-wavelength light damage and shields scattered light from the sclera. Thickness of RPE varies from
6µmto15µm(Tillet al., 2003) and is assumed to be10µmin this study.
The eye’s cooling mechanisms are assumed to be located at the surface of eyeball. The choroid, present between the sclera and retina, facilitates blood flow at the back of the eye, and cools the rest of the eye. It is assumed that RPE absorb all the energy at the wavelength of argon laser.
The values for the required thermo-physical material properties for all occular regions mentioned in Fig. 1 were collected from literature as tabulated in Table 2.
An argon laser with powerQ = 0.2W irradiating a spot size of
500µmis selected for the numerical simulation. The percentage heat generation in different regions of the laser path are given in Table 1. The chosen spot size, laser power and the reported heat generation percentage were corroborated by several recent studies (spot size -(Chewet al., 2000; Luttrullet al., 2005; Blumenkranzet al., 2006), heat generation percentage - (Luttrullet al., 2005; Paysseet al., 2007), laser power - (Chew et al., 2000; Flyckt et al., 2006; Blumenkranz et al., 2006)).
4. NUMERICAL METHOD AND GRID INDEPENDENCE
Figure 2a shows the truncated three-dimensional geometrical model meshed with a computational grid and the boundary conditions employed. The3×3square array of spots is presented in Fig. 2b along with computational grid. Spots are labeled according to the order of irradiation during sequential treatment. During simultaneous irradiation, all the nine spots are irradiated simultaneously. D is the distance between centers of two consecutive spots for both square and circular array. The values ofDfor the present study lies between0.25mmand
0.75 mm, including these values. The laser path along the eye cross-section is separately modeled using a subroutine. This calculates the energy absorbed in each region of the eye based on the respective absorbtion coefficient and radiation properties provided in Tables 1 and 2
Frontiers in Heat and Mass Transfer (FHMT), 2, 033005 (2011) DOI: 10.5098/hmt.v2.3.3005
Global Digital Central ISSN: 2151-8629 model is obtained using Gambitr 2.3.16. Hexahedral finite volume
elements are used for meshing the RPE. The rest of the domain is meshed using tetrahedral finite volume element. Fluentr6.3.26, which employs the finite volume method, is used to solve the discretized equations. Double-precision coupled solver with second-order time implicit scheme is selected. A second-order upwind scheme is adopted for the energy equation. Convergence criterion for successive iteration is set as10−9.
Grid independence and time independence studies have been carried out for the three-dimensional domain with laser irradiation. Based on parameters such as error in temperature and energy balance, a grid with 3330489 cells and time step of 1mshas been selected for further simulation. During transient simulation of pulsatile laser, the time step is further decreased to 0.1 ms. Further details of grid independence and time independence studies and validation reported in Narasimhan and Jha (2010).
5. RESULTS AND DISCUSSION
Sequential multi-spot laser-irradiation of the human eye is simulated using a truncated three-dimensional model. The multi-spot setup mimics actual surgical treatment in which adjacent spots in the RPE layer are sequentially burned using laser. In the present simulation, two different arrangement of spots are studied, viz. a square array of3×3spots and a circular array of six spots surrounding a central spot. During laser surgery, each spot is heated for100to200ms, followed by a cooling period of100to200msbefore irradiation of the subsequent spot. In this transient simulation, each spot is irradiated for100msand cooled for 100 ms sequentially. The total duration of simulation is thus
1800msfor the square array and1400msfor the circular array. Five values of center-to-center inter-spot distance (D) are used in the simulation to factorin possible spot overlaps in actual surgery
-0.75 mm, 0.625 mm, 0.50 mm, 0.375 mm and 0.25 mm. D = 0.375mmand0.25mmcorrespond to the case of overlapping spots.
The target for laser induced coagulation is the retinal tissue. The thickness of the irradiated RPE layer is very small (10µm), and hence the temperature profiles on either side of the layer are identical. The following values are used for the simulation - body temperature :37◦C, heat transfer coefficient at the sclera : 65 W m−2K−1
, applied laser power : 0.2W and spot size: 500µmin diameter,D = 0.25, 0.375, 0.50, 0.625&0.75mm.
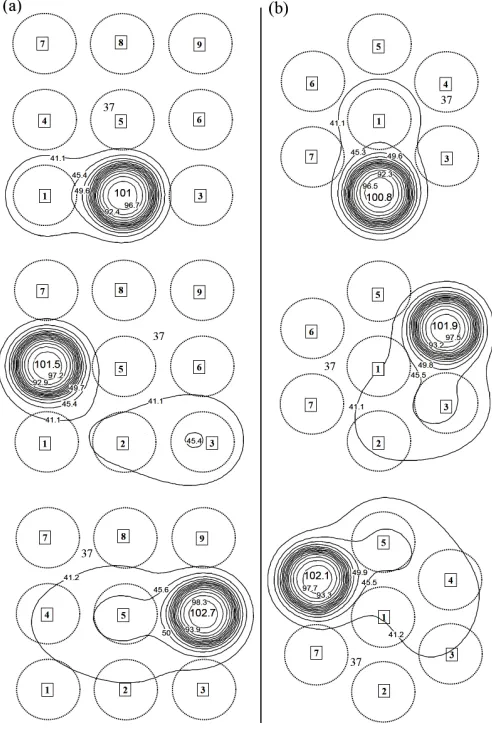
Fig. 3 show the isotherms for spots 2, 4 and 6 of square array (Fig. 3a) and circular array (Fig. 3b) at 300, 700 and 1100 ms heating respectively for a value ofD = 0.625mm. The temperature profile of the heat affected zone evolves with duration of irradiation. During the initial stages of laser heating, the isotherms of both arrays are similar. As heating progresses, distinct changes in the isotherms are seen, which can be attributed to two factors. (i) In the square array,heating commences at the outermost spot and proceeds along the rows, while in the circular array, heating starts at the central spot. (ii) As mentioned earlier, the effective center-to-center distance between the corner spots (spots 1, 3, 7 and 9) and central spot is√2Dcompared to the inter-spot distance of D between any other two adjacent spots in the array. In the circular array, on the other hand, all spots are placed equidistant (D) from the central spot and from neighbouring spots.
In Fig. 3, at the end of the100msheating of spot 2, the peak temperature attained by the spot is almost the same in both arrays. But by the time the fourth spot is heated, the peak temperature of spot 4 is higher for the circular array than the square. The situation is reversed at the end of heating cycle of spot 6. But the difference in peak temperatures is less than1◦Cbetween corresponding spots of the two arrays.
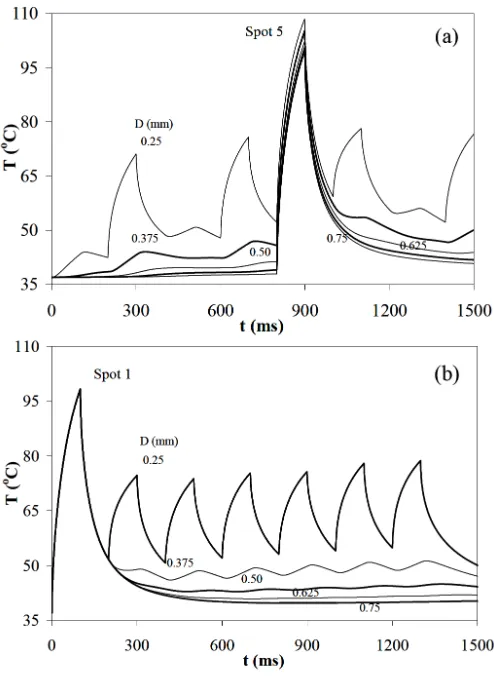
To ascertain the effect of sequence of irradiation, the history of peak temperature evolution of the central spot in both arrays are presented in Fig. 4a and b respectively for the values ofDconsidered.
Fig. 3Isotherms for laser heating ofQ= 0.2WwithD = 0.625mm for spot 2 (at300ms), spot 4 (at700ms) and spot 6 (at1100ms) (a) square array (b) circular array. All the temperatures are in◦C.
By virtue of being surrounded on all sides by other spots, the central spot has least diffusion space available in both cases. For the square array, as the value of Dincreases, peak temperature of central spot of square array decreases as seen in Fig. 4a. After a certain value ofD(say
0.625mm), there is negligible change in peak temperature of the central spot. For a smaller value of D, the remnant heat from neighbouring pre-irradiated spots (spots 1 to 4) diffuses to the central region and thus preheats the spot. The pre-irradiated neighbouring spots pose an unfavorable temperature gradient and thus suppress diffusional cooling. In the circular array (Fig. 4b), the central spot is irradiated first and therefore is not preheated by neighbouring spots.
As irradiation of other spots proceeds, the central spot in the circular array is at a higher temperature than its counterpart in the square array since spots on all sides of the central spot in the former are heated sequentially and there is diffusion of heat from the peripheral spots to the central spot. It is surmised that the spots with least diffusion space should be irradiated in the initial part of irradiation sequence. However, this keeps these spots at elevated temperatures longer.
Fig. 4Peak temperature history of central spots in square and circular array.
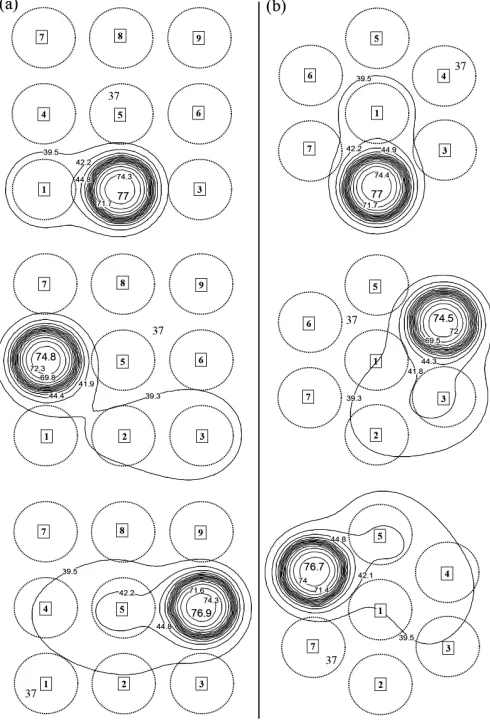
reaches103◦C (see Figs. 3, 4), a situation that has to be avoided to prevent irreversible damage to the eye. One feasible solution is to pulsate the irradiation, as proposed in Narasimhan et al. (2010), an approach that reduces the peak temperature of the domain. The isotherms for square array and circular array, under pulsatile irradiation are presented in Figs. 5a and b respectively. When compared to the isotherms where pulsation is absent, there is a small change in the minimum temperature of the spots. But the peak temperature reduces to about79◦Cfrom103◦C, for both arrays. Pulsation with a time period of5msfurther reduces the peak temperature to77◦Cas shown in Figs. 6a and b.
An alternate approach to reduce the peak temperature to photocoagulation temperatures, is to reduce the laser power. To maintain the temperature at around60◦C, accurate prediction of laser power is essential, as shown in Jha and Narasimhan (2010). The isotherms for the square and circular array, using reduced power setting of0.072W are presented in Figs. 7a and b. As with the pulsatile case, the isotherms of the reduced power irradiation are similar to full power (0.2W) settings in both arrays, but peak temperatures of the spots are maintained around
60◦Cwith minor deviations.
Peak temperature evolution of spots 1 and 7 of square and circular array for a value ofD = 0.625mmunder all the conditions discussed earlier, are presented in Fig. 8a and b respectively. During heating with full laser power of0.2W the peak temperature attained by spots 1&
7 of square array at100msand1300msare100.3◦Cand101.4◦C respectively. The peak temperature of corresponding spots of circular array attain100.5◦C& 102.8◦Crespectively. When laser is pulsated,
Fig. 5Comparison of isotherms evolution for three spots (spots 1, 4 & 7) withD = 0.625 mm at300 ms, 700 msand 1300ms respectively (a) square array of3×3spots (b) circular array with seven spots, where laser heating ofQ= 0.2Wuntil20msand subsequent pulsatile heating with a time period of10msfor rest of80msis done during corresponding laser irradiation of each spot of array.
the average peak temperature of spots of the both the array reduces to
70◦Cwith minor deviations at the end of each heating cycle of100ms. When laser power is reduced to0.072W, the peak temperature of spots are maintained around60◦Cat the end of heating cycle.
6. CONCLUSIONS
Sequential mode of laser surgical process is simulated using a truncated three-dimensional finite volume model of the human eye. Two different types of arrays - square array of nine uniformly distributed spots and a circular array of six uniformly distributed spots around a central spot -are used for simulation of multi-spot retinal laser surgery. The inter-spot distance are varied in between0.25mmand 0.75mmto identify the optimal distance of safe placements of spots of the arrays.
Frontiers in Heat and Mass Transfer (FHMT), 2, 033005 (2011) DOI: 10.5098/hmt.v2.3.3005
Global Digital Central ISSN: 2151-8629
Fig. 6Comparison of isotherms evolution for three spots (spots 1, 4 & 7) with D = 0.625mm at 300ms, 700msand 1300ms respectively (a) square array of3×3spots (b) circular array with seven spots, where laser heating ofQ= 0.2W until20msand subsequent pulsatile heating with a time period of5msfor rest of80msis done during corresponding laser irradiation of each spot of array.
spot distance in an array.
It is concluded that the sequence of irradiation of spots is critical in maintaining spot temperature at safe levels. The spot, which has least diffusion space should be irradiated first. Otherwise, it will be at elevated temperature for prolonged time due to adverse temperature gradient for cooling.
Pulsating laser irradiation with predefined time period of10 ms and 5mscan reduce the peak temperature to photocoagulation levels without causing excess heat-induced damage to surrounding tissue. As time period decreases, the peak temperature decreases. With a time period of10ms, the peak temperature of spots of both arrays approach
80◦C. A time period of5msreduces the peak temperature of spots to
77◦C, for a value ofD= 0.625mm.
Reduction of peak temperature can also be achieved by reducing the laser power. The peak temperature of spots of both square and circular array reaches to60◦C, with a power setting of0.072W. Such an approach can also minimize collateral thermal damage of healthy neighbouring ocular tissues.
Fig. 7 Comparison of isotherms evolution for three spots with D = 0.625mm (a) square array of3×3 spots (b) circular array with seven spots, with laser heating of reduced laser power of (Q= 0.072W)
NOMENCLATURE
c specific heat (J kg−1K−1
)
D center to center distance between two consecutive spots (mm)
E evaporation rate of tear (W m−2) h heat transfer coefficient (W m−2K−1
) Q heat power (W)
Q000 heat generation rate (W m−3
) t time (ms)
T temperature (◦C) Greek Symbols
α thermal diffusivity (m2/s) ε emissivity (non-dimensional) η unit outward normal (m) γ absorptivity (%)
λ thermal conductivity (W m−1K−1) ω perfusion rate (kgm−3s−1) ρ density (kgm−3
)
σ Stefan-Boltzmann constant (W m−2K−4) Subscripts
b body
Fig. 8Peak temperature evolution of spots 1 and 7 for [a] heating with full laser power of0.2W, [b] pulsatile heating with a time period of10ms, [c] pulsatile heating with a time period of5msand [d] heating with reduced laser power of0.072W
s sclera t tissue
REFERENCES
Amara, E.H., 1995, “Numerical investigations on thermal effects of laser-ocular media interaction,”International Journal of Heat and Mass Transfer,38(13), 2479–2488.
http://dx.doi.org/10.1016/0017-9310(94)00353-W
Blumenkranz, M.S., Yellachich, D., Andersen, D.E., Wiltberger, M.W., Mordaunt, D., Marcellino, G., and Palanker, D., 2006, “Semiautomated patterned scanning laser for retinal photocoagulation,”Retina-the journal of retinal and vitreous diseases,26, 370–376.
Boettner, E.A., and Wolter, J.R., 1962, “Transmission of the ocular media,”Investigative Ophthalmology and Visual Science,1, 776–783.
Buckley, S., Jenkins, L., and Benjamin, L., 1992, “Field loss after pan retinal photocoagulation with diode and argon lasers,” Documenta Ophthalmologica,82(4), 317–322.
http://dx.doi.org/10.1007/BF00161019
Cain, C.P., and Welch, A.J., 1974, “Measured and predicted laser-induced temperature rises in the rabbit fundus,”Investigative Ophthalmology and Visual Science,13, 60–70.
Chew, T.K.P., Wong, J.S., Chee, K.L.C., and Tock, P.C.E., 2000, “Corneal transmissibility of diode versus argon lasers and their photothermal effects on the cornea and iris,”Clinical and Experimental Ophthalmology,28, 53–57.
http://dx.doi.org/10.1046/j.1442-9071.2000.00271.x
Chua, K.J., Ho, J.C., Chou, S.K., and Islam, M.R., 2005, “On the study of the temperature distribution within a human eye subjected to a laser source,” International Communications in Heat and Mass Transfer,32, 1057–1065.
http://dx.doi.org/10.1016/j.icheatmasstransfer.2004.10.030
Cvetkovic, M., Poljak, D., and Peratta, A., 2008, “Thermal modelling of the human eye exposed to laser radiation,” 16th International Conference on Software, Telecommunications and Computer Networks, 2008. SoftCOM 2008., 16–20.
http://dx.doi.org/10.1109/SOFTCOM.2008.4669444
Emery, A.F., Kramar, P., Guy, A.W., and Lin, J.C., 1975, “Microwave induced temperature rises in rabbit eyes in cataract research,” ASME Journal of Heat Transfer,97, 123–128.
http://dx.doi.org/10.1115/1.3450259
Flyckt, V.M.M., Raaymakers, B.W., and Lagendijk, J.J.W., 2006, “Modelling the impact of blood flow on temperature distribution in the human eye and the orbit: fixed heat transfer coefficients versus the Pennes bioheat model versus discrete blood vessels,” Physics in Medicine and Biology,51, 5007–5021.
http://dx.doi.org/10.1088/0031-9155/51/19/018
Forrester, J.V., Dick, A.D., McMenamin, P., and Lee, W., 2001,The eye: Basic sciences in practice, Elsevier Health Sciences.
Hirata, A., 2007, “Improved Heat Transfer Modeling of the Eye for Electromagnetic Wave Exposures,” IEEE Transactions on Biomedical Engineering,54(5), 959–961.
http://dx.doi.org/10.1109/TBME.2007.893492
Jha, K.K., and Narasimhan, A., 2010, “Numerical simulations of heat transport in human eye undergoing laser surgery,” Proceedings of the
20th
National and 9th
International ISHMT-ASME Heat and Mass Transfer Conference, 10HMTC430, Mumbai, India.
Jixian, L., Yongbao, C., and Jiehui, X., 2009, “Laser treatment of diabetic retinopathy after cataract extraction combined with intraocular lens implantation,”Chinese Journal of Ophthalmology,11(1), 73–75.
Kandulla, J., Elsner, H., Birngruber, R., and Brinkmann, R., 2006, “Noninvasive optoacoustic online retinal temperature determination during continuous-wave laser irradiation,”Journal of Biomedical Optics,
11(4), 41111.
http://dx.doi.org/10.1117/1.2236301
Lagendijk, J.J.W., 1982, “A mathematical model to calculate temperature distribution in human and rabbit eye during hyperthermic treatment,” Physics in Medicine and Biology,27, 1301–1311.
http://dx.doi.org/10.1088/0031-9155/27/11/001
L’Huillier, J.P., and Apiou-Sbirlea, G., 2000,Computational modeling of ocular fluid dynamics and thermodynamics in Medical Applications of Computer Modeling: Cardiovascular and Ocular Systems, WIT Press.
Lindblom, B., 1992, “Effects of laser-induced retinal lesions on perimetric thresholds,”Documenta Ophthalmologica,79(3), 241–252.
Frontiers in Heat and Mass Transfer (FHMT), 2, 033005 (2011) DOI: 10.5098/hmt.v2.3.3005
Global Digital Central ISSN: 2151-8629 Luttrull, J.K., Musch, D.C., and Mainster, M.A., 2005, “Subthreshold
diode micropulse photocoagulation for the treatment of clinically significant diabetic macular oedema,”British Journal of Ophthalmology,
89, 74–80.
http://dx.doi.org/10.1136/bjo.2004.051540
Lövestam-Adrian, M., Agardh, C.D., Torffvit, O., and Agardh, E., 2003, “Type 1 diabetes patients with severe non-proliferative retinopathy may benefit from panretinal photocoagulation,” Acta Ophthalmologica Scandinavica,81(3), 221–225.
http://dx.doi.org/10.1034/j.1600-0420.2003.00050.x
Lövestam-Adrian, M., S, V., and V., P., 2004, “Macular function assessed with mfERG before and after panretinal photocoagulation in patients with proliferative diabetic retinopathy,”Documenta Ophthalmologica,109(2), 115–121.
http://dx.doi.org/10.1007/s10633-004-4862-y
Modi, D., Chiranand, P., and Akduman, L., 2009, “Efficacy of patterned scan laser in treatment of macular edema and retinal neovascularization,” Clinical Ophthalmology,3, 465–470.
http://dx.doi.org/10.2147/OPTH.S6486
Narasimhan, A., and Jha, K.K., 2010, “Transient Simulation of Multi-Spot Retinal Laser Irradiation Using a Bio-Heat Transfer Model,” Numerical Heat Transfer, Part A,57(7), 520–536.
http://dx.doi.org/10.1080/10407781003684514
Narasimhan, A., Jha, K.K., and Gopal, L., 2010, “Transient simulations of heat transfer in human eye undergoing laser surgery,” International Journal of Heat and Mass Transfer,53(1-3), 482–490.
http://dx.doi.org/10.1016/j.ijheatmasstransfer.2009.09.007
Neelakantaswamy, P.S., and Ramakrishnan, K.P., 1979, “Microwave-induced hazardous nonlinear thermoelastic vibrations of the ocular lens in the human eye,”Journal of Biomechanics,12(3), 205–210.
http://dx.doi.org/10.1016/0021-9290(79)90143-X
Ng, E.Y.K., and Ooi, E.H., 2006, “FEM simulation of the eye structure with bioheat analysis,”Computer Methods and Programs in Biomedicine,
82(3), 268–276.
http://dx.doi.org/10.1016/j.cmpb.2006.04.001
Ng, E.Y.K., and Ooi, E.H., 2007, “Ocular surface temperature: A 3D FEM prediction using bioheat equation,” Computers in Biology and Medicine,37(6), 829–835.
http://dx.doi.org/10.1016/j.compbiomed.2006.08.023
Niemz, M., 1996,Laser-Tissue Interactions, Springer, New York,.
Ooi, E.H., Ang, W.T., and Ng, E.Y.K., 2007, “Bioheat transfer in the human eye: A boundary element approach,”Engineering Analysis with Boundary Elements,31(6), 494–500.
http://dx.doi.org/10.1016/j.enganabound.2006.09.011
Palanker, D., Jain, A., Paulus, Y., Andersen, D., and Blumenkranz, M.S., 2007, “Patterned retinal coagulation with a scanning laser,”Proceedings of SPIE,6426.
http://dx.doi.org/10.1117/12.701708
Paysse, E.A., Hussein, M.A.W., Miller, A.M., McCreery, K.M.B., and Coats, D., 2007, “Pulsed mode versus near-continuous mode delivery of diode laser photocoagulation for high-risk retinopathy of prematurity,” Journal of the American Association for Pediatric Ophthalmology and Strabismus,11, 388–392.
http://dx.doi.org/10.1016/j.jaapos.2006.11.011
Pennes, H.H., 1948, “Analysis of tissue and arterial blood temperature in the resting human forearm,”Journal of Applied Physiology,1(2), 93–122.
Sandeau, J., Kandulla, J., Elsner, H., Brinkmann, R., Apiou-Sbirlea, G., and Birngruber, R., 2008, “Numerical modelling of conductive and convective heat transfers in retinal laser applications,” Journal of Biophotonics,1(1), 43–52.
http://dx.doi.org/10.1002/jbio.200710012
Sanghvi, C., McLauchlan, R., Delgado, C., Young, L., Charles, S.J., Marcellino, G., and Stanga, P.E., 2008, “Initial experience with the Pascal photocoagulator:a pilot study of 75 procedures,”British Journal of Ophthalmology,92, 1061–1064.
http://dx.doi.org/10.1136/bjo.2008.139568
Scott, J.A., 1988, “A Finite Element Model of Heat Transport in the Human Eye,”Physics in Medicine and Biology,33, 227–241.
http://dx.doi.org/10.1088/0031-9155/33/2/003
Thompson, C.R., Gerstman, B.S., Jacques, S.L., and Rogers, M.E., 1996, “Melanin granule model for laser-induced damage in the retina,”Bulletin of Mathematical Biology,58, 513–553.
http://dx.doi.org/10.1007/BF02460595
Till, S.J., Till, J., Milsom, P.K., and Rowlands, G., 2003, “A new model for laser-induced thermal damage in the retina,”Bulletin of Mathematical Biology,65, 731–746.
http://dx.doi.org/10.1016/S0092-8240(03)00028-4

![Fig. 8 Peak temperature evolution of spots 1 and 7 for [a] heating withfull laser power of 0.2 W, [b] pulsatile heating with a time periodof 10 ms, [c] pulsatile heating with a time period of 5 ms and [d]heating with reduced laser power of 0.072 W](https://thumb-us.123doks.com/thumbv2/123dok_us/8814151.1779355/7.612.42.291.58.379/temperature-evolution-heating-withfull-pulsatile-periodof-pulsatile-heating.webp)
