RCV1: A New Benchmark Collection
for Text Categorization Research
David D. Lewis [email protected]
Ornarose, Inc. and David D. Lewis Consulting 858 West Armitage Avenue, #296
Chicago, IL 60614, USA
Yiming Yang [email protected]
Language Technologies Institute & Computer Science Department Carnegie Mellon University
Newell Simon Hall 3612D, LTI 5000 Forbes Avenue
Pittsburgh, PA 15213, USA
Tony G. Rose [email protected]
Cancer Research UK
Advanced Computation Laboratory 44 Lincoln’s Inn Fields
London WC2A 3PX, UK
Fan Li [email protected]
Language Technologies Institute Carnegie Mellon University Newell Simon Hall 3612D, LTI 5000 Forbes Avenue
Pittsburgh, PA 15213, USA
Editor: Thomas G. Dietterich
Abstract
Reuters Corpus Volume I (RCV1) is an archive of over 800,000 manually categorized newswire stories recently made available by Reuters, Ltd. for research purposes. Use of this data for research on text categorization requires a detailed understanding of the real world constraints under which the data was produced. Drawing on interviews with Reuters personnel and access to Reuters doc-umentation, we describe the coding policy and quality control procedures used in producing the RCV1 data, the intended semantics of the hierarchical category taxonomies, and the corrections necessary to remove errorful data. We refer to the original data as RCV1-v1, and the corrected data as RCV1-v2. We benchmark several widely used supervised learning methods on RCV1-v2, illus-trating the collection’s properties, suggesting new directions for research, and providing baseline results for future studies. We make available detailed, per-category experimental results, as well as corrected versions of the category assignments and taxonomy structures, via online appendices.
Keywords: applications, automated indexing, controlled vocabulary indexing, effectiveness
1. Introduction
Text categorization is the automated assignment of natural language texts to predefined categories based on their content. It is a supporting technology in several information processing tasks, includ-ing controlled vocabulary indexinclud-ing, routinclud-ing and packaginclud-ing of news and other text streams, content filtering (spam, pornography, etc.), information security, help desk automation, and others. Closely related technology is applicable to other classification tasks on text, including classification with respect to personalized or emerging classes (alerting systems, topic detection and tracking), non-content based classes (author identification, language identification), and to mixtures of text with other data (multimedia and cross-media indexing, text mining).
Research interest in text categorization has been growing in machine learning, information re-trieval, computational linguistics, and other fields. This partly reflects the importance of text cat-egorization as an application area for machine learning, but also results from the availability of text categorization test collections (Lewis, Schapire, Callan, and Papka, 1996; Lewis, 1997; Yang, 1999; Sebastiani, 2002). These are collections of documents to which human indexers have as-signed categories from a predefined set. Test collections enable researchers to test ideas without hiring indexers, and (ideally) to objectively compare results with published studies.
Existing text categorization test collections suffer from one or more of the following weak-nesses: few documents, lack of the full document text, inconsistent or incomplete category assign-ments, peculiar textual properties, and/or limited availability. These difficulties are exacerbated by a lack of documentation on how the collections were produced and on the nature of their category systems. The problem has been particularly severe for researchers interested in hierarchical text categorization who, due to the lack of good collections and good documentation, have often been forced to impose their own hierarchies on categories (Koller and Sahami, 1997; Weigend, Wiener and Pedersen, 1999).
Even if current collections were perfect, however, there would be an ongoing need for new ones. Just as machine learning algorithms can overfit by tuning a classifier’s parameters to the accidental properties of a training set, a research community can overfit by refining algorithms that have already done well on the existing data sets. Only by periodically testing algorithms on new test collections can progress be verified.
A data set recently made available, Reuters Corpus Volume 1 (RCV1) (Rose, Stevenson and Whitehead, 2003), has the potential to address many of the above weaknesses. It consists of over 800,000 newswire stories that have been manually coded using three category sets. However, RCV1 as distributed is simply a collection of newswire stories, not a test collection. It includes known errors in category assignment, provides lists of category descriptions that are not consistent with the categories assigned to articles, and lacks essential documentation on the intended semantics of category assignment.
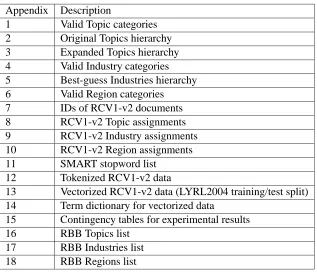
Appendix Description
1 Valid Topic categories 2 Original Topics hierarchy 3 Expanded Topics hierarchy 4 Valid Industry categories 5 Best-guess Industries hierarchy 6 Valid Region categories 7 IDs of RCV1-v2 documents 8 RCV1-v2 Topic assignments 9 RCV1-v2 Industry assignments 10 RCV1-v2 Region assignments 11 SMART stopword list
12 Tokenized RCV1-v2 data
13 Vectorized RCV1-v2 data (LYRL2004 training/test split) 14 Term dictionary for vectorized data
15 Contingency tables for experimental results 16 RBB Topics list
17 RBB Industries list 18 RBB Regions list
Table 1: List of online appendices accompanying this paper. They provide data sets used in or produced by the experiments, as well as additional information on the RCV1 collection, and are explained later in the paper.
Sections 2 to 4 are based on Reuters documentation, interviews with Reuters personnel, and sta-tistical analysis of the documents and categories. To complement this analysis, we provide bench-mark results on RCV1-v2 for well-known supervised learning approaches to text categorization. These results provide future users with a standard for comparison, as well as reassurance that the tasks posed by the corrected collection are neither trivial nor impossible. Section 5 gives the design of our experiments, Sections 6 & 7 discuss the algorithms and text representation, and Section 8 presents the benchmark results and observations. We end with some thoughts on research directions the new collection may support.
Several online appendices accompany this paper, and are listed in Table 1.
2. Coding the RCV1 Data
Apart from the terrible memories this stirs up for me personally (coding stories through the night etc.), I can’t find fault with your account.
– Reuters editor commenting on a draft of this section.
no formal specification remains of the coding practices at the time the RCV1 data was produced. However, by combining related documentation and interviews with Reuters personnel we believe we have largely reconstructed those aspects of coding relevant to text categorization research.
2.1 The Documents
Reuters is the largest international text and television news agency. Its editorial division produces some 11,000 stories a day in 23 languages. Stories are both distributed in real time and made available via online databases and other archival products.
RCV1 is drawn from one of those online databases. It was intended to consist of all and only English language stories produced by Reuters journalists between August 20, 1996, and August 19, 1997. The data is available on two CD-ROMs and has been formatted in XML.1Both the archiving process and later preparation of the XML dataset involved substantial verification and validation of the content, attempts to remove spurious or duplicated documents, normalization of dateline and byline formats, addition of copyright statements, and so on.
The stories cover the range of content typical of a large English language international newswire. They vary from a few hundred to several thousand words in length. Figure 1 shows an example story (with some simplification of the markup for brevity).
2.2 The Categories
To aid retrieval from database products such as Reuters Business Briefing (RBB), category codes from three sets (Topics, Industries, and Regions) were assigned to stories. The code sets were orig-inally designed to meet customer requirements for access to corporate/business information, with the main focus on company coding and associated topics. With the introduction of the RBB product the focus broadened to the end user in large corporations, banks, financial services, consultancy, marketing, advertising and PR firms.
2.2.1 TOPICCODES
Topic codes were assigned to capture the major subjects of a story. They were organized in four hi-erarchical groups: CCAT (Corporate/Industrial), ECAT (Economics), GCAT (Government/Social), and MCAT (Markets). This code set provides a good example of how controlled vocabulary schemes represent a particular perspective on a data set. The RCV1 articles span a broad range of content, but the code set only emphasizes distinctions relevant to Reuters’ customers. For instance, there are three different Topic codes for corporate ownership changes, but all of science and technology is a single category (GSCI).
2.2.2 INDUSTRYCODES
Industry codes were assigned based on types of businesses discussed in the story. They were grouped in 10 subhierarchies, such as I2 (METALS AND MINERALS) and I5 (CONSTRUCTION). The Industry codes make up the largest of the three code sets, supporting many fine distinctions.
<?xml version="1.0" encoding="iso-8859-1" ?>
<newsitem itemid="2330" id="root" date="1996-08-20" xml:lang="en"> <title>USA: Tylan stock jumps; weighs sale of company.</title> <headline>Tylan stock jumps; weighs sale of company.</headline> <dateline>SAN DIEGO</dateline>
<text>
<p>The stock of Tylan General Inc. jumped Tuesday after the maker of process-management equipment said it is exploring the sale of the company and added that it has already received some inquiries from potential buyers.</p>
<p>Tylan was up $2.50 to $12.75 in early trading on the Nasdaq market.</p> <p>The company said it has set up a committee of directors to oversee the sale and that Goldman, Sachs & Co. has been retained as its financial adviser.</p>
</text>
<copyright>(c) Reuters Limited 1996</copyright> <metadata>
<codes class="bip:countries:1.0"> <code code="USA"> </code> </codes>
<codes class="bip:industries:1.0"> <code code="I34420"> </code> </codes>
<codes class="bip:topics:1.0"> <code code="C15"> </code> <code code="C152"> </code> <code code="C18"> </code> <code code="C181"> </code> <code code="CCAT"> </code> </codes>
<dc element="dc.publisher" value="Reuters Holdings Plc"/> <dc element="dc.date.published" value="1996-08-20"/> <dc element="dc.source" value="Reuters"/>
<dc element="dc.creator.location" value="SAN DIEGO"/>
<dc element="dc.creator.location.country.name" value="USA"/> <dc element="dc.source" value="Reuters"/>
</metadata> </newsitem>
2.2.3 REGIONCODES
Region codes included both geographic locations and economic/political groupings. No hierarchical taxonomy was defined.
2.3 Coding Policy
Explicit policies on code assignment presumedly increase consistency and usefulness of coding, though coming up with precise policies is difficult (Lancaster, 1998, pp. 30-32). Reuters’ guidance for coding included two broad policies, among others. We have named these policies for conve-nience, though they were not so named by Reuters:
1. Minimum Code Policy: Each story was required to have at least one Topic code and one Region code.
2. Hierarchy Policy: Coding was to assign the most specific appropriate codes from the Topic and Industry sets, as well as (usually automatically) all ancestors of those codes. In contrast to some coding systems, there was no limit on the number of codes with the same parent that could be applied.
These policies were (imperfectly) implemented by a combination of manual and automated means during coding, as discussed below and in Section 3.3.
2.4 The Coding Process
During the years 1996 and 1997, the period from which the corpus is drawn, Reuters produced just over 800,000 English language news stories per year. Coding was a substantial undertaking. At one point Reuters employed 90 people to handle the coding of 5.5 million English language stories per year. However, this figure includes both English language stories produced by Reuters journalists and ones obtained from other sources, and included additional code sets not present in the RCV1 data. Therefore, the exact effort devoted to documents and codes of the sort represented in RCV1 is unclear, though one estimate is around 12 person-years (Rose, Stevenson and Whitehead, 2003).
Coding of Reuters-produced stories was accomplished in three stages: autocoding, manual edit-ing, and manual correction.
2.4.1 AUTOCODING
Stories first passed through a rule-based text categorization system known as TIS (Topic Identi-fication System), a descendant of the system originally developed for Reuters by Carnegie Group (Hayes and Weinstein, 1990). Most codes had at least one rule that could assign them, but automated coding was not attempted for some codes believed to be beyond the capability of the technology. Two of the codes perceived to be difficult were GODD (human interest) and GOBIT (obituaries). It is interesting to note that these two categories proved in our experiments to be two of the most difficult to assign automatically.
the final code GSPO. Other source processing rules triggered on other parts of the markup, for instance assigning any story whose slug (a brief line of identifying information on a newswire story) contained the string “BC-PRESS DIGEST” to the most general news code (GCAT).
Finally, as discussed in Section 3, some Topic, Industry, and Region codes were assigned on the basis of other codes of the same or different type, to enforce the Hierarchy Policy or capture other relationships.
2.4.2 MANUALEDITING
The output of TIS was automatically checked for compliance with the Minimum Code policy. If so, the story was sent to a holding queue. If not, the story was first sent to a human editor. This editor would assign the codes they felt applied, while ensuring the story got at least one Topic and one Region code. Editors could also delete or change automatically assigned codes. Editors occasionally fixed errors in the formatting of the story during this phase, but their primary responsibility was correction of coding. The edited story then went to the holding queue for final review.
2.4.3 MANUALCORRECTION IN THEHOLDINGQUEUE
Every six hours, the holding queue was reviewed by editors, who had the opportunity to correct mistakes in coding. Once stories passed through the holding queue, they were batched up and loaded into the database in blocks.
2.5 Coding Quality
Human coding is inevitably a subjective process. Studies have shown considerable variation in in-terindexer consistency rates for different data sets (Cleverdon, 1991). The process described above was an attempt to achieve high consistency and correctness for the Reuters codes. Stories were sam-pled periodically and feedback given to coders on how to improve their accuracy. The consistency of coders with each other and with standards was evaluated from samples and found to be high, though we were not able to obtain quantitative data from these evaluations for publication.
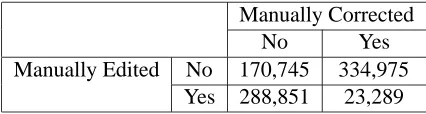
Table 2 provides some additional evidence of consistency of the coding. It shows, for the year 1997, how many stories had autocoding that failed the Minimum Code test and thus underwent manual editing, as well as how many had at least one code corrected in the holding queue. Note that RCV1 contains stories spanning parts of 1996 and 1997, so the number of stories in the corpus is not the same as the number of stories in Table 2.
A total of 312,140 stories had autocoding that failed the Minimum Code test and were thus manually edited. All of these stories were also reviewed by a second editor in the holding queue, but only 23,289 or 13.4% had codes changed by that second editor. In contrast, 334,975 (66.2%) of the 505,720 stories whose autocoding passed the Minimum Code test were changed in the holding queue. In other words, a manually edited coding was much less likely to be overridden in the holding queue than a coding assigned by the automated system.
Manually Corrected
No Yes
Manually Edited No 170,745 334,975 Yes 288,851 23,289
Table 2: Number of stories produced by Reuters in 1997 that received manual editing and/or manual correction.
2.6 The Evolution of Coding at Reuters
It should be mentioned that the above approach, based on TIS and manual correction, has since been superceded at Reuters. The rule-based approach of TIS had several drawbacks:
• Creating rules required specialized knowledge, thus slowing down the addition of new codes and the adaptation of rules to changes in the input.
• The rules did not provide an indication of the confidence in their output. There was thus no way to focus editorial correction on the most uncertain cases, nor any way of detecting (except by violation of coding policy) that new types of stories were appearing that would suggest changes or additions to the code set.
Reuters now uses a machine learning approach for text categorization. Classifiers are induced from large amounts of training data, with a feedback loop to trigger the involvement of human editors (based on autocoding confidence scores) and analysis tools to indicate when new training data/categories may be required.
3. RCV1 and Text Categorization Research
A test collection is more than a corpus. In this section we consider how the production and character of RCV1 impact its use for text categorization research. In Section 4 we go on to describe how to correct errors in the raw RCV1 data (which we call RCV1-v1) to produce a text categorization test collection (which we call RCV1-v2). Therefore here we present statistics for both versions of the data, indicating when they are different.
3.1 Documents
RCV1 contains 35 times as many documents (806,791 for RCV1-v1, and 804,414 for RCV1-v2) as the popular Reuters-21578 collection and its variants (Lewis, 1992, 1997), and 60 times as many with reliable coding. Indeed, the only widely available text categorization test collection of com-parable size is OHSUMED (Hersh, Buckley, Leone, and Hickman, 1994; Lewis, Schapire, Callan, and Papka, 1996; Yang and Pedersen, 1997; Yang, 1999) at 348,566 documents. While useful, OHSUMED has disadvantages: it does not contain the full text of documents, its medical language is hard for non-experts to understand, and its category hierarchy (MeSH) is huge and structurally complex.
There are gaps in the range of IDs in the original RCV1-v1, and additional gaps (due to deleted documents) in RCV1-v2. Regrettably, the ID order does not correspond to chronological order of the stories, even at the level of days. Fortunately, the documents do have time stamps (in the
<newsitem>element), and chronological order at the level of days can be determined from those. The time stamps do not give a time of day since the stories were taken from an archival database, not from the original stream sent out over the newswire.
XML formatting of both text and metadata in RCV1 simplifies use of the data. The fact that the stories are from an archival database means fewer brief alerts (the infamous “blah, blah, blah” stories of Reuters-21578), corrections to previous stories, and other oddities. RCV1 contains all or almost all stories of a particular type from an interval of one year. For temporal studies, this is a major advantage over Reuters-21578, which had bursty coverage of a fraction of a year.
The processes that produced the archival database and, later, the research corpus, were inevitably imperfect. Khmelev and Teahan (2003) discuss a number of anomalies in the corpus, including the presence of approximately 400 foreign language documents. They also emphasize the presence of duplicate and near-duplicate articles. Some of these simply reflect the fact that very similar stories do occasionally appear, particularly ones containing financial data. In other cases multiple drafts of the same story were retained. Some simple accidents undoubtedly occurred as well.
We found between 2,500 and 30,000 documents that could be considered duplicates of some other document, depending on the definition of duplication. Our analysis is consistent with that of Teahan and Kmelev, who found 27,754 duplicate or substantially overlapping documents in their analysis.
Whether the number of duplicates, foreign language documents, and other anomalies present in RCV1 is problematic depends on the questions a researcher is using RCV1 to study. We believe the number of such problems is sufficiently small, or sufficiently similar to levels seen in operational settings, that they can be ignored for most purposes.
3.2 Categories
RCV1 documents are categorized with respect to three controlled vocabularies: Topics, Industries, and Regions. In this section, we discuss the three RCV1 category sets and their implications for text categorization experiments. In particular, we describe our interpretation of the hierarchical structure for each code set, something that is not made clear in the documentation on the RCV1 CD-ROMs.
3.2.1 TOPICCODES
The file topic codes.txt on the RCV1 CD-ROMs lists 126 Topic codes. However, some of these codes were not actually used by editors at the time the RCV1 data was categorized. Various evi-dence, including Reuters documentation on an alternate version of the Topics hierarchy, suggests that these codes were not used:
1POL, 2ECO, 3SPO, 4GEN, 6INS, 7RSK, 8YDB, 9BNX, ADS10, BRP11, ENT12, PRB13, BNW14, G11, G111, G112, G113, G12, G13, G131, G14, GEDU, MEUR.
for GMIL (MILLENNIUM ISSUES), to 374,316 occurrences (381,327 in RCV1-v2) for CCAT (CORPORATE/INDUSTRIAL). Note that some Topic category frequencies are higher in RCV1-v2 than in RCV1-v1, despite RCV1-v1 having fewer documents, because RCV1-v2 fills in missing hierarchical expansions of Topic categories (Section 4).
The code symbols inserted in articles to indicate their membership in categories were chosen so that related categories would have related codes. This “morphological structure” of the codes reflects two distinct needs:
1. Defining a hierarchy to support automated assignment of more general codes on the basis of (manual or automated) assignment of more specific codes (Section 3.3).
2. Imposing an alphanumeric sort order that grouped related codes, aiding manual lookup.
For instance, the code C311 (DOMESTIC MARKETS) is a child in the hierarchy of its truncation, code C31 (MARKETS/MARKETING). Code C311 also appears near related codes, such as C32 (ADVERTISING/PROMOTION), in an alphanumeric listing.
The original hierarchy used for automated assignment can be reconstructed as follows:
1. Treat the codes CCAT, ECAT, GCAT, and MCAT as actually being the corresponding single letters C, E, G, and M.
2. To find the parent of a code, remove the minimal suffix such that the result is another code. The codes C, E, G, and M have as parent the root of the tree.
However, there are other versions of the hierarchy that might be of interest. In particular, one could introduce an additional level of the hierarchy corresponding to the high level numeric group-ings that aided lookup. This can be done by first adding to the hierarchy the artificial codes C1-C4, E1-E7, G1, and M1, and then following the above procedure. Taking into account this new hierarchy level might (or might not) improve the effectiveness of hierarchy-based algorithms when assigning the original 103 categories. (We doubt it is interesting to actually assign the 13 artificial codes to documents or to measure classifiers’ accuracy at assigning them.)
Online Appendix 2 specifies the original version of the hierarchy. It contains a total of 104 nodes: 103 for assignable Topic codes and 1 root node. Online Appendix 3 specifies a hierarchy that includes the two-character truncations as a new intermediate layer. It contains a total of 117 nodes: 103 for assignable Topic codes, 13 nodes in the new non-assignable intermediate layer, and 1 root node.
Editors were able to assign any of the 103 Topic codes to a story, not just codes at leaf nodes of the hierarchy. They were instructed to use the most specific code applicable to a particular aspect of a story, a common indexing principle (Lancaster, 1998, pp. 28-30). Codes at internal nodes of the hierarchy thus acted much like named “Other” categories, implicitly forming a contrast set with their child codes.
3.2.2 INDUSTRYCODES
The file industry codes.txt on the RCV1 CD-ROMs lists a total of 870 codes. Most do not appear in the documents and at first glance they appear confusing and redundant. As discussed below, only 354 of these codes appear to have been available for use by the coders. We therefore recommend that only these 354 codes (which we list in Online Appendix 4) be used in experiments.
Of the 354 valid Industry codes, 350 have at least one occurrence in the corpus (in both RCV1-v1 and RCV1-v2). Nonzero category frequencies range from two for I5020030 (RESERVOIR CON-STRUCTION) and I5020050 (SEA DEFENCE CONCON-STRUCTION) to 34,788 (34,775 in RCV1-v2) for I81402 (COMMERCIAL BANKING). In contrast to Topic and Region codes, Industry codes were not required to be assigned. Only a subset of documents (351,812 for RCV1-v1 and 351,761 for RCV1-v2) have them.
The Industry codes incorporate many fine-grained distinctions in subject matter. (For instance, there are five variations on the real estate industry.) They may therefore provide a test of the ability of text categorization systems to distinguish small differences in content.
As with Topics, the Industry code symbols encode both a hierarchy and a numeric sort order. The hierarchy was used for automated assignment of ancestor categories, though these automated assignments were imperfectly preserved in RCV1 (Section 3.5.2). In addition, some use of relation-ships between codes for companies (not present in the RCV1 CD-ROMs) and codes for Industries was used during automated assignment of Industries.
Several anomalies of the morphology of the Industry code symbols, and in the way the codes were used, make the relationships among codes hard to discern. We first discuss these anomalies, and then how to deal with them for experimental purposes.
Anomaly 1: The legacy editing interface used by coders required Industry code symbols to be either six or eight characters, regardless of hierarchy position. For instance, here is a subset of the codes in the form that editors apparently conceived of them (we indent the codes to indicate hierarchical structure):
I8 FINANCIAL AND BUSINESS SERVICES
I82 INSURANCE
I82001 COMPOSITE INSURANCE I82002 LIFE INSURANCE I82003 NON-LIFE INSURANCE
I8200316 MOTOR INSURANCE I8200318 REINSURANCE
However, the editing interface required that the codes be padded to six or eight characters with trailing digits. The trailing digits are usually (but not always) 0’s. Thus the above codes are present in industry codes.txt in this form:
I80000 FINANCIAL AND BUSINESS SERVICES I82000 INSURANCE
I82001 COMPOSITE INSURANCE I82002 LIFE INSURANCE I82003 NON-LIFE INSURANCE
The 6- or 8-character padded versions of the codes are the ones found in the RCV1 documents. We refer to these as “padded” codes, and the raw versions (which more directly encode the hierarchy) as “unpadded” codes.
Anomaly 2: The hierarchical expansion software apparently required a code list containing codes in both unpadded and padded forms, and the intermediate forms as well. So the file indus-try codes.txt actually contains:
I8 FINANCIAL AND BUSINESS SERVICES I80 FINANCIAL AND BUSINESS SERVICES I800 FINANCIAL AND BUSINESS SERVICES I8000 FINANCIAL AND BUSINESS SERVICES I80000 FINANCIAL AND BUSINESS SERVICES
I82 INSURANCE
I820 INSURANCE I8200 INSURANCE I82000 INSURANCE
I82001 COMPOSITE INSURANCE I82002 LIFE INSURANCE I82003 NON-LIFE INSURANCE
I8200316 MOTOR INSURANCE I8200318 REINSURANCE
Anomaly 3: There are nine 7-character codes (such as I815011) in industry codes.txt. Codes with seven characters were purely a navigational aid to editors in searching the code set. These 7-character codes were not assigned to documents either by editors or during hierarchical expansion.
Anomaly 4: There are nine codes labeled TEMPORARY, eight with 6 characters and one with five characters. There are also two codes labeled DUMMY CODE (I9999 and I99999). These ap-pear to be placeholders where new, meaningful codes (or navigational aids) might have been added but weren’t. These codes were not assigned to documents either by editors or during hierarchical expansion.
Anomaly 5: The top level of codes, I0 through I9 in unpadded form (I00000 through I90000 in padded form), were apparently not allowed to be assigned to documents.
Anomaly 6: The code I50000 was assigned to documents. It is a 6-character padding of un-padded code I500 (GENERAL CONSTRUCTION AND DEMOLITION), not a padding of disal-lowed unpadded code I5 (CONSTRUCTION).
Anomaly 7: There are six cases (excluding TEMPORARY and DUMMY codes) where two or more distinct 6- or 8-character padded codes have the same name in industry codes.txt. Each of these cases appears to have a different interpretation, as described next.
Anomaly 7a: The unpadded code I161 (ELECTRICITY PRODUCTION) has two padded forms, I16100 and I16101, listed in industry codes.txt. The code I16100 is assigned to many doc-uments, but I16101 to none. Other documentation suggests I16101 should not be considered an assignable code, and that the children of I16101 should instead be considered children of I16100.
Anomaly 7c: The padded codes I45500 (HOUSEHOLD TEXTILES) and I64700 (HOUSE-HOLD TEXTILES) are distinct codes with the same name. The I455 version is in the subhierarchy for I4 (PROCESSING INDUSTRIES), while I647 is in the subhierarchy for I6 (DISTRIBUTION, HOTELS AND CATERING). Both should be viewed as assignable, and both are in fact assigned to documents.
Anomaly 7d: The 6-character code I47521 (TRADE JOURNAL PUBLISHING) has a single child code, I4752105 (TRADE JOURNAL PUBLISHING). There are no occurrences of I47521 on the corpus, but several occurrences of I4752105. Other documentation also suggests that I4752105 is the unpadded version of the code, while I47521 was not available for use.
Anomaly 7e: The codes I64000 and I65000 have the name RETAIL DISTRIBUTION. At one point these apparently referred to “RETAIL - GENERAL” (I64000) and “RETAIL - SPECIAL-IST” (I65000). Later the two were merged, and it appears that for the RCV1 data they should be considered to be the same code. The code I64000 is assigned to documents, while I65000 is not, so the children of I65000 should instead be considered children of I64000, and I65000 ignored.
Anomaly 7f: Similarly to Anomaly 7a, the unpadded code I974 (TELEVISION AND RA-DIO) has two 6-character paddings: I97400 and I97411. The code I97400 is assigned to many documents, while I97411 is assigned to none. Other documentation also suggests I97411 was not available for use. I97411 should be considered unavailable, and its children should be considered children of I97400.
Anomaly 8: The padded code I16300 has the name “ALTERNATIVE ENERGY” which is slightly different than the name (“ALTERNATIVE ENERGY PRODUCTION”) for the apparent unpadded version of it (I163). Other documentation suggests there is not meant to be a distinction between these, so we rename I16300 to “ALTERNATIVE ENERGY PRODUCTION”.
Given these anomalies, we believe the set of Industry codes that were available to be assigned to documents are those from industry codes.txt that satisfy these criteria:
• Have six or eight characters (i.e., five or seven digits)
• Are not named DUMMY or TEMPORARY
• Are not of the form Ix0000, except for I50000
• Are not any of I16101, I47521, I65000, or I97411.
There are 354 such Industry codes, of which 350 appear in the corpus (both RCV1-v1 and RCV1-v2). The four available codes that do not appear in any document (I32753, I3302018, I841 padded to I84100, and I84802) are leaf nodes of the hierarchy. They have narrow enough meanings that there plausibly was no RCV1 document to which they were applicable. We provide a list of these 354 Industry codes as Online Appendix 4.
We also had to choose what kinds of codes to include in the hierarchy. We decided to omit TEMPORARY, DUMMY, and 7-character codes, as well as other codes that weren’t available to editors. The only exception to requiring that codes have been assignable was that we included the unassignable second level codes I0 through I9.
Online Appendix 5 contains our hierarchy. It has 365 nodes: one root, the 10 second level codes I0 through I9, and the 354 assignable codes. As part of the hierarchy file, we include the name of each node. We rename I22470 to OTHER NON FERROUS METALS, I45500 to HOUSEHOLD TEXTILES PROCESSING, and I64700 to HOUSEHOLD TEXTILES DISTRIBUTION, so that all valid codes have a unique name.
3.2.3 REGIONCODES
The file region codes.txt on the RCV1 CD-ROMs contains 366 geographic codes, of which 296 occur at least once in the corpus. The Reuters documentation we could obtain suggests that all 366 of these codes were available to Reuters editors, and so are appropriate to use in experiments. We provide a list of these 366 valid Region codes as Online Appendix 6. Nonzero class frequencies span the range from one (for 10 codes in RCV1-v1 and eight codes in RCV1-v2) to 266,239 (265,625 in RCV-v2) for USA.
In addition, three codes with a total of four occurrences are present in the RCV1 articles but not in the file region codes.txt, bringing the total number of Region codes actually present in RCV1-v1 articles to 299. These codes are CZ - CANAL ZONE (one occurrence), CZECH - CZECHOSLO-VAKIA (two occurrences), and GDR - EAST GERMANY (one occurrence). These codes appear to be errors, so in producing RCV1-v2 relevance judgment files we replaced them by what appear to be the corresponding correct codes from region codes.txt: PANA (PANAMA), CZREP (CZECH REPUBLIC), and GFR (GERMANY).
While no formal category hierarchy is provided with the RCV1 data, some Reuters personnel did view the Region codes as falling into three informal groups: Countries, Regional Groupings, and Economic Groupings. Other personnel viewed the latter two groups as not being clearly distinct. We did not find documentation defining the groupings, and so do not include a hierarchy or grouping of Region categories in our online appendices.
Hierarchies or networks of Region categories could be defined based on geographic, economic, political, or other criteria. Indeed, one Reuters informant has indicated that there was automatic assignment of some country codes based on company codes (not present in RCV1), and automated assignment of some regional or economic grouping codes (such as GSEVEN) based on country codes of member countries. We have not investigated this issue.
Whether assigning RCV1 Region codes is a good test of text categorization capability as op-posed to named entity recognition capability (Grishman and Sundheim, 1995), is debatable. It is clear, however, that assigning Region codes is not solely a named entity task. There are many sto-ries that mention the United States, for instance, that are not assigned to the USA code, and there are Region codes which are not named entities, such as WORLD and DEVGCO (DEVELOPING COUNTRIES).
3.2.4 RBB FILES
Appendices 16, 17, and 18, the RBB lists of Topics, Industries, and Region codes. RBB refers to the Reuters Business Briefing archival database offering (Section 2.2).
The RBB files present code sets that are related to the codes appearing in the RCV1 docu-ments, and to the codes specified in the CD-ROM files industry codes.txt, topic codes.txt, and re-gion codes.txt. None of the corresponding sets of codes is exactly identical to any of the others, however, and the time period during which any particular set of codes was in use is not clear. We have slightly edited the Topics and Industries RBB files to fix some inconsistencies in code names, and to add descriptions for two codes missing from the RBB data, to make the resulting files more consistent with the RCV1 data. (Note that the Industries files also contains the RBB descriptions for the intermediate non-code nodes I0 through I9.) We have not edited the Regions RBB file, since it has significant differences from the RCV1 data.
Despite these differences, the RBB files should prove a useful supplement to the CD-ROM files, particularly since the RBB files give more extensive descriptions of some categories.
3.3 Coding Policy
Coding policies specify certain requirements for how coding should be done, beyond an editors’ judgment of which codes capture the content of a particular text. As mentioned in Section 2.3, at least two coding policies, which we call the Hierarchy Policy and the Minimum Code Policy, were used by Reuters during the period the data in RCV1 was produced. We discuss here their implications for the use of RCV1 as a test categorization test collection.
3.3.1 IMPLICATIONS FORCORPUSPROPERTIES
The Hierarchy Policy required that when a Topic or Industry code was assigned to an article, all the codes which were ancestors of it in the Topic code hierarchy should be assigned as well. (The application of this policy in producing the data that became RCV1 was imperfect, as discussed in Section 3.5.) Adding ancestor codes creates some very high frequency codes (CCAT is assigned to 46% of the corpus), as well as strong, partially deterministic, dependencies between hierarchically related codes.
The Minimum Code Policy required that articles get at least one Region code and one Topic code. This policy probably did not greatly affect the codes assigned, since the code sets themselves were designed to cover the likely content of the newswire. However, unlike the Hierarchy Policy, the Minimum Code Policy did require human coders to change their behavior: in cases where they might otherwise decide that no code applies, they were forced to choose some assignment. From a statistical standpoint, the Minimum Coding Policy introduces a weak dependence among all codes in a set.
3.3.2 IMPLICATIONS FORALGORITHMDESIGN
If one knows that the correct categorization of a document obeys coding policies, it is natural to attempt to modify a text categorization algorithm so its output obeys those policies. Whether doing this will actually improve the effectiveness of a given system is, however, less clear.
How easy (and desirable) it is to implement the Minimum Code Policy varies with the text categorization method. For instance, a common strategy in text categorization is to create a sep-arate binary classifier for each category. This approach is likely to assign no categories to some documents, and so would sometimes violate the Minimum Code Policy.
3.3.3 IMPLICATIONS FOREVALUATION
When testing algorithms on a corpus produced using a particular coding policy, should one disallow outputs that violate that policy? This is often done when testing algorithms for multiclass (1-of-k) categorization: only algorithms that assign exactly one category for each test document are allowed. In an operational setting the data model, software interfaces, or other constraints might require strict adherence to coding policy.
On the other hand, if we view the system’s output as something which will be reviewed and corrected by a human editor, a more relaxed approach may be appropriate. Rather than forbidding outputs that violate coding policy, one can instead measure the effort that would be required to correct these policy violations, along with correcting any other errorful assignments.
One way to measure the effort that would be required to correct errors is simply to compute the usual microaveraged or macroaveraged effectiveness measures from binary contingency tables for the categories. This is the approach we adopt in reporting benchmark results in Section 8.
3.4 Was Each Document Manually Coded?
There are two somewhat conflicting worries that one might have about the RCV1 corpus. One is that a portion of the corpus might have been missed during coding, as was the case with Reuters-21578 (Lewis, 1997). Conversely, one might worry that the use of autocoding (Section 2.4.1) means that achieving good effectiveness on RCV1 is an exercise in rediscovering the (possibly simple and uninteresting) rules used by the automated categorizer.
We believe neither worry is justified. Reuters procedures assured that each story was coded automatically, and then had those codes checked by at least one, and sometimes two human editors. Further, a simple check of the raw RCV1-v1 corpus shows no documents that are totally lacking in codes, though some are missing one or another type of obligatory code (Section 3.5.2).
On the second question, we note that for each document a human editor always made the final decision on the codes to be assigned. Indeed, Table 2 shows that on average 79% of stories had at least one autocoding decision overruled. This argues that, despite the use of automated coding, RCV1 can be considered a manually categorized test collection.
We believe that the only code whose automated assignment was not checked in this process was GMIL, for millennium-related stories. This was automatically assigned, possibly without manual checking, sometime after the period the documents were originally archived. There may have been a very small number of other such codes, but we have not found evidence for this.
3.5 Coding Errors
3.5.1 DETECTINGCODINGERRORSUSINGDUPLICATEDOCUMENTS
One way to detect coding errors is to take advantage of documents which are duplicates of each other and so presumedly should have the same codes assigned. Using a substring-based measure, Khmelev and Teahan (2003) found a total of 27,754 identical or highly similar documents in RCV1-v1. They observed that 52.3% of such documents had the same set of Topics, 80.1% had the same set of Industries, and 86.8% had the same set of Regions. They suggest that the percentage of matching Topics is worrisomely low.
We have done a similar study which suggests less cause for concern. We identified the 14,347 documents in RCV1-v2 whose<headline>and<text>elements are identical to those of another document (ignoring variations in whitespace). We then computed classification effectiveness for each category based on treating all copies of a document as supplying fractional relevance judgments for that document. For instance, if there were three copies of a document, each would be evaluated against the other two, with each of the other two contributing a relevance judgment with weight 0.5. We computed the F1.0measure for each category that appeared at least once in the 14,347 duplicated documents, and took the macroaverage of these values. (See Section 5.3 for this measure.)
The resulting macroaveraged F1.0 values were 0.69 for Topics (with 102 out of 103 possible categories being observed in the duplicates), 0.57 for Industries (262 of 354 categories observed), and 0.74 for Regions (206 of 366 categories observed). These values are all higher than the best macroaveraged F1.0 values seen in our experiments (Section 8) on categories with at least one pos-itive test example (0.61 for Topics, 0.27 for Industries, and 0.47 for Regions). So even if duplicate documents gave an accurate measure of the limitations on interindexer agreement, we are not reach-ing this limit.
Further, we suspect that the duplicated documents have a higher proportion of errorful assign-ments than do nonduplicated docuassign-ments. A surprisingly high proportion of duplicated docuassign-ments have category assignments that are a superset of the assignments of one of their duplicates. This is most clear in cases where there were exactly two documents with the same <headline> and
<text>. There were 6,271 such pairs. Of these, 4,182 had some difference in their Topics assign-ments, and in 1,840 of these cases one set of assignments is a superset of the other. For Regions, 967 pairs have some difference, and 801 of these have a superset relationship. And for Industries, 1,500 pairs have some difference, and 1,328 of these have a superset relationship.
The proportion of superset relationships seems higher than would be expected for independent indexings of the documents, though a precise statistical model is hard to pose. One hypothesis is that the duplicate documents are present precisely because one editor was correcting an assign-ment produced by a previous editor (or by the automated coder). While there was an attempt to remove duplicated stories before archiving, this was not done perfectly, so both the corrected and uncorrected versions may have been archived. If this was the case, then the disagreement rate seen among duplicated stories will be much higher than for independent indexings of stories in general.
3.5.2 DETECTINGCODINGERRORS BY VIOLATIONS OFCODINGPOLICIES
21 have at least one child in the Topic hierarchy. Each of these 21 codes is missing from at least one document to which the Hierarchy Policy says it should have been assigned. A total of 25,402 occurrences of these 21 codes are missing in RCV1-v1.
With respect to Industry codes, application of the Hierarchy Policy was also imperfect:
• The immediate parent of an 8-character code was automatically added to the document in most cases, but these cases were missed:
– Some 8-character codes with one or more appearances in the corpus had (assuming we have inferred the hierarchy correctly) an immediate parent code that is not the 6-character truncation of the 8-6-character code. These 8-6-character codes are (with par-ent shown in parpar-entheses): I1610107 (I16100), I1610109 (I16100), I4752105 (I47520), I9741102 (I97400), I9741105 (I97400), I9741109 (I97400), I9741110 (I97400), and I9741112 (I97400). Three parents account for these cases (I16100, I47520, I97400) and they are assigned in only 7.1% to 46.6% of documents containing the child code, depending on the particular child category. This contrasts with essentially 100% assign-ment of parent codes which were 6-character truncations of 8-character codes.
– A single document containing two children of I01001 is missing I01001 itself. This appears to be a simple error. By contrast, all 12,782 other occurrences of children of I01001 are in documents that also contain I01001.
• No grandparents or higher level ancestors of 8-character codes appear to have been automati-cally added, nor any ancestors of 6-character codes. The few cases where both a code and one of these other ancestors are assigned to a document appear to result from a manual editorial decision to assign both.
These violations result from some combination of human error, glitches in the hierarchical ex-pansion software, and/or omissions of some codes from the archival data when producing RCV1. Some errors appear to have resulted from manual additions of codes after hierarchical expansion had already been run.
In Section 4 we propose an approach to correcting these errors, where possible, before using the corpus for experimental purposes.
3.5.3 ERRORFULCODES AND PLAUSIBLECODES
While Reuters did compute measures of consistency between indexers working independently, as well as traditional effectiveness measures for categorization software, these were not necessarily the most important measures for them. When evaluating vendors for eventual selection of a new automated categorization system (Section 2.6), Reuters used a measure based on the rate at which a human expert actively disagreed with the coding choice made for the document. The idea is that there are some codes that plausibly might be assigned or might not be assigned.
4. RCV1-v2: A New Text Categorization Test Collection
Since all evidence suggests that violations of the Hierarchy Policy and Minimum Coding Policy are simple errors, removing these violations where possible will produce more accurate results in any classification experiments made using RCV1. In this section we describe the procedures necessary to remove these errors. We call the resulting corrected text categorization test collection RCV1-v2 (for version 2), while referring to the uncorrected original version as RCV1-v1.
The following corrections convert RCV1-v1 to RCV1-v2:
1. Remove from the corpus the 13 documents that violate the Minimum Code Policy due to missing all Region codes, and the 2,364 documents that violate the policy due to missing all Topics. This leaves a total of 804,414 documents. Online Appendix 7 provides a list of the IDs of the 804,414 documents in RCV1-v2.
2. For each Topic code present in a document, add all missing ancestors of the code. This adds 25,402 Topic code assignments.
3. Replace the four errorful occurrences of Region codes, as described in Section 3.2.3.
We applied these corrections to the corpus before producing the results reported in Section 8. We decided not to try to correct violations of the Hierarchy Policy for Industry codes. One reason is that we are unsure of the exact Industry hierarchy at the time the RCV1 data was produced. In addition, it is not clear that the coding resulting from an expansion would actually be superior for research purposes. There are three classes of codes to consider:
• Leaf codes (i.e., all 8-character codes and some 6-character codes). Their assignments would not be affected under any hierarchical expansion scheme.
• Non-leaf 6-character codes with 8-character children. All but 4 of these 6-character codes are assigned in 100% of the cases one or more of their children are present. One (I01001) is missing from only one of the 12,783 documents that contain one or more of its children. The three remaining codes (I16100, I47520, and I97400) are assigned to a fraction of the documents to which their children are assigned. These are exactly the three codes where the unpadded code for the parent is not a truncation of the unpadded code for one or more of its child codes. We do not know if the assignments of these codes which are present in the corpus represent a partially successful automated assignment or, conversely, an intended omission of automated assignment in combination with manual decisions to assign the codes in certain cases. If we modified the corpus by assigning these codes when their children are present, it is unclear whether we would be respecting the intended semantics, or washing it out.
• Non-leaf 6-character codes that only have 6-character children. There seems to have been little or no assignment of these codes based on expansion of children. Occurrences of these codes appear to correspond to a manual judgment that this code is appropriate. Automated expansion would swamp these manual judgments with large numbers of expansion-based assignments (up to 100-fold more), producing an arguably less interesting classification task.
4.1 Availability of RCV1-v2 Data
Online Appendix 7 gives the complete list of RCV1-v2 document IDs. The complete sets of cor-rected RCV1-v2 category assignments are provided in Online Appendices 8, 9, and 10. In addition, two versions of the complete set of RCV1-v2 documents in vector form are provided as Online Appendices (see Section 7).
5. Benchmarking the Collection: Methods
An important part of the value of a machine learning data set is the availability of published bench-mark results. Among other things, good benchbench-mark results serve to ensure that apparently superior new methods are not being compared to artificially low baselines. We therefore ran three of the most popular supervised learning approaches on the RCV1-v2 data, both to provide such a benchmark, and as a check that our corrections to the data did not introduce any new anomalies.
5.1 Training/Test Split
We split the RCV1-v2 documents chronologically into a training set (articles published from August 20, 1996 to August 31, 1996; document IDs 2286 to 26150) and test set (September 1, 1996 to August 19, 1997; document IDs 26151 to 810596). The result is a split of the 804,414 RCV1-v2 documents into 23,149 training documents and 781,265 test documents. We call this the LYRL2004 split. (Notice that ID order does not always correspond to chronological order in either RCV1-v1 or RCV1-v2, so chronological splits in general should be based on the date tag in the<newsitem>
element, not on IDs.)
The chronological boundary we used is the same used in the TREC-10/2001 filtering track (Robertson and Soboroff, 2002). However the TREC-10/2001 filtering track used the raw RCV1 data (806,791 uncorrected RCV1-v1 documents split into 23,307 training documents and 783,484 test documents) and raw category labels, so the TREC results are not comparable with ours.
A chronological split, rather than a random one, is realistic since the majority of operational text categorization tasks require training on currently available material, and then applying the system to material that is received later. A chronological split also reduces the tendency of duplicate and near-duplicate documents to inflate measured effectiveness. The chronological breakpoint we chose has the advantage of giving almost all Topic categories two or more training examples, while still retaining most of a complete year as test data.
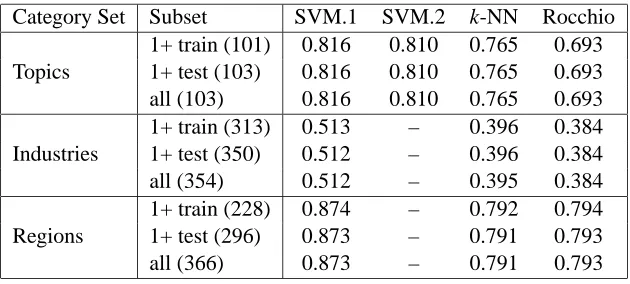
5.2 Categories
5.3 Effectiveness Measures
We measure the effectiveness of a text classifier on a single category with the Fβ measure (van Rijsbergen, 1972, 1979; Lewis, 1995):
Fβ= (β
2+1)A
(β2+1)A+B+β2C,
where A is the number of documents a system correctly assigns to the category (true positives), B is the number of documents a system incorrectly assigns to the category (false positives), and C is the number of documents that belong to the category but which the system does not assign to the category (false negatives). We report values forβ= 1.0, which corresponds to the harmonic mean of recall and precision:
F1.0= 2A 2A+B+C =
2RP R+P,
where R is recall, i.e., A/(A+C), and P is precision, i.e., A/(A+B).
The F-measure as presented above is undefined when A=B=C=0. The experiments reported here treat F1.0as equal to 0.0 in this case, though a strong argument could be made for a value of 1.0 instead, or possibly other values (Lewis, 1995).
To measure effectiveness across a set of categories we use both the macroaverage (unweighted mean of effectiveness across all categories) and the microaverage (effectiveness computed from the sum of per-category contingency tables) (Lewis, 1991; Tague, 1981).
6. Benchmarking the Collection: Training Algorithms
We benchmarked three supervised learning approaches that have been widely studied in text cat-egorization experiments: support vector machines (SVMs) (Joachims, 1998), weighted k-Nearest Neighbor (k-NN) (Yang and Liu, 1999), and Rocchio-style algorithms (Ittner, Lewis, and Ahn, 1995; Yang, Ault, Pierce, and Lattimer, 2000; Ault and Yang, 2002). We describe these core su-pervised learning algorithms below, as well as the susu-pervised threshold setting and feature selection procedures used with some of them.
6.1 SVM
SVM algorithms find a linear decision surface (hyperplane) with maximum margin between it and the positive and the negative training examples for a class (Joachims, 1998). SVMs using non-linear kernel functions are also possible, but have not shown a significant advantage in past text categorization studies, and are not investigated here.
SVMs have outperformed competing approaches in a number of recent text categorization stud-ies, but there has been some suggestion that they choose a poor decision threshold when the num-bers of positive and negative examples are very different, as they are for low frequency categories in random or systematic samples of documents (Zhang and Oles, 2001). We therefore used in our baselines two SVM variants that adjust for category frequency:
at default values. This meant, in particular, that we used a linear kernel (by leaving -t unspec-ified), equal weighting of all examples whether positive or negative (by leaving -j unspeci-fied), and set the tradeoff C between training error and margin to the reciprocal of the average Euclidean norm of training examples (by leaving -c unspecified). Since we were using cosine-normalized training examples, leaving -c unspecified meant C was set approximately to 1.0. SVM Light was used to produce scoring models, but the SVM Light thresholds were replaced with ones chosen by the SCutFBR.1 algorithm (Section 6.4).
• SVM.2: In this approach (Lewis, 2002), SVM Light, version 3.50, was run multiple times for each category, once for each of these settings of its -j parameter: 0.1, 0.2, 0.4, 0.6, 0.8, 0.9, 1.0, 1.25, 1.5, 2.0, 3.0, 4.0, 6.0, 8.0, 10.0, and 15.0. The -j parameter controls the relative weighting of positive to negative examples in choosing an SVM classifier, and thus provides a way to compensate for unbalanced classes. Leave-one-out cross-validation (LOO) (turned on by SVM Light’s -x 1 parameter) was used to compute a training set contingency table corresponding to each setting of -j. All other SVM Light parameters were left at their default values.
For each category, the F1.0 value for each setting of -j was computed from its LOO contin-gency table. The -j setting giving the highest LOO-estimated F1.0for a category was selected for that category. (In case of ties, the value of -j closest to 1.0 was used, with -j values less than 1.0 replaced by their reciprocals when computing closeness. If a value had been tied only with its reciprocal for best and closest, we planned to choose the value greater than 1.0, but this situation did not arise.)
As expected, the algorithm tended to choose values of -j that gave additional weight to positive examples. The value 0.8 was chosen once for -j, 1.0 was chosen five times, 1.25 was chosen eight times, 1.5 was chosen 11 times, 2.0 was chosen 27 times, 3.0 was chosen 27 times, 4.0 was chosen 17 times, 6.0 was chosen four times, and 8.0 was chosen once.
A final classifier was trained on all training data for the category using the chosen setting of -j. The threshold chosen by SVM Light based on the selected setting of -j was used as is for that category (SCutFBR.1 was not used). Due to its expense, SVM.2 was tried only for Topic categories.
SVM.2 was the top-ranked approach in the batch filtering and routing tasks in the TREC-10 evaluation (Robertson and Soboroff, 2002).
6.1.1 PARAMETERTUNING
The SVM.2 algorithm itself incorporated tuning of its only free parameter (-j) so no outside tuning was needed. Given the robustness of SVMs to high dimensional feature sets, no feature selection was used with either of the SVM algorithms.
6.2 k-NN
Weighted k-NN (k-nearest neighbor) classifiers have been consistently strong performers in text categorization evaluations (Yang, 1999; Yang and Liu, 1999). The variant we used here chooses, as neighbors of a test document, the k training documents that have the highest dot product with the test document. Then, for each category, the dot products of the neighbors belonging to that category are summed to produce the score of the category for the document. That is, the score of category cj with respect to test document~x (a vector of term weights) is
s(cj,~x) =
∑
~d∈Rk(~x)
cos(~x, ~d)I(~d,cj),
whered is a training document; R~ k(~x) is the set consisting of the k training documents nearest to
~x; and I(d~,cj) is indicator function whose value is 1.0 if d is a member of category c~ j, and 0.0 otherwise. Since~x andd were normalized to have Euclidean norm of 1.0, their dot product is equal~ to the cosine of the angle between them, so we write the dot product as cos(~x, ~d). The resulting score is then compared to the category threshold to determine whether or not to assign the category to the test document. Thresholds were chosen by SCutFBR.1 (Section 6.4).
The k-NN method is more sensitive to nonrelevant features than SVMs are, so the vectors used with it first had feature selection applied (Section 6.5).
6.2.1 PARAMETERTUNING
The k-NN algorithm had three free parameters, fbr, k (neighborhood size), and the feature set size. Five-fold cross-validation on the training set was used to select values for these parameters for each category set and effectiveness measure. The following values were tried:
• fbr : 0.1, 0.2, 0.3, 0.4, 0.5, 0.6, 0.7, 0.8
• k : 1, 3, 5, 10, 20, 40, 60, 80, 100, 130, 160, 200, 400, 600, 800
• Feature set size : 50, 100, 200, 400, 600, 800, 1000, 2000, 3000, 4000, 5000, 6000, 7000, 8000, 9000, 10000, 12000, 14000, 16000, 20000, 25000, 30000, 47152
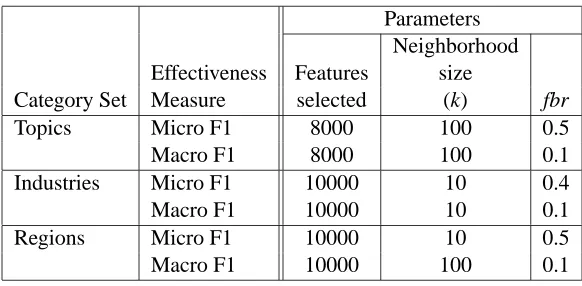
However, not all combinations of values were tried. Instead parameter values were first initial-ized to defaults: 0.3 for fbr, 50 for k, and the number of terms with nonzero values in the training set (47,152 terms) for feature set size. Then one parameter value at a time was optimized while holding the others fixed: first k (holding default fbr and feature set size fixed), then feature set size (holding the chosen k and default fbr fixed), and finally fbr (holding the chosen k and chosen feature set size fixed). Table 3 shows the k-NN parameter values chosen by this cross-validation process.
6.3 Rocchio-Style Prototype Classifier
Parameters Neighborhood Effectiveness Features size
Category Set Measure selected (k) fbr
Topics Micro F1 8000 100 0.5
Macro F1 8000 100 0.1
Industries Micro F1 10000 10 0.4
Macro F1 10000 10 0.1
Regions Micro F1 10000 10 0.5
Macro F1 10000 100 0.1
Table 3: Parameters chosen by cross-validation for our weighted k-NN algorithm, for each of the six combinations of category set and averaged effectiveness measure.
vector for each category as a weighted average of positive and negative training examples (Ittner, Lewis, and Ahn, 1995).
Our Rocchio prototype for category cjwas
~pj(γ) = 1
|
D
(cj)|~∑
di∈D(cj)
~
di−γ 1
|
D
n(¯cj)|~∑
di∈D(c¯j)
~
di,
wheredi~ is a training document;
D
(cj)andD
(¯cj)are, respectively, the set of positive and negative training examples for category cj; andγis the weight of the negative centroid.Many enhancements have been proposed to the original Rocchio algorithm (Schapire, Singer and Singhal, 1998; Ault and Yang, 2002). We used only the following ones:
1. As with k-NN, we do an initial feature selection for each category set and averaged effective-ness measure, using theχ2 max criterion (Section 6.5).
2. We then do a further feature selection on a per-category basis by zeroing out all but the pmax largest nonzero coefficients in the Rocchio vector. This keeps all positive coefficients before any negative ones. It is uncommon, but possible, for negative coefficients to remain in the Rocchio vector after this procedure.
3. The Rocchio algorithm produces a scoring model only. We choose a threshold for this model using the SCutFBR.1 algorithm (Section 6.4).
6.3.1 PARAMETERTUNING
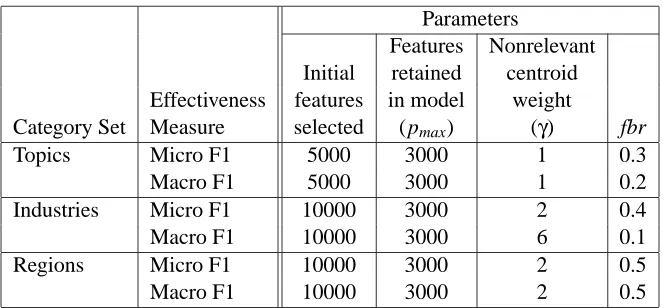
Parameters
Features Nonrelevant Initial retained centroid Effectiveness features in model weight
Category Set Measure selected (pmax) (γ) fbr
Topics Micro F1 5000 3000 1 0.3
Macro F1 5000 3000 1 0.2
Industries Micro F1 10000 3000 2 0.4
Macro F1 10000 3000 6 0.1
Regions Micro F1 10000 3000 2 0.5
Macro F1 10000 3000 2 0.5
Table 4: Parameters chosen by cross-validation for our modified Rocchio algorithm, for each of the six combinations of category set and averaged effectiveness measure. The value of pmax was chosen in an initial run on Topics, and then used for all combinations.
• fbr : 0.1, 0.2, 0.3, 0.4, 0.5, 0.6, 0.7, 0.8
• γ: 50, 20, 15, 10, 8, 6, 4, 3, 2, 1, 0, -1, -2
• Feature set size : 50, 100, 200, 400, 600, 800, 1000, 2000, 3000, 4000, 5000, 6000, 7000, 8000, 9000, 10000, 12000, 14000, 16000, 20000, 25000, 30000, 47152
As with k-NN, we first initialized the three parameters to default values (0.3 for fbr, 1 forγ, and 47,152 for feature set size), and then optimized one parameter at a time: firstγ, then feature set size, and finally fbr. The selected parameter values are shown in Table 4.
6.4 Supervised Threshold Setting
Each of our algorithms produces, for each category, a model that assigns scores to documents. To use these models for classification, we use the SCut strategy (Yang, 2001), i.e., simply associating a threshold value with each category, and assigning the category to a document when the score for that category exceeds the threshold. Other category assignment strategies (Yang, 2001) besides SCut were evaluated on the training data, but Scut was consistently superior so only it was used to produce classifiers evaluated on the test data.
The SVM.2 algorithm incorporates its own method for choosing a threshold to be used in the SCut approach. The other core training algorithms (SVM.1, k-NN, and Rocchio) were used to train scoring models. Thresholds for those scoring models were found by wrapping the core training algorithm within Yang’s SCutFBR.1 algorithm (Yang, 2001). The .1 refers to the rank of the val-idation document whose score becomes the threshold if the cross-validated threshold gives poor estimated effectiveness (see below). The core SCutFBR algorithm can be used with other fallback ranks as well (Yang, 2001).
an F1.0value less than a specified minimum value fbr, then that threshold was replaced by the score of the top-ranked validation document. The final threshold for the category is the average of the thresholds across the five folds.
6.5 Supervised Feature Selection
Our text representation approach produced a set of 47,236 features (stemmed words), of which 47,152 occurred in one or more training set documents and so potentially could be included in clas-sifiers (Section 7). Two of the algorithms studied, k-NN and Rocchio, are known to be significantly hampered by irrelevant features. Feature selection based on labeled data was used with these two algorithms. A separate feature set was chosen for each combination of algorithm (k-NN or Roc-chio), category set (Topics, Industries, or Regions), and effectiveness measure (microaveraged F1.0 or macroaveraged F1.0).
The feature set for a combination was chosen by first ranking the 47,152 features by their χ2 max score (Yang and Pedersen, 1997; Rogati and Yang, 2002) with respect to the category set. To compute this score, we first separately compute theχ2statistic (Altman, 1991, Section 10.7) for the feature with respect to each category in the category set:
χ2= n(ad−bc)
(a+b)(a+c)(b+d)(c+d),
where n is the total number of examples used in calculating the statistic, a is the number of examples with both the feature and the category, b is the number of examples with the feature and not the category, c is the number of examples with the category and not the feature, and d is the number of examples with neither the feature nor the category.
The feature’s χ2 max score is the maximum value of the χ2 statistic across all categories in the category set. Note that the use of χ2 max feature selection means that training data from all categories in a category set influences the set of features used with each individual category in the set.
The χ2 max score produces a ranking of all features from best to worst. To choose a feature set, we then had to choose a size for the feature set to know how far down that ranking to go. This was done by evaluating each of 23 corresponding feature sets using five-fold cross-validation on the training data, and picking the best (Sections 6.2.1 and 6.3.1).
7. Benchmarking the Collection: Text Representation
The same sets of training and test document feature vectors were provided to each algorithm. The feature vector for a document was produced from the concatenation of text in the<headline>and
<text> XML elements. It is important to note that the <title> element of RCV1 documents contains a “country code” string that was semi-automatically inserted, possibly based on the Re-gion codes. The<title>element should therefore not be used in experiments predicting category membership. (The<headline>element was added by Reuters during the production of the RCV1 corpus. It contains the same text as the<title>element, but strips out the country code.)