Published online August 19, 2014 (http://www.sciencepublishinggroup.com/j/sjbm) doi: 10.11648/j.sjbm.s.2015030102.11
ISSN: 2331-0626 (Print); ISSN: 2331-0634 (Online)
Developing a new management model for the built
environment: The built environment management model
BEM2 and BEM3
Thomas Madritsch
1, Matthias Ebinger
21
University of Applied Sciences FH KufsteinTirol, AUSTRIA; Real Estate & Facility Management Research Institute 2
Pratt Institute, New York City, USA; New York Presbyterian Hospital
Email address:
[email protected] (T. Madritsch)
To cite this article:
Thomas Madritsch, Matthias Ebinger. Developing a New Management Model for the Built Environment: The Built Environment Management Model BEM2 and BEM3. Science Journal of Business and Management. Special Issue: Business Analytics and Management. Vol. 3, No. 1-2, 2015, pp. 1-9. doi: 10.11648/j.sjbm.s.2015030102.11
Abstract:
The Real Property Portfolio has significant financial and operational impact in most organizations. Yet in many organizations there is a gap and disconnect between the various build environment functions. Currently, there is no easily accessible assessment tool available to stu dy the efficiency of Facility Management processes and to compare maturity benchmarks. The aim of the project was to develop an “industry independent” framework that can effectively classify and compare existing FM/RE practices within and across industry boundaries. Researcher investigated and evaluated current FM/RE management models and analysis tools and developed an assessment tool to measure Facility Management capability of an organization. The “Built Environment Management Model” (BEM2) is a process framework for FM/RE, which is extended into the “Built Environment Management Maturity Model” (BEM3) to measure FM/RE maturity. Using the tool, the research team analyzed the FM capability of more than 50 organizations with major real estate portfolios in the US and Europe. The resulting capability profiles provide an overview of current practices in Facilities Management. The profiles also allow organizations to develop “winnable” improvement initiatives to increase the strategic value of the FM function.Keywords:
Built Environment, Facility Management, Capability Profiles, Performance Measurement
1. Introduction
In a highly competitive and fast changing environment, organizations must increasingly assess the impact of real estate ownership to the organizational bottom line (Hinks, 2004; OGP 2005). Facility and Real Estate Management (FM/RE) activities contribute to about 5-10% of the gross domestic product (GDP) of advanced industrialized countries. The total value of FM activity, including support services, is about 8.2% of the UK GDP (Harris, 2002). According to a survey of Berger (2001), 70% of US companies and 50% of European companies consider their real property to be a strategic resource. Overall life cycle costs are 5-7 times higher than the investment costs of buildings (Grabatin, 2001).
Companies need a holistic view of their real estate in order to optimize the real estate strategy in combination with the company's strategy. This requirement can only be
fulfilled, if a high degree of transparency of the data and processes is available in the appropriate quality, in real-time and in the correct format at any time (Madritsch, 2008). Comprehensive assessment tools to visualize and benchmark the added value of FM performance are emerging, but are still fragmented and limited. Facilities management and real estate associations, as well as academicians have published and continue to work on models and definitions that could fill this gap. The International Facilities Management Organization provides a knowledge-based FM framework that is organized around eleven core competencies (IFMA 2010) and publishes comprehensive benchmarking surveys.
The Institute of Asset Management (2008) organizes relevant knowledge in its recently published “Competency
Framework”. The Association of Physical Plant
core competencies and manages a comprehensive database of comparative performance metrics (APPA, 2010). The National Research Council proposes a comprehensive,
multidimensional “Framework for Facilities Asset
Management” (NRC 2004). Multiple other professional organizations, such as BIFM, EuroFM, FMA, IREM, CoreNet or ASHE, to name just a few, produce often extensive FM/RE knowledge, in most cases as direct responses to the specific business needs of their members (Then 2004). The academic world also has made important contributions to the discussion of how to leverage the FM function as a strategic resource. Chotipanich and Nutt developed an inventory of FM functions and assessed how to best position these functions within an organizational context to generate strategic value (Chotipanich, 2004; Chotipanich and Nutt, 2008). Then (1999, 2004) proposes a set of integration models and process sequences to facilitate the alignment of facilities demand and supply. Becker (2003) borrows the concept of portfolio management to develop an FM model that can effectively respond to fast changing corporate environments. Dettbarn et. al. (2005) introduces the concept of Key Process Areas and Process Maturity, borrowed from Capability Maturity Models, to define a model that “integrates the strategic, operational, and tactical aspects of managing … real property portfolios”.
The aim of the project was to develop an “industry independent” framework, that can effectively classify and compare existing FM/RE practices within and across different industries. They should allow organizations to benchmark their FM capability against peer groups and industry leaders. The findings should help to further professionalize Facility Management functions to raise the efficiency of organizational processes.
2. State of the Art in Facilities and Real
Estate Management
To help organizations understand the strategic value of its real property, Facilities and Real Estate Management communities have produced a rich body of knowledge. The International Facilities Management Organization provides a knowledge-based FM framework that is organized around core competencies (IFMA 2010). The new European FM standard contains a set of definitions focusing on service delivery, quality management, process development and space and cost standardization (EN15221, 2006-2009). The Institute of Asset Management (2008) organizes subject knowledge in its recently published Asset Management Standard and Competency Framework. Multiple other professional organizations, such as BIFM, EuroFM, FMA, IREM, BOMI, CoreNet, APPA or ASHE, to name just a few, produce often extensive FM knowledge, in most cases as responses to the specific business needs of their constituents (Then 2004). The academic world also has made important contributions to the discussion of how to
leverage the FM function as a strategic resource. Chotipanich and Nutt developed an inventory of FM functions and assessed how to best position these functions within an organizational context to generate strategic value (Chotipanich, 2004; Chotipanich and Nutt, 2008). Then (1999, 2004) proposes a set of integration models and process sequences to facilitate the alignment of facilities demand and supply. Becker (2003) borrows the concept of portfolio management to develop an FM model that can
effectively respond to fast changing corporate
environments. Dettbarn et. al. (2005) introduces the concept of Key Process Areas and Process Maturity, borrowed from Capability Maturity Models, to define a model that “integrates the strategic, operational, and tactical aspects of managing … real property portfolios”.
3. The Need of an Built Environment
Management Model
The need for a strong conceptual framework in Facilities and Real Estate Management has been raised previously in the FM literature. Then (1999) highlighted the “need for strategic business planning to incorporate and, indeed, integrate the facilities dimensions of business delivery”. The US Government identified the management of its real property as a “high risk area”, and established a framework to “overhaul real property business practices” (Teicholz et. al. 2005). Dettbarn (2005) identified the need to integrate “the strategic, operational, and tactical aspects of managing … real property portfolios” to increase the performance of the real property function in supporting the organization’s mission. Shoet (2006) describes a “need … for the development of methods for the strategic management and maintenance of buildings”. In addition, the emergence of integrated data models for the Built Environment, Building Information Modeling (BIM), requires that the responsibilities and processing of facilities data are clearly defined (Wirdzek 2010).
Despite the growing body of work, attempts to categorize FM/RE business functions and their strategic value remain fragmented between different constituencies. Numerous labels such as “Asset Management”, “Real Estate”, “Property Management”, “Corporate Real Estate” or “Facilities Management” separate the field into communities with marginally varying business focuses. These labels conceal the fact that all of these communities have a broad range of common questions:
• Does the portfolio of facilities and infrastructure
adequately support the organization’s vision and mission?
• Does the organization have the right mix of facility
assets?
• Is the organization able to obtain or build facility
assets effectively?
• Does the organization have appropriate facility
• Are facilities and infrastructure components adequately maintained?
• Do the facilities comply with regulatory standards?
4. Methodology and Design of the
Survey
The “Built Environment Management” research group, consisting of two graduate programs and of multiple FM practitioners in the US and Europe, decided to develop an “industry neutral” framework, that would reflect general practices in Facilities Management and Real Estate in neutral terms and that could in a subsequent step be used to benchmark and catalogue best practices. The research team studied management models from two management
disciplines similar to FM/RE: Portfolio, Project and Project Management (PPPM) and Information Technology (IT). Both disciplines have well established and widely recognized management models, such as the Organizational Project Management Maturity Model (OPM3), the “Information Technology Information Libraries (ITIL)” or various “Portfolio, Program and Project Management” methodologies. (PMI, 2003, 2008; OGC, 2005, 2006, 2010). Especially the quality paradigm established by the Carnegie Mellon University Capability Maturity Model (CMM), which defines a network of business processes (key process areas) to describe business functions, was found to be useful as a starting point to develop a comprehensive framework for FM/RE (CMMI 2006).
Document Business Process Document Business Process Measure Business Performance Measure Business Performance Optimize Business Performance Optimize Business Performance
Maturity Level 2: Repeatable Processes
Experienced Personnel operates without Standard Operating Procedures (SPOs).
Maturity Level 3: Defined/Documented Processes
An optimized process flow was designed and documented in SPOs
Maturity Level 4: Measured Processes
Key Performance Indicators (KPIs) are measured using business automation.
Maturity Level 5: Self-optimizing Processes
Qualified Personnel improving own performance using KPIs
Develop Business Process
Develop Business Process
Maturity Level 1: Ad-hoc Processes
Managed Chaos
Starting Point
Starting Point
Fig. 1. Adoption of the maturity levels of the CMM Model
Over a multi-year period, and using the reorganization of a large FM/RE organization as a case study (Reuter, F., Ebinger, M., 2009), the team developed a process model and incrementally improved it in several iterations. Each iteration consisted of semi-structured interviews, in which the updated process model was presented to FM/RE
practitioners and consultants and reviewed for
completeness and relevance. In addition to the process framework, the team identified maturity levels for each process area, similar to the approach used by the CMM.
5. The Built Environment Management
Model (BEM2)
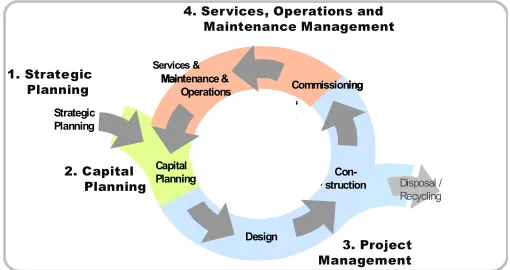
Researchers used the life cycle of a facility asset as the
primary organizing principle for the process model. This cradle-to-grave sequence ensures that most, if not all, aspects relative to the built environment are considered in the framework. The life cycle was organized into distinct Key Process Areas (KPAs). Each KPA consists of a set of specific processes that are owned by organizational entities, whose performance and maturity can be measured and benchmarked. To show the “value stream” of each function, each process within a KPA is anchored on vertical layers highlighting three vertical perspectives: Strategic, Tactical and Operational. Borrowing from classifications proposed by Then (1999, 2004) and Dettbarn et. al. (2005), BEM2 breaks the Facilities Life Cycle into four Key Process Areas (KPAs). Maintenance & Operations Design Commissioning Capital
Planning struction
Con-Asset Management Systems • Condition Database/
Capital Planning Tool (VFA) • CMMS (Saber) • CAFM (Archibus) Decision Support System
Excel / VFA / Skire Unifier FACILITIES INFORMATION SYSTEMS Project Management Information System Skire Unifier Maintenance & Operations Design Commissioning Capital
Planning struction
Con-Asset Management Systems • Condition Database/
Capital Planning Tool (VFA) • CMMS (Saber) • CAFM (Archibus) Decision Support System
Excel / VFA / Skire Unifier FACILITIES INFORMATION SYSTEMS Project Management Information System Skire Unifier Strategic Planning Disposal / Recycling Services & 3. Project Management 4. Services, Operations and
Maintenance Management
1. Strategic Planning
2. Capital Planning
The four KPAs are sequenced by the asset life cycle and form a very simple process sequence. This sequence is the simplest representation of the Built Environment Management Model. The two dimensional diagram shows the value proposition of each of the four Key Process Areas:
KPA 1, Strategic Planning, is a core function of the
organization and as such at the top of the “value stream”.
KPA 2, Facilities Planning, is a tactical function that, on a
strategic level, optimizes the organizational investment with regard to the Facility Portfolio. Decisions related to the mix of the Facility Portfolio (such as lease vs. buy vs. built) have a direct impact on an organization’s balance sheet.
KPA 3, Capital Project & Transaction Management, is an
operational function delivering a specific project or transaction as defined in the planning function. While a single project solves a specific problem (operational perspective), several projects combined into a portfolio require a more tactical perspective to decide on the best sequence and resourcing of the multiple projects. A well-delivered portfolio of projects generate strategic value, by having a minimal detrimental impact on the core business, while delivering projects that fully support the core business’ strategic objectives (strategic perspective).
KPA4, Services, Operations and Maintenance
Management, consists of a large number of operational functions. Similar to the Project Management process area, each of the operational activities is rolled-up to a tactical function, which oversees the work and ensures consistency and efficiency in the operation and maintenance of the facilities and in the delivery of services. Well-run functions in this process area have significant strategic benefits, as they provide an environment within which the organization can perform optimally.
6. The “Organizational Value”
Hierarchy of the Built Environment
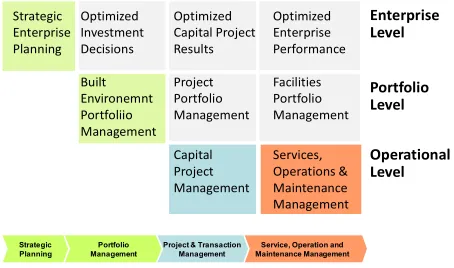
Recognizing that all proposed KPAs generate strategic value to the organization, even though they are implemented in a non-strategic operational environment, the model aims to visualize the value stream from the operational level up to the strategic level. It introduces “value perspectives” as a secondary organizing principle and shows if a facilities process has a strategic, tactical or operational perspective, similar to the approaches chosen by the European Norm EN15221-1:2006 or the National Research Council (2008). To visualize both dimensions in one diagram, the model unrolls the circular process diagram along the linear x-axis, and plots the “value hierarchy” along the y-axis. The diagram shows value streams within FM for each function in a vertical direction upwards.
The matrix shows the strategic relevance of every asset lifecycle process area. The process area “Strategic
Enterprise Planning” performed at the enterprise level and has direct impact on the enterprise, i.e. it is a function of “Strategic Value” The process areas “Built Environment Portfolio Management” is performed at the “Portfolio Level”. The strategic value for this function is identified on the enterprise level as “Optimized Investment Decisions”, i.e. the decision of how the built environment should be financed and procured has direct implications on the organization’s investment structure.
Strategic Optimized Optimized Optimized
Enterprise Investment Capital Project Enterprise
Planning Decisions Results Performance
Built Project Facilities
Environemnt Portfolio Portfolio
Portfoliio Management Management
Management
Capital Services,
Project Operations &
Management Maintenance
Management
Service, Operation and Maintenance Management Project & Transaction
Management Portfolio
Management Strategic
Planning
Enterprise Level
Portfolio Level
Operational Level
Fig. 3. The two dimensions of BEM2
The process areas “Capital Project Management” and “Services, Operations and Maintenance Management” are operational. They roll up to a portfolio level, which is the senior management function within the FM/RE department. This level coordinates multiple capital projects, and establishes standards for services, operations and maintenance by negotiating Service Level Agreements with clients. The strategic value of the Project Function are “Optimized Project Results”. The strategic value of the
functions “Services, Operations and Maintenance
Management” results in “Optimized Enterprise
Performance”. The vertical dimension of the matrix therefore shows the value stream from the operational and tactical activities up to the strategic enterprise level.
Horizontally, the matrix shows the organizational layers relevant to the Built Environment. The top layer, the strategic perspective, defines the strategic value of each KPA. The second layer addresses the tactical perspective of FM/RE. The functions on this layer are typically owned by senior personnel in the Facilities and Real Estate Management departments. The third layer, the operational perspective, describes the execution layer of the FM/RE function.
7. The Survey
Table 1. Survey Participants
Industry Number of Participants
Health Care 16
Higher Education 8
Real Estate 6
Hospitality 4
Financial Institutions 3
Other industries 16
Total 53
More than 50 organizations with major real estate portfolios in the North America and Europe from a wide range of industries have been assessed this far (Table 1).
The procedure of the survey can be divided into three phases. A personal interview with one or several staff members responsible for the FM/RE of the company is conducted initially. Phase two consists of the data analysis and the graphic visualization of the feedback. Phase three is optional and includes an interpretive summary of the findings and recommendations for areas of improvements.
Fig. 4. Assess Process Sequence
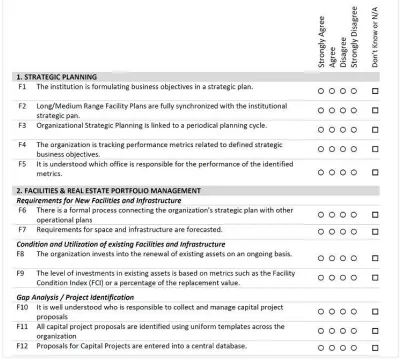
Phase I: Interview / Completion of Questionnaire The basis of the interview consists of a questionnaire with two main parts. The first section includes open questions about the interviewee, company size and budgetary volumes, staffing and management responsibility, as well as organization of the FM/RE departments. The
second part of the questionnaire includes 55 statements to systematically analyse the organizational maturity of the BEM2 processes areas. Interviewees identify if they agree or disagree with the applicability of the provided statements in their organization (Figure 5).
Phase II: Analysis and Visualization
The information is recorded in a data base, which calculates relative maturity scores based on the interviewee’s feedback. The resulting “maturity profile” can be compared against peer participants, or similar industry groups to establish a relative strength-weakness pattern of the interviewee’s FM/RE environment. The “maturity profile” includes a visual summary with and a detailed comparison of each statement. The visual summary is a spider diagram summarising the findings and displaying them on a percentage scale. Organisations that indicated higher maturity levels have higher percentage scores, while organizations with more informal or impromptu (less mature) processes have lower scores
(Figures 7,8,9).
The second part of the analysis compares each statement evaluated by the interviewee against the peer group and all participants (Figure 6). The left-hand columns list the statements with corresponding answers by the interviewee. This answer is compared against the average value of the peer group. The comparison against all participants shows how far the responses were spread, and if the interviewee’s feedback was above or below the average plus/minus 1 Standard Deviation. The symbols highlight answers in round green those statements where the interviewee was above average, and show in red diamonds where responses are significantly lower than the overall average.
Figure 6. Comparative analysis of each statement
Phase III: Identification of Best Practice and Recommendations for Areas of Improvement
The last step of the maturity assessment is the interpretation of the variance of the subject organization’s maturity profile from the benchmark (peer group, or different industry). Above average scores indicate the existence of “best practices”, while lower scores pose the question if improvement of maturity (i.e. implementation of better defined and measured processes) could improve organizational performance.
8. Exemplary Review of Findings
The methodology and approach has received positive feedback from participating organization. The BEM3 tool appears to be a reliable measure of organizational FM
maturity and helps organizations to obtain a high-level overview of their performance. While the current sample size of some 50 participating organization doesn’t allow for a thorough statistical analysis yet, initial reviews the findings data is posing interesting questions. Comparing the maturity profiles between Higher Education and Health Care, on average FM in Health Care appears to be more mature than FM in Higher Education, except for “Facilities
Client Satisfaction Assessment” and “Services
Management”, where FM in Higher Education appears to be more mature (Figure 7).
0% 25% 50% 75% 100%
1.1 Strategic Planning
2.01 Definition of Requirements for New …
2.02 Assessment of Condition and Utilization of existing …
2.03 Gap Analysis / Project Identification
2.04 Project Categorization, Evaluation and Prioritization
2.05 Portfolio Review/Project Authorization / Capital …
3.01 Project Planning 3.02 Project Implementation
and Control 3.03 Project Commissioning
4.00 Client Satisfaction 4.01 Maintenance
Management 4.02 Operations Management
4.03 Services Management 4.03 Space Management
4.04 Facilities Audits
Av Health Care (n = 14) Av Higher Ed. (n = 8)
Figure 7. Comparison of FM Maturity in Healthcare vs. Higher Education
0% 25% 50% 75% 100%
1.1 Strategic Planning
2.01 Definition of Requirements for New …
2.02 Assessment of Condition and Utilization of existing …
2.03 Gap Analysis / Project Identification
2.04 Project Categorization, Evaluation and Prioritization
2.05 Portfolio Review/Project Authorization / Capital …
3.01 Project Planning 3.02 Project Implementation
and Control 3.03 Project Commissioning
4.00 Client Satisfaction 4.01 Maintenance
Management 4.02 Operations Management
4.03 Services Management 4.03 Space Management
4.04 Facilities Audits
Country: Austria (n = 16) Country: USA (n = 14)
Figure 8. Comparison of FM Maturity in Austria vs. USA
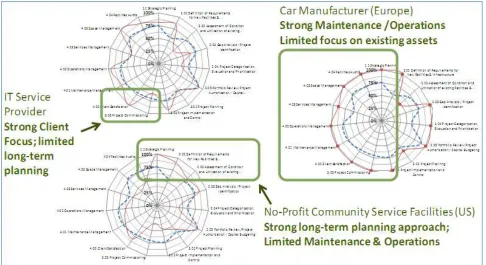
While the above findings will only be reliable when based on significantly larger sample sizes, BEM3 is providing helpful results to participating organizations. In Figure 9 there are shown some samples of best practices areas. The spider diagram allows identifying very easy strengths and weakness of selected organizations from the survey. In addition, a few interesting trends are emerging:
• Non-profit organizations tend to have strong
long-term planning capacities. This finding is supported by the fact that the development of new facilities for the studied non-profit organizations is significantly more complex than for the studied non-profit organizations.
• Processing and manufacturing industries tend to have
higher maturity scores than service industries.
• While healthcare organizations have consistently high
maturity scores for maintenance and operations, they have great maturity variances in the process areas for planning and project implementation.
• Higher education organizations have high maturity
variances in all areas.
Figure 9. Best Practices areas of selected organizations
9. Discussion and Critical Review
Both the “Built Environment Management Model” (BEM2), as well as its complementing assessment tool, the “Built Environment Management Maturity Model” (BEM3), present industry neutral instruments to classify and assess the management functions related to the built environment. The purpose of the models is to help organisations understand the interdependencies of facility-related processes and their impact on organizational strategy and performance. The assessment tools BEM2 and BEM3 aim to allow for comprehensive and at the same time cost effective evaluations of FM/RE functions. BEM2 and BEM3 are primarily aimed at real property but are theoretically applicable to other types of capital assets such as production assets or information technology assets. The assessment tool BEM3 in its current form captures an actual situation and highlights strengths and weaknesses, whereas the other models (Balanced Scorecard, EFQM, 7s-model, Six Sigma, Deming, Malcolm Baldrige, St. Galler Management Model) aim to change the actual state.
It is important to recognize that high maturity levels are not necessarily best for the organization. High maturity scores necessitate significant investments in business maturity (business automation, information processing and change management). For stable, high volume business environments these investments are necessary, but other environments may be too fluid to justify the investments. The research authors realize that “appropriateness” of process maturity may be more important than the absolute score. The researchers recommend that companies review the variance of the company’s maturity capability profile
from the peer group, rather than focusing on the absolute
score. With increasing numbers of organizations
recognizing the usefulness of a systematic Facility Management function (Madritsch, 2009), this research could help to determine the appropriate level of investments in Facility Management functions so that it can serve the organization most efficiently. The resulting maturity profiles provide a high-level overview of current practices in Facilities Management. The results allow organizations to benchmark their FM maturity against peer groups, as well as against best practice industries. By assessing the level of process maturity, the profile allows organization to develop “winnable” improvement initiatives to increase the strategic value of the Facility Management function.
In developing the BEM2/BEM3 frameworks further, the research team will increase the sample size and refine the taxonomy of FM/RE processes and knowledge. The findings will help to further professionalize Facility Management functions to raise the efficiency of organizational processes.
References
[1] Becker, F. (2003), "Integrated portfolio strategies for dynamic organizations", Facilities, Vol. 21, No. 11/12, pp.289 – 298.
[2] Berger, R. (2001): “Trend Studie für Facility Managemet”, Roland Berger Strategy Consultants und GEFMA, München. [3] Carnegie Mellon University (2006): Capability Maturity
[4] Chotipanich, S. (2004): “Positioning facility management”,
Facilities, Vol. 22 No. 13/14, pp. 364-372.
[5] Chotipanich, S., Nutt, B.(2008), “Positioning and repositioning FM”, Facilities, Vol. 26, No. 9/10, pp. 347-388.
[6] Cooke-Davies, T. J., Arzymanow, A. (2002): “The maturity of project management in different industries: An investigation into variations between project management models”, International Journal of Project Management, Vol. 21, pp. 471-478.
[7] Dettbarn, J., Ibbs, C.W., Murphree, E.L. (2005), “Capital Project Portfolio Management for Federal Real Property”,
Journal of Management in Engineering, Vo. 21, No. 1, pp. 44-53.
[8] European Committee for Normalization (2006-2009):
Facility management Norm EN15221, published by CEN National Members.
[9] Ghalayini, A.M., Noble, J.S.: The changing basis of performance measurement, in: International Journal of Operations & Production Management, 16/8, 1996, S. 63-80.
[10] Grabatin, G. (2001): „ Betriebswirtschaft für Facility Management“, TAW-Verlag, Wuppertal.
[11] Harris, I. (2002), “Bigger and better FM - to improve everyday life”, in: European Facility Management Conference Proceedings, Madrid, pp. 67-74.
[12] Hinks, J. (2004), “Business-Related Performance Measures for Facilities Management”, Keith, A., Atkin, B., Bröchner, J. (Eds.), Facilities Management / Innovation and Performance, Spon Press, New York, NY, pp. 99-107. [13] IFMA (2010), “Competency Areas”, available at:
http://www.ifma.org/learning/
fm_credentials/competencies.cfm (accessed on October 27, 2010).
[14] Institute of Asset Management (2008), IAM PAS 55:2008 Competence Framework (Part 1 and 2), IAM, London. [15] Madritsch, T. (2009), “Best practice benchmarking in order
to analyze operating costs in the health care sector“, in:
Journal of Facilities Management, ISNN 1472-5967, Vol.7 No.1, pp.61-73.
[16] Madritsch, T., Steixner, D., Ostermann, H., Staudinger, R. (2008), “Operating cost analyses of long term care facilities”, in: Journal of Facility Management, ISNN 1472-5967, Vol.6 No.2, pp.152-170.
[17] Mullaly, M. (2006), “Longitudinal Analysis of Project Management Maturity”, Project Management Journal, Vol. 37, No. 3, pp. 62-73.
[18] National Research Council (2008), Core Competencies for Federal Facilities Asset Management through 2020: Transformational Strategies. The National Academic Press. Washington, DC.
[19] Neely, A., Gregory, M., Platts, K.(995): “Performance measurement system design: a literature review and research agenda”, in: International Journal of Operations & Production Management, 15/4, p. 80-116.
[20] Office of Government Commerce (2006): Portfolio, Program & Project Management Maturity Model (P3M3). London: OGC.
[21] Office of Government Commerce (2010), “Information Technology Information Libraries (ITIL) – the Basics”,
available at
http://www.best-management-practice.com/gempdf/ITIL_The_Basics.pdf (accessed on 28 October 2010).
[22] Olbrich, A. (2008): “Effizientes IT Service Management” in:
ITIL kompakt und verständlich, Vieweg+Teubner,
Wiesbaden
[23] Reuter, F., Ebinger, M. (2009): “An American Approach to Capital Asset Lifecycle Management” in: EuroFM Conference Proceedings, Amsterdam.
[24] Shoet (2006), “Key Performance Indicators for Strategic Healthcare Facilities Maintenance“, Journal of Construction Engineering and Management, Vol. 132, No. 4, pp. 345-352. [25] Teicholz, E., Nofrei, C., Thomas, G. (2005), “Executive Order #13327 for Real Property Asset Management”. IFMA Journal, Nov/Dec issue.
[26] Then, D. (1999), “An integrated resource management view of facilities management“, Facilities, Vol. 17, No. 12/13, pp. 462 – 469.
[27] Then, D. (2004), “The Future of Professional Facility Management Education in the Asia-Pacific Region”, paper presented at “New World Order in Facility Management Conference”, June 2004, Hong Kong.