Ruben Omar Arias (Correspondence)
iaroa@yahoo.com.ar
+54- 221-236758 Int. 419This article is published under the terms of the Creative Commons Attribution License 4.0 Author(s) retain the copyright of this article. Publication rights with Alkhaer Publications. Published at: http://www.ijsciences.com/pub/issue/2017-02/
DOI: 10.18483/ijSci.1191; Online ISSN: 2305-3925; Print ISSN: 2410-4477
Effect of Type of Hay and Concentrate Level in
Intake and Digestibility in Diets for Goats
R. O. Arias
1
, M.G. Muro
1
, M.S. Trigo
1
, S. Deschamps, J. Origlia
2
,
D. Gornatti Churria
2
, A. A CATTANEO
3
, C.A. Cordiviola
1
1
Faculty of Agricultural and Forestry Sciences. UNLP. Course Introduction to Animal Production
2
Faculty of Vetеrinary Cience. Course Pathology of birds and pilipers
3
IGEVET, Faculty of Vetеrinary
( 60 y 119 s/n La Plata. Buenos Aires. Argentina )
Summary: The aim of this study was to evaluate the effect of the level of hay and concentrate on total hay intake and supplied already, the additive/substitutive effect and total apparent digestibility of the diet intake in diets for goats. Experiment I: diets: Alfalfa hay (A1), Alfalfa hay + corn (0.5% LW/day) (A2), + 1% LW/day (A3), + 1.5% LW/day (A4). Experiment II: diets: Natural grassland hay (CN) (R1), hay CN + corn (0.5% LW/day) (R2), hay CN + corn (1% of LW/day) (R3), + 1.5% of LW/day) (R4). Intake, ratio forage/concentrate and total apparent digestibility were calculated. Experiment I: There were no effects (p> 0.05) on the CMST for the corn tested levels and recorded a linear decrease (p <0.05) in the CTFDN, CTFDA and CTPB. The CMSF decreased linearly (p <0.05) with increasing amounts of corn by verifying a hay effect on the concentrate. The F/C was different (p <0.05) in all treatments. The DTAIVMS increases linearly (p <0.05) with the content of corn in the diet. Experiment II:a linear increase (p <0.05) on the CMST and CTPB with increasing corn in diet and no differences (p> 0.05) on the CMSF, CTFDN and CTFDA is observed. The F/C and CTPB differ (p <0.05) among all the diets tested. The DTAIVMS increases linearly (p <0.05) with the content of corn in the diet. Therefore, it can be concluded that the increase of maize levels improved the total digestibility of the ration consumed and the substitute or additive effect depended on the quality of the hay used.
Keywords: goats, concentrated, fiber
Introduction
Extensive production of goats is based on the utilization of forage. Alfalfa is considered valuable forage to feed goats for their high protein content and a lower concentration of neutral detergent fiber. The high content of soluble fiber high degradability and low NDF has a positive effect on rumen fill and dry matter intake (Rapetti et al., 2005). However, there is a trend towards intensification and increased use of concentrates to sustain high levels of productivity (Russell & Rychlik 2001; Castel et al., 2003). Goats change their feeding behavior according to the availability of forage or concentrate, and its ability to select foods high protein content and digestibility, adapting to different conditions, ranging from grassland to the desert (Provence et al., 2003; Rapetti & Bava, 2008).
http://www.ijSciences.com
Volume 6
– February
2017 (02
)
35
1999). INRA in 1979 and improved in 1987 incorporates the concept of Ballast Unit (UL) food, to represent the ingestibilidad forage. Mertens (1987) postulates a negative effect of NDF pasture intake and maximum intake values FDN should not exceed 1.2% of live animal weight or 35% of that fraction in the diet. Mertens (2010), the equation of Van Soest (Goering and Van Soest, 1970) describes the mathematical relationship of the DM digestibility (DDM), digestibility of neutral detergent fiber (NDFD) and digestibility of its complement, soluble in neutral detergent. The equation mentioned is: DDM = 87.1 – (0.98 – DFDN) x FDN. This equation indicates a negative relation between DM digestibility and NDF. It also suggests that if the NDF concentration and its digestibility are known, it is better described the variation that most affects the DDM, which variable is related to the energy of the feed available to the animal.
Another limiting factor to intake is the proportion protein in the diet, with values less than 8% decrease intake animals (Aello & Di Marco, 2000)
When ruminants consume forage and receive supplements, consumption of dry matter forage generally decreases, which is known as replacement rate (Viglizzo, 1981; Minson, 1982; Kellaway & Porta, 1993; Stock dale, 2000). If pastored quality forage is insufficient, proper supplementation can increase the amounts ingested forage and therefore the total consumption of MS, this phenomenon is known as an addition (NRC, 1987; Minson, 1990; Mayne, 2007).
The incorporation of corn grain in ruminant feed increases the digestibility of dry matter consumed however could reduce forage digestibility (Archimède et al., 1995; Molina & Alcaide et al., 2000; Fimbres et al., 2002; Rapetti et al., 2004). Foods like mature hays and pastures induce pH values of 6.5 to 6.8, optimal for cellulolysis predominance of acetic acid with (Aello & Di Marco, 2000). High starch content reduces the fiber digestion due to microbial fermentation of nonstructural carbohydrates, reduced ruminal pH and cellulolytic lower activity (Mould & Orskov 1984; Kovacik et al., 1986; Grant & Mertens, 1992; Garces-Yepez et al., 1997; Arias et al., 2013; Arias et al., 2015).
The aim of this study was to evaluate the effect of the level of hay and concentrate on total hay intake and supplied already, the additive / substitutive effect and total apparent digestibility of the diet intake in diets for goats.
Materials and methods
This production was regulated and authorized by the Institutional Committee for the Care and Use of Laboratory Animals of the Faculty of Veterinary Sciences of the National University of La Plata. Whose file number is 0600-008961 / 12-000
The study was conducted in goat’s experimental unit of the Faculty of Agricultural and Forestry Sciences of the National University of La Plata.
4 goats’ crosses (Nubian x Creole) and 5 years old and 39.77 ± 1.07 kg live weight (LW) were used on average. The experimental design was a 4x4 Latin square with a repeat, with 7-day wash-out between periods. During the time in which the determinations were made, the goats were housed in individual compartments (0.80m x 1.50m) with wooden slatted floor (slats), feeders and automatic waters type pacifier with free access to water. The weight of each animal at the beginning of each period is recorded.
Experiments and tested diets.
Experiment I: 4 diets were provided:
Alfalfa hay (A1)
Alfalfa hay + ground grain corn (0.5% LW / day) (A2)
Alfalfa hay + ground grain corn (1% LW / day) (A3)
Alfalfa hay + ground grain corn (1.5% LW / day) (A4)
Experiment II: 4 diets were provided:
Natural grassland hay (CN) (R1)
Hay CN + ground grain corn (0.5% LW / day) (R2)
Hay CN + ground grain corn (1% of LW / day) (R3)
Hay CN + ground grain corn (1.5% of LW / day) (R4)
The predominant species were hay CN, Briza subaristata, Stipa neesiana, Paspalum dilatatum, Bothriochloa legaloides; Lolium multiflorum.
http://www.ijSciences.com
Volume 6
– February
2017 (02
)
36
Determining intake, ratio forage / concentrate andtotal apparent digestibility
In experiments I and II determining the fodder consumption was performed during the 4 days of feces collection, after the habituation period to the different diets. To ensure ad libitum character of supply feeders they remained consistently provided the recorded amounts of spiked hay, using an electronic scale model Croma brand Systel. Intake of total dry matter (CMST) was calculated by summing the dry matter provided by the hay (CMSF) and corn (CMSMz) expressed in Kg / day. The concentrated feed ratio (F / C) was rated as the proportion of hay and concentrate consumed with respect to CMST. It was collected and the excreted fecal matter is quantified by collecting bag. These were hollowed out once a day daily weighing all dregs and a subsample consisting of 10% of the evacuated was determined dry matter (AOAC, 1995). Total digestibility of dry matter consumed from the difference between the ingested and excreted in relation to ingested, expressed as percentages (%) was calculated.
Statistical Analyses
Statistical model: Y = µ + T + UE + P + e Y: dependent variable μ: average overall trial T: treatment
EU: experimental unit P: period
e: error
Data were analyzed by MIXED procedure (SAS, 2004) for a 4 × 4 Latin squares, using a mixed model that included the fixed effect of sampling (treatment period) and the random effect of the animal. Orthogonal polynomial contrasts were used to determine linear effects (L), quadratic (Q) and cubic (C) of increasing levels of ground corn in the variables analyzed. The differences were considered significant with a P value of <0.05 and trends 0.05 <P <0.10. In experiment II a simple linear regression was performed to determine correlation between the total dry matter intake and intake of PB and total dry matter digestibility.
Results and discussion
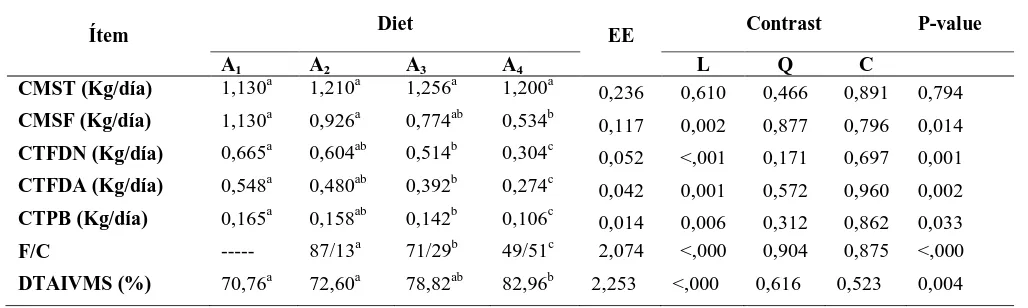
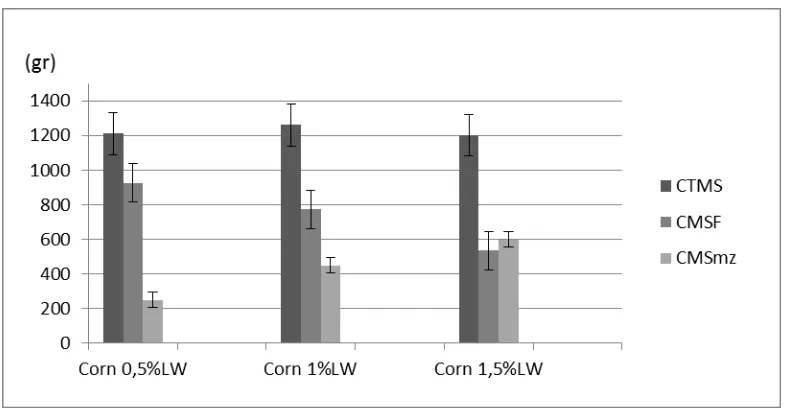
Experiment I: Through analysis of orthogonal polynomial contrasts, no significant effects (p> 0.05) were observed in the CMST to concentrate levels tested and recorded a significant linear decrease (p
<0.05) in the CTFDN, CTFDA and CTPB. CMSF decreases linearly (p <0.05) with increasing amounts of ground corn verifying a substitute effect concentrated on alfalfa hay (Figure 1). CMSF, CTFDN, CTFDA and CTPB the A4 diet was
significantly lower (p <0.05) than the A1 and A2 diet.
The F/C differed significantly (p <0.05) among all treatments. The DTAIVMS increases linearly (p <0.05) with the content of corn in the diet. By analyzing average DTAIVMS verified that the A4
was significantly higher (p <0.05) than A1 and A2
(Table 2).
Experiment II: a significant linear increase (p <0.05) on the CMST and CTPB with increasing corn in diet and no significant differences (p> 0.05) on the CMSF, CTFDN and CTFDA is observed. The F/C and CTPB differ significantly (p <0.05) among all the diets tested. The DTAIVMS increases linearly (p <0.05) with the content of corn in the diet. The digestibility of diet with a higher proportion of corn was significantly higher (p <0.05) than the other treatments (Table 3). Figure 2 verifies the additive effect of the increase concentrated in assigned diets. The simple regression analysis fitted a linear model (Figure 3) to describe the relation between total dry matter intake and total PB intake. Adjusted model:
CMST = 170.46 + 13.036*CTPB
The P-value in the ANOVA table (Table 4) is less than 0.05 there is a statistically significant relationship between CMST and CTPB. The R-square indicates that the adjusted model accounted for 88.9829% of the variability in CMST. The correlation coefficient is equal to 0.943308, indicating a relatively strong relation between the variables.
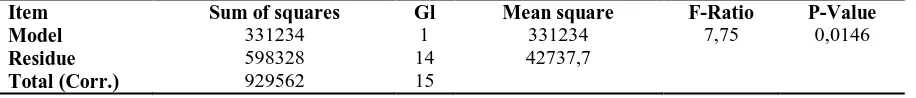
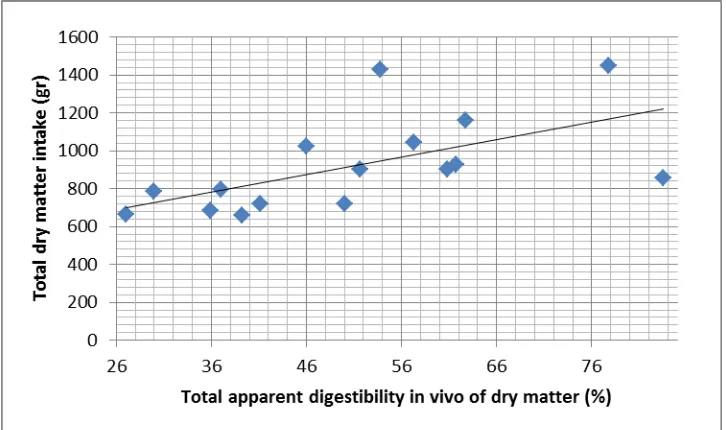
Following the same analysis to relate total dry matter intake and total dry matter digestibility, the results adjusted to a linear model (Figure 4). Adjusted model:
CMST = 449.286 + 9.2497*DTAIVMS
The P-value in the ANOVA table (Table 5) is less than 0.05 there is a statistically significant relationship between CMST and DTAIVMS. The R-square indicates that the adjusted model accounted for 88.9829% of the variability in CMST. The correlation coefficient is equal to 0.5969, indicating a moderately strong relation between variables.
http://www.ijSciences.com
Volume 6
– February
2017 (02
)
37
dale, 2000), which is known as replacement rate. In Experiment I, the substitution effect is observed, verifying the change in feeding behavior cited by Provenza et al., (2003); Rapetti & Bava, (2008) in relation to consumption of forage or concentrated and capacity to select food goats high digestibility and adaptation to different types of diets. In experiment 2 in accordance with NRC, 1987; Minson, 1990; Mayne, 2007 the additive effect was proved due to incorporation of corn to the diet with hay CN which increased digestibility and total dry matter intake (Molina & Alcaide et al., 2000; Fimbres et al., 2002; Rapetti et al., 2004; Archimède et al., 1995).
It coincides with Coleman et al., (1999); NRC (2001) that the apparent digestibility of the dry matter in vivo and the intake of dry matter results in the consumption of dry matter digestible. In this paper according to Mertens (2010) and Relling & Mattioli (2013) it was shown an inverse relation between the fiber content of the diet and total intake. In accordance with Aello 2000, in experiment II was verified that the increase in PB diet increased the total dry matter intake.
The incorporation corn grain to the diet improved the apparent total digestibility. Although ruminal pH was not measured, it was probable that the quantities of grain tested decreased the digestibility of the fiber (Mould & Orskov 1984; Kovacik et al., 1986; Grant & Mertens, 1992; Garces-Yepez et al., 1997; Arias et al., 2013; Arias et al., 2015).
Conclusion
Therefore, it can be concluded that the increase of corn levels improved the total digestibility of the ration consumed and the substitute or additive effect depended on the quality of the hay used.
References
1) Aello M., O. Di Marco. 2000. Consumo. In Nutrición animal. (ed) Universidad Nacional de Mar del Plata. Facultad de Ciencias Agrarias. Balcarce, Argentina. pp: 163-185. 2) AOAC. 1995. Dry mater in Animal Feed. Method number
934.01. In: Official Methods of Analysis of AOAC International. 16 th ed. vol. I. Association of Official Analytical Chemists, Arlington, VA, USA, pp, I (Chapter 4). 3) Archimède, H., D. Sauvant, J. Hervieu, C. Poncet & M.
Dorleans. 1995. Digestive interactions in the ruminant relationships between whole tract and stomach evaluation. Anim. Feed Sci. Technol. 54:327–340.
4) Arias, R., M. G. Muro, C.A. Cordiviola, M.S Trigo, M. Brusa, R. A. Lacchini. 2013. Incidencia de la proporción de maíz sobre la degradabilidad in situ de heno de alfalfa en dietas para caprinos. Revista de la Facultad de Agronomía, La Plata. Vol 112 (2): 62-67.
5) Arias, R., M. G. Muro, C.A. Cordiviola, A. C. Cattáneo, M.S Trigo & R.A. Lacchini. 2015. Efecto de la suplementación con grano de maíz sobre la digestibilidad in vivo de heno de alfalfa en caprinos. Revista de la Facultad de Agronomía, La Plata. Vol 114 (1): 44-48.
6) Bach A, S Calsamiglia, MD Andstern. 2005. Nitrogen metabolism in the rumen. Journal of Dairy Science. 88, E9– E21.
7) Castel, J.M; Y. Delgado-Pertíñez, J. Camúñez, J. Basulto, F. Caravaca, J.L. Guzmán, M.J. Alcalde. 2003. Characterisation of semi extensive goat production systems in Southern Spain. Small Ruminall Res47, 1–11.
8) Cerrillo, M. A., J. R. Russell & M. H. Crump. 1999. The effects of hay maturity and forage to concentrate ratio on digestion kinetics in goats. Small Rumin. Res. 32, 51–60. 9) Coleman, S.W., Lippke, H. & Gill, M. 1999. Estimating the
nutritive potential of forages. In: Nutritional Ecology of Herbivores (Ed.H.J. Jung y G.C. Fahey), pp. 647.
10) Fimbres, H., J. R. Kawas, G. Hernandez-Vidal, J. F. Picon-Rubio, C. D. Lu. 2002. Nutrient intake, digestibility, mastication and ruminal fermentation of lambs fed finishing ration with various forage levels. Small Rumin. Res. 43, 275– 281.
11) Goering, H.K. and Van Soest, P.J. 1970. Forage fiber analysis (apparatus, reagents, procedures and some applications). Agricultural Handbook N° 379 ARS-USDA, Washington, DC.
12) INRA. 1987. Laboratoire de recherche sur la viande. Centre de recherche de Jouy-en-Josas, Jouy-en-Josas, Versailles, France. Vol 5, 251 pp.
13) Kellaway, R. & S. Porta. 1993. Feeding concentrates supplements for dairy cows. Dairy Research and Development Corporation. Australia. 176 pp.
14) Komarek, A. R., J. B. Robertson & P. J. Van Soest. 1994. Comparison of the filter bag technique to conventional filtration in the Van Soest Analysis of 21 feeds. In: Proc. Natl. Conf. on Forage Quality, Evaluation and Utilization, Lincoln, NE. pp.78.
15) Lu, C. D.; J. R. Kawas; O. G. Mahgoub. 2005. Fibre digestión and utilization in goats. Small Rumin. Res. 60, 45– 52.
16) Mayne, J. 2007. Challenges and Lessons in Implementing Results-Based Management. Evaluation, 13, 89-107. 17) Matejovsky, K.M.D & W. Sanson. 1995. Intake and digestion
of low-, medium-, and high- quality grass hays by lambs receiving increasing levels of corn supplementation. J. Anim. Science.73, 2156–2163.
18) Mertens, D.R. 1987. Predicting intake and digestibility using mathematical models of ruminal function. J. of Animal Sci.
64, 1548-1558.
19) Mertens, D.R. 2010. NDF and DMI – has anything changed? <http//www.ansci.cornell.educnconf2010proceedingsCNC20 10.18.Mertens.pdf> [Consulta: 24 enero de 2017].
20) Minson, D. J. 1982. Effects of chemical and physical composition of herbage eaten upon intake. In Nutritional Limits to Animal Production from Pastures, pp. 167-182 [J. B. Hacker, editor]. Farnham Royal: Commonwealth Agricultural Bureaux.
21) Minson, D.J. 1990. Forage in ruminant nutrition. Academic Press, San Diego, 483 pp.
22) Molina-Alcaide, E., A.I. Martín-García, J.F. Aguilera. 2000. A comparative study of nutrient digestibility, kinetics of degradation and passage and rumen fermentation pattern in goats and sheep offered good quality diets. Livest. Prod. Science.64, 215–223.
23) Mould, F. L & E.R. Orskov. 1984. Manipulation of rumen fenid pH and influence on cellulose in sacco, dry matter degradation and the run microflora of sheep offered either hay or concentrate. Animal Feed Science and Technology. 10, 1-14.
24) NRC. 1987. “Predicting feed intake of food-producing animals”. National Academy Press. Washington, D.C. 25) NRC. 2001. National Research Council. Nutrient
Requirements of Dairy Cattle.7th rev. ed. Natl. Acad. Press Washington, DC. USA.
http://www.ijSciences.com
Volume 6
– February
2017 (02
)
38
and plant biochemical diversity. Small Ruminant Research.49, 257–274.
27) Rapetti, L., L. Bava, A. Tamburini, G.M. Crovetto. 2005. Feeding behaviour, digestibility, energy balance and productive performance of lactating goats fed forage-based and forage-free diets. Italian Journal of Animal Science. 4, 71–83.
28) Rapetti, L & L. Bava. 2008. Feeding Management of Dairy Goats in Intensive Systems. In: Dary goats Feedeing and Nutrition. (ed). Cannas A, G Pulina (ed). Milan, Italy, p. 221-337.
29) Relling A & Mattioli G. 2013. Fisiología digestiva y metabólica de los rumiantes. Ed: Facultad de Ciencias Veterinarias. UNLP. 104 pp.
30) Russell, J. B & J. L. Rychlik. 2001. Factors that alter rumen microbial ecology. Science 292, 1119-1122.
31) SAS Institute Inc. 2004 SAS On lineDoc* 9.1.3. Cary, NC: SAS Institute. Inc.
32) Van Soest, P.J, Robertson, J.B., Lewis, B.A. 1991. Methods for dietary fiber neutral detergent fiber and non-starch polysaccharids in relation to animal nutrition. J.Dairy Sc.74, 3583-3597.
33) Viglizzo, E. 1981. Dinámica de los sistemas pastoriles de producción de leche. Cap. 8: La suplementación de pasturas. Ed. Hemisferio Sur. p. 67-82.
34) Yanez-Ruiz, D. R., A. Moumen, A. I. Martin-Garcia, and E. Molina-Alcaide. 2004. Ruminal fermentation and degradation patterns, protozoa population, and urinary purine derivatives excretion in goats and wethers fed diets based on two-stage olive cake: Effect of PEG supply. J. Anim. Sci. 82, 2023–2032.
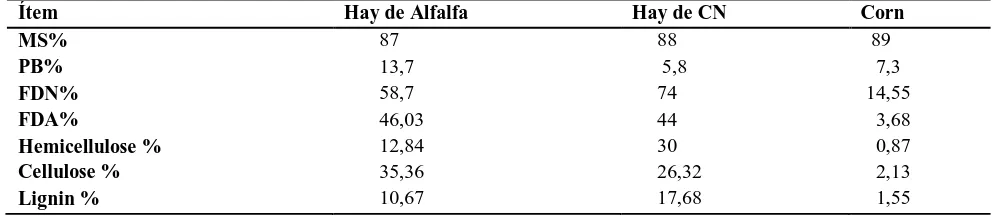
Table 1: Chemical composition of food (*)
* Laboratory of biochemistry of the Faculty of Agrarian and Forest Sciences. UNLP. MS: dry matter.
PB: crude protein.
FDN: Neutral Detergent Fiber. FDA: Acid Detergent Fiber.
Ítem Hay de Alfalfa Hay de CN Corn
MS% 87 88 89
PB% 13,7 5,8 7,3
FDN% 58,7 74 14,55
FDA% 46,03 44 3,68
Hemicellulose % 12,84 30 0,87
Cellulose % 35,36 26,32 2,13
http://www.ijSciences.com
Volume 6
– February
2017 (02
)
39
Table 2: CMST, CMSF, CTFDN, CTFDA, CTPB, DTAIVMS, F / C of the experiment IA1: 100% hay de alfalfa ad libitum.
A2: 0.5% LW/day of ground corn and alfalfa hay ad libitum in the diet.
A3: 1% LW/day of ground corn and alfalfa hay ad libitum in the diet.
A4: 1.5% LW/day of ground corn and alfalfa hay ad libitum in the diet.
CMST: Total dry matter intake (Kg).
DTAIVMS: Total apparent digestibility in vivo of dry matter (%). CMSTD: Total digestible dry matter intake (Kg/day).
CMSF: Dry matter intake of forage (Kg/day). CTFDN: Total FDN intake (Kg/day). CTFDA: Total FDA intake (Kg/day). CTPB: Total PB intake (Kg/day). F/C: ratio forage/concentrate (%). EE: Standard error.
L: Probability value associated with a linear effect level of supplementation with corn in contrast orthogonal polynomial.
Q: Probability value associated with a quadratic effect level of supplementation with corn in contrast orthogonal polynomial
C: Probability value associated with a cubic effect level of supplementation with corn in contrast orthogonal polynomial.
P valor: Equal letters indicate no significant differences for the 5% probability.
Ítem Diet EE Contrast P-value
A1 A2 A3 A4 L Q C
CMST (Kg/día) 1,130a 1,210a 1,256a 1,200a 0,236 0,610 0,466 0,891 0,794
CMSF (Kg/día) 1,130a 0,926a 0,774ab 0,534b 0,117 0,002 0,877 0,796 0,014
CTFDN (Kg/día) 0,665a 0,604ab 0,514b 0,304c 0,052 <,001 0,171 0,697 0,001
CTFDA (Kg/día) 0,548a 0,480ab 0,392b 0,274c 0,042 0,001 0,572 0,960 0,002
CTPB (Kg/día) 0,165a 0,158ab 0,142b 0,106c 0,014 0,006 0,312 0,862 0,033
F/C --- 87/13a 71/29b 49/51c 2,074 <,000 0,904 0,875 <,000
http://www.ijSciences.com
Volume 6
– February
2017 (02
)
40
Table 3: CMST, CMSF, CTFDN, CTFDA, CTPB, DTAIVMS, F / C of the experiment IIR1: 100% hay de CN ad libitum.
R2: 0.5% LW/day of ground corn and CN hay ad libitum in the diet.
R3: 1% LW/day of ground corn and CN hay ad libitum in the diet.
R4: 1.5% LW/day of ground corn and CN hay ad libitum in the diet.
CMST: Total dry matter intake (Kg).
DTAIVMS: Total apparent digestibility in vivo of dry matter (%). CMSTD: Total digestible dry matter intake (Kg/day).
CMSF: Dry matter intake of forage (Kg/day). CTFDN: Total FDN intake (Kg/day). CTFDA: Total FDA intake (Kg/day). CTPB: Total PB intake (Kg/day). F/C: ratio forage/concentrate (%). EE: Standard error.
L: Probability value associated with a linear effect level of supplementation with corn in contrast orthogonal polynomial.
Q: Probability value associated with a quadratic effect level of supplementation with corn in contrast orthogonal polynomial
C: Probability value associated with a cubic effect level of supplementation with corn in contrast orthogonal polynomial.
P valor: Equal letters indicate no significant differences for the 5% probability.
Table 4: Variance analysis, relation between total dry matter intake and total PB intake
Item Sum of squares Gl Mean square F-Ratio P-Value
Model 827151 1 827151 113,08 0,0000
Residue 102411 14 7315,04
Total (Corr.) 929562 15
Correlation coefficient = 0,943308 R-cuadrad = 88,9829 %
Table 5: Variance analysis, relation between total dry matter intake and total and total apparent digestibility in vivo of dry matter
Item Sum of squares Gl Mean square F-Ratio P-Value
Model 331234 1 331234 7,75 0,0146
Residue 598328 14 42737,7
Total (Corr.) 929562 15
Correlation coefficient = 0,596936 R-cuadrad= 35,6333 %
Ítem Diet EE Contrast P-value
R1 R2 R3 R4 L Q C
CMST (Kg/day) 0,713a 0,803ab 0,944b 1,223c 0,083 0,000 0,218 0,790 0,003
CMSF (Kg/day) 0,713a 0,560a 0,505a 0,596a 0,094 0,315 0,186 0,466 0,401
CTFDN (Kg/day) 0,527a 0,448a 0,449a 0,527a 0,068 0,998 0,261 0,993 0,704
CTFDA (Kg/day) 0,313a 0,256a 0,202a 0,287a 0,074 0,886 0,325 0,898 0,866
CTPB (Kg/day) 0,041a 0,052b 0,059c 0,080d 0,006 0,000 0,237 0,546 0,003
F/C --- 69/31a 54/46b 46/54c 0,052 0,000 0,060 0,697 0,001
http://www.ijSciences.com
Volume 6
– February
2017 (02
)
41
Figure 1: Intake of CTMS, CMSF y CMSmz; experiment I. Substitute effectCTMS: Total dry matter intake (gr). CMSF: Dry matter intake of forage (gr). CMSmz: Dry matter intake of corn (gr).
Figure 2: Intake of CTMS, CMSF and CMSmz; experiment II. Substitute additive
http://www.ijSciences.com
Volume 6
– February
2017 (02
)
42
Figure 3: Simple regression between the total dry matter intake and total intake of PB0 200 400 600 800 1000 1200 1400 1600
36 46 56 66 76 86 96
To
tal d
ry
m
att
e
r
in
tak
e
(gr
)
Total intake PB (gr)