Turkish Journal of Fisheries and Aquatic Sciences 11: 377-383 (2011)
www.trjfas.org ISSN 1303-2712 DOI: 10.4194/1303-2712-v11_3_06
© Published by Central Fisheries Research Institute (CFRI) Trabzon, Turkey in cooperation with Japan International Cooperation Agency (JICA), Japan
Growth Characteristics of the Alga Haematococcus pluvialis Flotow as
Affected by Nitrogen Source, Vitamin, Light and Aeration
Introduction
The carotenoid astaxanthin is one of the most important pigments utilized in various industries. In salmon farming, which is the biggest market for astaxanthin, mostly synthetic form is used. In recent years, however, natural sources of astaxanthin have successfully been used on the pigmentation of the skin and flesh of aquatic animals and poultry (Christiansen et al., 1995; Inborr, 1998; Yamada et al., 1990). In addition, astaxanthin extracted from microbial sources was shown in clinical trials to be a potent antioxidant (Guerin et al., 2003; Kobayashi
and Sakamoto, 1999).
Though many organisms are able to produce astaxanthin, only a few of them have commercially been cultivated. In this respect, the freshwater microalga Haematococcus pluvialis Flotow the most promising organism due to the higher cellular astaxanthin content compared to the others, i.e., more than 4% of dry weight (Lee and Soh, 1991; Torzillo et al., 2003). In general, astaxanthin production from
Haematococcus is achieved through a two-stage culture: vegetative (green) and aplanospore (red) stages (Aflalo et al., 2007; Fabregas et al., 2001). Vegetative cultivation of Haematococcus is the most Tolga Göksan1,*
,
İlknur Ak1, Cenker Kılıç11
Çanakkale Onsekiz Mart University, Faculty of Fisheries, Department of Aquaculture, 17020, Çanakkale, Turkey.
* Corresponding Author: Tel.: +90.286 2180018; Fax: +90.286 2180543; E-mail: tgoksan@comu.edu.tr
Received 22 October 2010 Accepted 15 February 2011
Abstract
In the present study, the effects of various inorganic nitrogen sources, light intensities, aeration rates and especially vitamins were investigated in vegetative Haematococcus pluvialis Flotow cultures. The best growth among the nitrogen sources was achieved in NaNO3 (1.0 g/L) and KNO3 (0.5 g/L) with cell densities of 25.3 and 26.3x10⁴ cells/ml respectively.
In vitamin trials, the highest cell numbers were found in 0.1 (0.3 µM), 1.0 (4 µM) and 0.1 mg/L (0.75 µM) concentrations for thiamin, biotin and B12 respectively. It was also seen that the use of thiamin alone was sufficient instead of using the vitamin mix. Cell growth was significantly higher in 75 and 150 µmol photon m-2 s-1 illuminations compared to 20 and 40 µmol photon m-2 s-1. As for aeration, optimum airflow rate was 1.0 lpm, while supra-optimum levels ceased the growth, cell diameter and pigment content increased. So, it may play a role as a secondary stress factor on H. pluvialis cells in reddening stage.
Keywords: Aeration, Culture medium, Haematococcus pluvialis, nitrogen, vitamins.
Haematococcus pluvialis Flotow Alg Kültürlerine Inorganik Azot Bileşikleri, Işık, Havalandırma ve
Vitaminlerin Etkisi
Özet
Bu çalışmada, vejetatif Haematococcus pluvialis Flotow kültürlerinde çeşitli inorganik azot bileşikleri, ışık şiddetleri, havalandırma hızları ve özellikle vitaminlerin etkileri araştırıldı. Azot kaynakları arasında en iyi büyümeye NaNO3 (1,0 g/L)
ve KNO3 (0,5 g/L)’da sırasıyla 25,3 ve 26,3x10⁴ hücre/ml hücre yoğunlukları ile ulaşıldı. Vitamin denemelerinde, en yüksek
hücre sayıları tiyamin, biyotin ve B12 için sırasıyla 0,1 (0,3 µM), 1,0 (4 µM) ve 0,1 mg/L (0,75 µM) konsantrasyonlarda bulundu. Ayrıca, vitamin karışımı yerine sadece tiyamin kullanımının yeterli olduğu görüldü. Hücre artışı, 20 ve 40 µmol foton m-2 sn-1’lik aydınlatma ile karşılaştırıldığında 75 ve 150 µmol foton m-2 sn-1’de önemli derecede daha yüksekti.
Havalandırma için ise optimum üzeri şiddetler büyümeyi azaltıp, hücre çapı ve pigment içeriğini artırırken, optimum hava akış hızı 1 lpm olarak bulundu. Bu nedenle, optimum üzeri havalandırma yapılması, H. pluvialis hücrelerinin kırmızılaştırma safhasında ikincil bir stres faktörü olarak rol oynayabilir.
378
problematic part due to the slow growth rate, low cell concentration and susceptibility to contamination (Lee and Zhang, 1999). With this respect, optimization of the culture medium is necessary to support higher cell productivities.
There are several reports on the optimization of culture medium in Haematococcus, but most of them mainly focused on the optimum concentration of KNO3 and NaNO3 (Borowitzka et al., 1991; Fabregas
et al., 2000; Gong and Chen, 1997; Orosa et al., 2005). The others such as urea and ammonium salts have not been studied enough. Besides, vitamins have been reported to be another important component increasing the productivity of vegetative
Haematococcus cultures (Fabregas et al., 2000; Kaewpintong et al., 2007). However, no comprehensive study has been performed to find out the optimum levels of the vitamins in batch cultures.
The drawbacks in vegetative cultures of
Haematococcus are mostly related to the low specific growth rate and the lack of a selective growth medium. Although vitamins and airflow rate are important in H. pluvialis (Pringsheim, 1966), they have not been studied adequately for batch
Haematococcus sp. cultures. In the present study, the effects of various nitrogen compounds, light intensities, aeration rates and especially vitamins were investigated to improve the vegetative growth of batch H. pluvialis (strain 5/99) cultures.
Materials and Methods
Organism and Culture Conditions
The unialgal cultures of Haematococcus pluvialis (strain 5/99) was obtained from the culture collection of the CNR-Istituto per lo Studio degli Ecosistemi of Florence (Italy). The stock cultures were grown phototrophically in standard BG11 medium containing 1.5 g/L NaNO3 (Rippka et al., 1979). Unless specified otherwise, the experiments were carried out in 1 L cylindrical glass bottles (10 cm in diameter) with BG11 medium, and illuminated continuously with daylight fluorescent lamps at a photon flux density (PFD) of 75 µmol photons m-2 s-1. The cells were grown in batch cultures and aerated by bubbling air under constant temperature at 250.5°C. Photosynthetically active radiation (PAR) was measured with a LI-250A light-meter (Li-Cor, USA).
Test of Nitrogen Sources
The nitrogen sources (NS) tested were NaNO3, KNO3, NH4NO3 and Urea. BG11 medium was basis for all the groups, and NaNO3 in original recipe was replaced with the other NS. Accordingly, four concentrations were applied to each source, e.g., 0.25, 0.50, 1.00 and 2.00 g/L. In addition to the four concentrations, the effect of 0.1 g/L was also examined in NaNO3 and Urea groups. After the
groups were pre-cultivated for 5 days with 0.5 g/L of target NS, the cells in log phase were centrifuged at 3000 rpm and re-suspended in the new concentrations of NS. NaNO3, KNO3 and NH4NO3 groups were carried out 14 days, while Urea group was ended on the 13th day. The pH values of the cultures were not modified except for the ammonium group. While NH4-N nutrition results in a release of H+, which cause the pH level to decline dramatically, nitrate nutrition leads to pH increase in the medium (Mengel
et al., 1983). NaOH solution (1 M) was dropped into the ammonium groups twice a day to keep the pH above 7.0.
Optimum Levels for Vitamins
The vitamins used in the experiment during 13 days were thiamin (Vit B1), biotin (Vit H) and cyanocobalamin (Vit B12). While determining the range of the vitamins in the experiment, the previous studies were taken into consideration. Accordingly, four concentrations were arranged for thiamin (0.01, 0.1, 1.0 and 10.0 mg/L), biotin and Vit B12 (0.001, 0.01, 0.1 and 1.0 mg/L).
The Effect of Light and Aeration
The effect of light intensity on productivity was investigated by the exposure of the groups to four PFDs, e.g., 20, 40, 75 and 150 µmol photons m-2 s-1. The cultures were mixed by bubbling air of 0.5, 1.0 and 2.0 lpm, which were adjusted by Hosco flow meter (Honsberg Instruments GmbH, Germany). The trials were conducted during 13 and 12 days to see the effects of light and aeration rate respectively.
Analytical Procedures
For dry weight (DW) measurements, 25 ml sample was filtered through a dried and pre-weighed GF/C Whatman filter papers (Whatman, Maidstone, UK) in duplicate. DWs were calculated in mg/Lafter the filtrates were dried in an oven at 80 °C overnight. Total chlorophyll (chlorophyll a + b) and carotenoids were found spectrophotometrically according to Lichtenthaler (1987). The motile cells and palmella were counted in an improved Neubauer haemocytometer by triplicate samples. Growth rate (µ) was calculated on cell basis according to the equation below:
1 2
1 2
1 ln ln
) (
t t
X X day
µ
379
Results
In the first step, the effect of NaNO3, KNO3, NH4NO3 and urea on growth of Haematococcus pluvialis cells were tested. The highest dry weight (DW) was achieved in NH4NO3 group whereas the lowest group was urea, and the DW levels decreased with increasing concentrations of nitrogen source (NS) in both groups (Figure 1A). In NaNO3 group, however, DW increased in parallel with the concentrations, i.e., DW was found 1125±67 mg/L in 2.0 g/L group. As for KNO3, maximum DW was 1190±46 mg/L in 0.5 g/L concentration (Figure 1A).
The highest cell numbers at the end of the trials (14th day) for NaNO3 (1.0 g/L), KNO3 (0.5 g/L), NH4NO3 (2.0 g/L) and on the 10th day for urea group (0.25 g/L) were counted to be 25.3±2.5, 26.3±1.9, 20.4±2.4 and 17.4±1.8x10⁴ cells/ml respectively
(Figure 1B). In addition to the four concentrations, 0.1 g/L was also included in urea application since the cell count increased from 17.4±1.8 in 0.25 g/L to 18.4±2.0x10⁴ cells/ml in 0.1 g/L concentration (data not shown). The levels of volumetric chlorophyll, carotenoids and cell diameters are the important parameters to evaluate the physiological state of
Haematococcus cultures. Destruction of chlorophyll molecules, accumulation of carotenoids and enlargement of the cells are the indications of cell stress. Volumetric chlorophyll amounts, which were measured on the days that maximum cell counts were reached, were also in the same pattern as cell counts except for KNO3 group, in which maximal chlorophyll a+b amount was attained in 1.0 g/L concentration (Figure 1C). Carotenoid contents in the groups were higher in lower NS concentrations (Figure 1D). The type of NS affected cell diameter as
380
well. Mean cell diameters for NaNO3, KNO3, NH4NO3 and urea groups were measured to be 28.9±0.8, 29.7±0.9, 36.3±0.9 and 33.8±0.4 µm respectively.
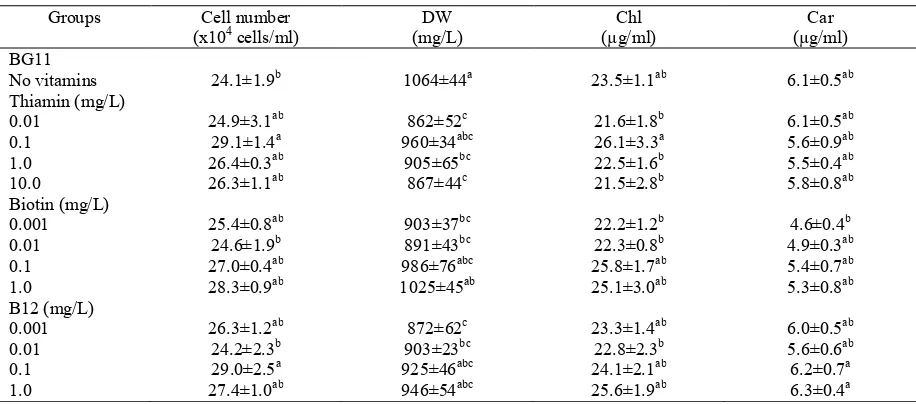
In the second step, the effects of three vitamins, namely thiamin, biotin and B12, were examined. Each vitamin supported the cell number and the dry weights dropped significantly (P<0.05) compared to standard BG11 medium without vitamins (Table 1). The mean cell diameters of thiamin, biotin and B12 were 26.9±0.3, 27.1±0.4 and 26.1±0.2 µm respectively at the end of the trials, which were significantly lower than that of standard BG11 medium (P<0.05). Similarly, mean cell weights for the groups were lower and found to be 3.36±0.08, 3.60±0.04 and 3.42±0.23 ng/cell respectively compared to 4.43±0.68 ng/cell in standard BG11 medium. The highest cell counts for thiamin, biotin and B12 were achieved in 0.1 (0.3 µM), 1.0 (4 µM) and 0.1 mg/L (0.75 µM) concentrations respectively (Table 1). Specific growth rates in these groups (0.26 division d-1) were higher than the control group
without vitamins (0.22 division d-1). In addition, the cells did not further increase even if all the vitamins were present in the growth medium at optimal concentrations (Figure 2).
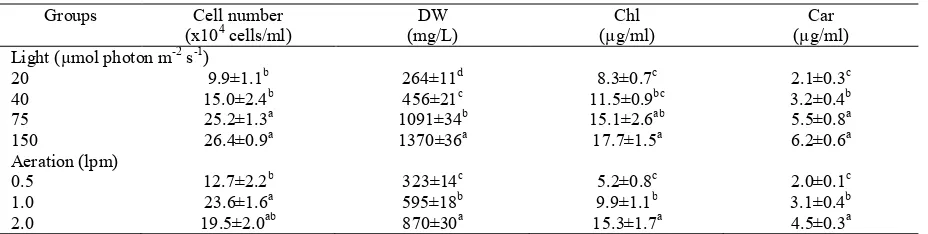
Among the light intensities tested, the cell concentrations in 75 and 150 µmol groups were significantly higher than those in 20 and 40 µmol groups (P<0.05). Specific growth rates were found to be 0.18±0.01, 0.21±0.03, 0.25±0.02 and 0.25±0.01 division d-1 for 20, 40, 75 and 150 µmol groups respectively. Furthermore, DW, chlorophyll a + b and carotenoids increased in correlation with the light intensity applied (Table 2). As for aeration, the highest cell count was achieved by 1.0 lpm. Accordingly, specific growth rates were 0.21±0.02, 0.26±0.01 and 0.25±0.02 division d-1 for 0.5, 1.0 and 2.0 lpm air flow rates. However, the cells were enlarged by higher airflow rates and consequently, DW, chlorophyll a+b and carotenoids in the cells increased (Table 2), i.e., mean cell diameters for 0.5, 1.0 and 2.0 lpm were 23.1±0.5, 26.3±0.4 and 29.7±0.7 µm respectively.
Table 1. Effect of vitamins on cell number, dry weight (DW), chlorophyll a + b (Chl) and carotenoids (Car) of H. pluvialis
Groups Cell number (x104 cells/ml)
DW (mg/L)
Chl (µg/ml)
Car (µg/ml) BG11
No vitamins 24.1±1.9b 1064±44a 23.5±1.1ab 6.1±0.5ab Thiamin (mg/L)
0.01 24.9±3.1ab 862±52c 21.6±1.8b 6.1±0.5ab
0.1 29.1±1.4a 960±34abc 26.1±3.3a 5.6±0.9ab 1.0 26.4±0.3ab 905±65bc 22.5±1.6b 5.5±0.4ab
10.0 26.3±1.1ab 867±44c 21.5±2.8b 5.8±0.8ab Biotin (mg/L)
0.001 25.4±0.8ab 903±37bc 22.2±1.2b 4.6±0.4b 0.01 24.6±1.9b 891±43bc 22.3±0.8b 4.9±0.3ab 0.1 27.0±0.4ab 986±76abc 25.8±1.7ab 5.4±0.7ab 1.0 28.3±0.9ab 1025±45ab 25.1±3.0ab 5.3±0.8ab B12 (mg/L)
0.001 26.3±1.2ab 872±62c 23.3±1.4ab 6.0±0.5ab 0.01 24.2±2.3b 903±23bc 22.8±2.3b 5.6±0.6ab 0.1 29.0±2.5a 925±46abc 24.1±2.1ab 6.2±0.7a 1.0 27.4±1.0ab 946±54abc 25.6±1.9ab 6.3±0.4a Means with different superscripts in the columns are significantly different at P< 0.05
381
Discussion
In commercial astaxanthin production from H. pluvialis, vegetative cultivation of the cells plays an important role. In some studies, different strengths of a growth medium were studied (Garcia-Malea et al., 2005). In addition, there are some other studies investigating the effect of different NS. Harker et al. (1995) used relatively low concentrations of NS, e.g., 1.2 mM of NaNO3 (0.10 g/L), KNO3 (0.12 g/L), NaNO2 (0.08 g/L), NH4Cl (0.06 g/L) and urea (0.07 g/L), and the growth was arranged as urea > NaNO3 > KNO3 > NaNO2 > NH4Cl. Similarly, the growth of 0.10 g/L urea was better than 0.10 g/L NaNO3 in our study, in which the order of the NS changed with higher concentrations. In addition, the researchers concluded that low growth of NH4Cl was related to pH fluctuation. Cifuentes et al. (2003) cultivated H. pluvialis cells with 2.9 mM of NaNO3 (0.25 g/L), NH4Cl (0.16 g/L) and urea (0.17 g/L) in 500 ml flasks under 35 and 85 µmol photons m-2 s-1 light intensities. In NH4Cl culture, pH was kept in the range of 5.0-6.0 by NaOH solution. The highest cell counts were found to be 17 x 104 (35 µmol), 25 x 104 (85 µmol) and 5.2x10⁴ cells/ml (35 µmol) for the NS groups respectively. As can be seen, growth was arranged on the opposite way by a slight increase in the concentrations of NS. The level of pH dramatically decreases when NH4 compounds are used as NS due to the H+ released in the medium (Mengel et al., 1983). In our experiment, sudden pH drops were observed especially for the first 5 days and then the pH tended to increase. In addition, the strength of the acidifying was related to the concentration of the ammonium salt. Therefore, the pH fluctuations in higher concentrations were more critical for the cells. With this respect, the growth of 2.0 g/L NH4NO3 group in this 5 day period was suppressed stronger compared to the lower concentrations. In our view, a pH-controller would be very useful to prevent the fluctuations in pH, and consequently to minimize the stress on the cells.
In NaNO3 optimization, the study of Dominguez-Bocanegra et al. (2004) concurred with
our findings and the cells reached at 27.3x10⁴ cells/ml in BG11 medium under 177 µmol photons m-2 s-1. In another study, Harker et al. (1996) used 0.75 mM (0.06 g/L), 1.5 mM (0.13 g/L), 3.0 mM (0.25 g/L) and 6.0 mM (0.5 g/L) NaNO3 concentrations in Bold’s Basal Medium under 35 µmol photons m-2 s-1. Accordingly, the highest cell numbers were attained in 0.25 and 0.5 mg/L groups between 20th and 30th days. In our experiment, however, the cell number of 0.5 mg/L was significantly higher than that of 0.25 mg/L (P<0.05). In our opinion, this confliction aroused from the lower light intensity used in the study of Harker et al. (1996). The cells in 0.25 g/L NaNO3 showed the same growth as 0.5 g/L under 35 µmol photons m-2 s-1 without N-limitation due to the lower photosynthesis rate.
Another NS commonly used in H. pluvialis
culture is KNO3. Borowitzka et al. (1991) reported that maximal cell density with KNO3 is achieved in the range of 0.5-1.0 g/L. In the same way, Gong and Chen (1997) and Fabregas et al. (2000) were found the optimal KNO3 concentrations to be 0.37 and 0.41 g/L respectively, which are close to our finding of 0.5 g/L. In urea application, however, the best growth was achieved in the lowest urea concentration (0.1 g/L) since the higher concentrations inhibited the growth. It can be concluded that the strain H. pluvialis (5/99) used in the experiment is not suitable for urea nutrition.
Various studies report that vitamins are effective in vegetative H. pluvialis cultures. Pringsheim (1966) expressed that thiamin among the vitamins is a growth factor for H. pluvialis. Kaewpintong et al. (2007) reported that optimal B12 concentration was 12 µg/L. In the study of Fabregas et al. (2000), in which optimum Haematococcus medium (OHM) in a continuous culture was investigated, optimal vitamin levels for thiamin, biotin and B12 were found to be 0.017, 0.025 and 0.015 mg/L respectively. Correspondingly, the use of vitamins in our batch cultures increased the cell number approximately 15% and optimum levels were 0.1, 1.0 and 0.1 mg/L among the levels tested respectively. On the contrary, there is another report claiming H. pluvialis attain
Table 2. Effect of light (13th day) and aeration (12th day) on cell number, dry weight (DW), chlorophyll a + b (Chl) and
carotenoids (Car) of H. pluvialis
Groups Cell number (x104 cells/ml)
DW (mg/L)
Chl (µg/ml)
Car (µg/ml) Light (µmol photon m-2 s-1)
20 9.9±1.1b 264±11d 8.3±0.7c 2.1±0.3c
40 15.0±2.4b 456±21c 11.5±0.9bc 3.2±0.4b 75 25.2±1.3a 1091±34b 15.1±2.6ab 5.5±0.8a 150 26.4±0.9a 1370±36a 17.7±1.5a 6.2±0.6a Aeration (lpm)
0.5 12.7±2.2b 323±14c 5.2±0.8c 2.0±0.1c
1.0 23.6±1.6a 595±18b 9.9±1.1b 3.1±0.4b
2.0 19.5±2.0ab 870±30a 15.3±1.7a 4.5±0.3a
382
higher cell densities without vitamins (Gong and Chen, 1997), in which the growth was assessed in terms of DW. Indeed, the results of our study based on DW were similar to that of Gong and Chen (1997). Although the cell counts in the cultures supplemented with vitamins were higher, DW was much lower compared to standard BG-11 medium (Table 1). The use of vitamins supported cells to divide and mean cell diameter, consequently, cell weight dropped from 4.43±0.68 to 3.36±0.08 ng/cell in thiamin group. It was also seen in our study that low concentrations of the vitamins were efficient but it was not mandatory to use all of the vitamins together, i.e., thiamin alone was sufficient to achieve an increase as high as the others on the growth (about 15%) as reported by Pringsheim (1966).
In light trial, chlorophyll content of the cells declined with increasing light (data not shown), while volumetric chlorophyll increased (Table 2). This is normal since dimensions of light harvesting antenna lessen and cellular chlorophyll components come to minimum as a result of photoacclimation of microalgal cells to high light (Falkowski, 1980).
There is not enough study on the effect of aeration in H. pluvialis cultures. In our study, the cultures were carried out in 1 L cylindrical glass bottles and optimum airflow was 1.0 vvm. Similarly, the airflow rate of 1 vvm was used in many studies (Chen et al., 1997; Garcia-Malea et al., 2006). Vega-Estrada et al. (2005), however, expressed that cell density in a 2 L air-lift photobioreactor was decreased by the airflows above 0.5 vvm. In our view, the airflow in the study was calculated using total volume of the system (2 L) instead of the volume of riser column, so the researchers actually reached a much lower airflow rate than it was. Consequently, the cells were exposed to a much higher turbulence and damaged in this narrow riser tube. On the other hand, amounts of chlorophylls and carotenoids in the cells increased with higher airflows in our experiment. It was seen that supra-optimum levels of aeration ceased the growth and cell diameter increased (Table 2). With this respect, it may be used as a secondary stress factor beside the main ones such as high-light and N-limitation after the vegetative stage.
Acknowledgements
This research was supported by the Scientific and Technological Research Council of Turkey (TÜBİTAK), Project No: TOVAG 104V060.
References
Aflalo, C., Meshulam, Y., Zarka, A. and Boussiba, S. 2007. On the relative efficiency of two vs. one-stage production of astaxanthin by the green alga
Haematococcus pluvialis. Biotechnol. Bioeng., 98: 300–305. DOI: 10.1002/bit.21391.
Borowitzka, M.A., Huisman, J.M. and Osborn, A. 1991.
Culture of the astaxanthin-producing green alga
Haematococcus pluvialis. 1. Effects of nutrients on growth and cell type. J. Appl. Phycol., 3: 295–304. DOI: 10.1007/BF00026091.
Chen, F., Chen, H. and Gong, X. 1997. Mixotrophic and heterotrophic growth of Haematococcus lacustris and rheological behaviour of the cell suspensions. Bioresource Technol., 62: 19–24. DOI: 10.1016/S09 60-8524(97)00115-6.
Christiansen, R., Lie, O. and Torrissen, O.J. 1995. Growth and survival of Atlantic salmon, Salmo salar L., fed different dietary levels of astaxanthin. First-feeding fry. Aquacult. Nutr., 1: 189–198. DOI: 10.1111/ j.1365-2095.1995.tb00043.x.
Cifuentes, A.S., Gonzalez, M.A., Vargas, S., Hoeneisen, M. and Gonzalez, N. 2003. Optimization of biomass, total carotenoids and astaxanthin production in
Haematococcus pluvialis Flotow strain Steptoe (Nevada, USA) under laboratory conditions. Biol. Res., 36: 343–357. DOI: 10.4067/S0716-976020 03000300006.
Dominguez-Bocanegra, A.R., Guerrero Lagarreta, I., Martinez Jeronimo, F. and Tomasini Compocosio, F. 2004. Influence of environmental and nutiritional factors in the production of astaxanthin from
Haematococcus pluvialis. Bioresource Technol., 92: 209–214. DOI: 10.1016/j.biortech.2003.04.001. Fabregas, J., Dominguez, A., Regueiro, M., Maseda, A. and
Otero, A. 2000. Optimization of culture medium for the continuous cultivation of the microalga
Haematococcus pluvialis. Appl. Microbiol. Biotechnol., 53: 530–535.
Fabregas, J., Otero, A., Maseda, A. and Dominguez, A. 2001. Two-stage cultures for the production of astaxanthin from Haematococcus pluvialis. J. Biotechnol., 89: 65–71. DOI: 10.1016/S0168-1656 (01)00289-9
Falkowski, P.G. 1980. Light-shade adaptation and vertical mixing of marine phytoplankton. In: P.G. Falkowski (Ed.), Primary Productivity in the Sea, Plenum, New York: 99–117. DOI: 10.1357/002224083788520199. Garcia-Malea, M.C., Brindley, C., Del Rio, E., Acien, F.G.,
Fernandez, J.M. and Molina, E. 2005. Modelling of growth and accumulation of carotenoids in
Haematococcus pluvialis as a function of irradiance and nutrients supply. Biochem. Eng. J., 26: 107–114. DOI: 10.1016/j.bej.2005.04.007
Garcia-Malea, M.C., Acien, F.G., Fernandez, J.M., Ceron, M.C. and Molina, E. 2006. Continuous production of green cells of Haematococcus pluvialis: Modelling of the irradiance effect. Enzyme Microb. Tech., 38: 981– 989. DOI: 10.1016/j.enzmictec.2005.08.031. Gong, X. and Chen, F. 1997. Optimization of culture
medium for Haematococcus pluvialis. J. Appl. Phycol., 9: 437-444. DOI:10.1023/A:1007944922264. Guerin, M., Huntley, M.E. and Olaizola, M. 2003.
Haematococcus astaxanthin: applications for human health and nutrition. Trends Biotechnol., 21: 210–216. DOI: 10.1016/S0167-7799(03)00078-7.
Harker, M., Tsavalos, A.J. and Young, A.J. 1995. Use of response surface methodology to optimise carotenogenesis in the microalga, Haematococcus pluvialis. J. Appl. Phycol., 7: 399–406.
383
Technol., 55: 207-214. DOI: 10.1016/0960-8524(95) 00002-X.
Inborr, J. 1998. Haematococcus, The poultry pigmentor. Feed Mix., 6: 31–34.
Kaewpintong, K., Shotipruk, A., Powtongsook, S. and Pavasant, P. 2007. Photautotrophic high-density cultivation of vegetative cells of Haematococcus pluvialis in airlift bioreactor. Bioresource Technol., 98: 288–295. DOI: 10.1016/j.biortech.2006.01.011. Kobayashi, M. and Sakamoto, Y. 1999. Singlet oxygen
quenching ability of astaxanthin esters from the green algae Haematococcus pluvialis. Biotechnol. Lett., 21: 265–269. DOI: 10.1023/A:1005445927433.
Lee, Y.-K. and Soh, C.-W. 1991. Accumulation of astaxanthin in Haematococcus lacustris
(Chlorophyta). J. Phycol., 27: 575–577. DOI: 10.1111/j.0022-3646.1991.00575.x.
Lee, Y.-K. and Zhang, D.-H. 1999. Production of astaxanthin by Haematococcus. In: Z. Cohen (Ed.), Chemicals from Microalgae, Taylor and Francis, London: 173–190.
Lichtenthaler, H.K. 1987. Chlorophylls and carotenoids: pigments of photosynthetic membranes. Methods Enzymol., 148: 349-382. DOI: 10.1016/0076-6879 (87)48036-1.
Mengel, K., Robin, P. and Salsac, L. 1983. Nitrate reductase activity in shoots and roots of maize seedlings as affected by the form of nitrogen nutrition and the pH of the nutrient solution. Plant Physiol., 71: 618–622. Orosa, M., Franqueira, D., Cid, A. and Abalde, J. 2005.
Analysis and enhancement of astaxanthin
accumulation in Haematococcus pluvialis. Bioresource Technol., 96: 373–378. DOI: 10.1016/ j.biortech.2004.04.006
Pringsheim, E.G. 1966. Nutritional requirements of
Haematococcus pluvialis and related species. J. Phycol., 2: 1–7. DOI: 10.1111/j.1529-8817.1966. tb04584.x.
Rippka, R., Deruelles, J.B., Herdman, M., Waterbury, B. and Stanier, R.Y. 1979. Generic assignments, strain history and properties of pure cultures of Cyanobacteria. J. Gen. Microbiol., 111: 1–61. Torzillo, G., Goksan, T., Faraloni, C., Kopecky, J. and
Masojidek, J. 2003. Interplay between photochemical activities and pigment composition in an outdoor culture of Haematococcus pluvialis during the shift from the green to red stage. J. Appl. Phycol., 15: 127– 136. DOI: 10.1023/A:1023854904163.
Vega-Estrada, J., Montes-Horcasitas, M.C., Domínguez-Bocanegra, A.R. and Canizares-Villanueva, R.O. 2005. Haematococcus pluvialis cultivation in split-cylinder internal-loop airlift photobioreactor under aeration conditions avoiding cell damage. Appl. Microbiol. Biotechnol., 68: 31–35. DOI: 10.1007/ s00253-004-1863-4.