Dynamic Stability Analysis of the Hybrid System
Designed for Ocean Thermal Energy Conversion and
Thermal Power Plant
Mohammad Ali Azghandi
Department of Electrical,
Islamic Azad University Gonabad Branch, Gonabad, Iran
Javad Rouhi
Department of Electrical,
Mazandaran University of Science and Technology, Iran
Abstract – Oceanic Thermal Energy Conversion (OTEC) is
a method for generating electricity by taking advantage of the small temperature difference between warm surface water and cold deep ocean water. In the present research, we have studied and assessed dynamic stability and performance simulation of an OTEC power plant whose thermal efficiency has been improved by absorbing the thermal energy of the steam input to the condenser of a thermal power plant which should be discharged through cooling water. The mathematic models of the system have been developed based on its thermodynamic properties as well as on the structure of its power cycle so that it has become possible to carry out dynamic simulation and assessment on the system. The proposed systems are potentially able to increase the net thermal efficiency, and at the same time, reduce the thermal pollution created. Dynamic equations of the systems under study have been developed in the conditions created by equilibrium between three phases. Transient response of the hybrid system with the thermal power plant to disturbances such as sudden changes in load and short-circuit fault has been evaluated. Results indicate suggest that increase in thermal productivity of the system cause system to have desirable steady state and transient performance.
Keywords – Oceanic Thermal Energy, Renewable Energy,
System Dynamic, Power System Stabilizer.
I.
I
NTRODUCTIONConcerns over environmental damages, depletion of fossil fuel resources and rising demand for electric energy have caused the development of renewable energy technologies and commercialization of them to be the center of attention worldwide. These have led scientists and policy-makers to develop commercial-scale technologies that can commercially replace the existing energy production infrastructures. Given the volume of oceans and their relatively constant day-by-day temperature difference, OTEC can be a great source of energy in many coastal communities. It can be also considered as a base energy resource [1-3]. Furthermore, it may be used for production of fresh water and nutrient materials [4].
Nonetheless, a relatively small number of research and development has been done on boom in renewable energy. Regarding the OTEC, it depends upon several factors including too much investment cost due to huge equipment and expensive heat exchangers. The reference [5] has recommended the simulation and assessment of transient performance of a pilot OTEC plant using a mixture of ammoniac and water as process fluid. Considering such parameters as tube diameter, depth of
The present article develops a dynamic simulated model of an OTEC power plant whose thermal efficiency has been already improved. The model is suitable to be used for simulation of transient mode of an OTEC system combined with a thermal power plant connected to a network. The complete model of the system has been achieved considering the dynamic of ach subsystems as well as their internal communications.
II.
C
ONFIGURATION OF THES
YSTEM UNDERS
TUDYFigure 1 shows the block diagram of a closed-cycle system consisting of an evaporator and a condenser. Because of its low boiling point, ammonia is generally used as operational fluid. Surface water may be considered as a heat source serving as an operator for evaporation of ammonia liquid. Temperature difference between evaporator and condenser leads to pressure difference causing ammonia vapor to stimulate the turbine blades. Turbine shaft is also coupled with the generator via a gearbox, and the electric power generated by the SG is delivered to the network through transmission lines.
One degree increase in temperature difference of the system power cycle cause around 10 percent increase in electricity generation by OTEC. In order to make the performance of the power plant stable, an appropriate heat resource is needed, which meanwhile makes it an obstacle to operation of OTEC projects. In order to overcome the small temperature difference especially in winter, of thermal power plants’ discharge can be a useful heat
resource. This defines such a system as reducing thermal pollution. To make use of the aforementioned thermal energy, the outlet of the power plant condenser should be coupled with the inlet of the OTEC system operator [15]. Size of an OTEC power plant depends upon rate of thermal discharge and the act of receiving deep sea water. Direct thermal discharge through operator and OTEC condenser may be of lower temperature than natural coastal waters. However, in order to prevent such a phenomenon, warm and cold waters can be mixed thus making the process of temperature control happen.
Turbine
GS
Generator
Condenser Evaporator
Warm Sea Water Pump
Cold Sea Water Pump
Fig.1. Block diagram of a closed-cycle OTEC system
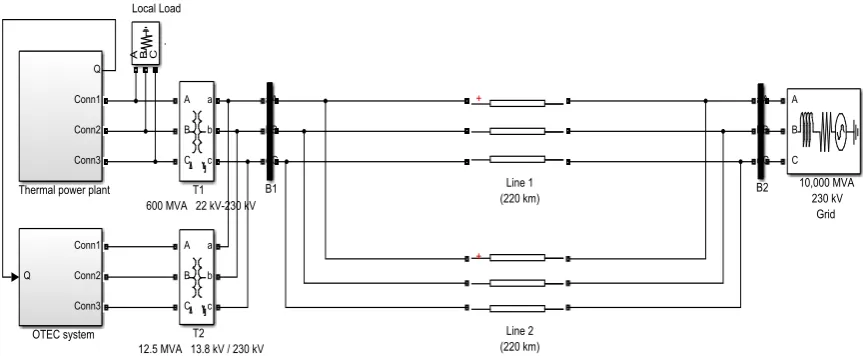
Fig.2. OTEC hybrid System and the thermal power plant connected to the network
A. Heat Conversion System
Heat exchanger should absorb the heat, and then transfer the heat absorbed to the surface water. The equation related to the heat exchanger is presented as following [16]:
Mw is mass of the fluid existing in the heat exchanger in kilogram, Cw water specific heat capacity in J/kg.
0 c, Tstm average temperature of the output of the heat exchanger in 0c, q thermal power absorbed by the water in kw, U
Fig.3 shows the OTEC hybrid thermal energy conversion system and the power plant.
Condenser
Surface seawater Steam Turbine
GS
Generator
Boiler
Steam Plant
OTEC Plant
Fig.3. Process diagram of cooling water for the power plant
In the system, heat exchangers transfer the heat power q from the vapor of the fluid input to the power plant condenser to the next cycle fluid with the following equation:
q = m.c. cc (Tin – Tout) (2)
Where
̇c ,cc, Tin and Tout are mass flow, thermal capacity, input temperature, and output temperature of the fluid within the condenser in kg/s,J/kg.0c, and 0c, respectively.
B) Energy Conversion System
Energy conversion equation for the system under study is shown below. Inputs into the equation are mass flow of the surface water ̇w and the average output temperature of the heat exchanger Tstm [13]:
Pnet = ̇
[(Tstm-Tc) 2 – 0.3(∆Tdesign) 2] (3) Where
Pnet(w) is net power, ρ(kg/m3) average density of water, and η ratio of the mass flow of cold water to that of warm water. In this process, Tc(0c) and ∆Tdesign are temperature of cold water and temperature difference for the design under in question, respectively. Total loss in pumps are estimated in the energy conversion system.
C) Turbine - Governor System
Properties of the turbine under study are specified with respect to the operational fluid which has low pressure flow as well as relatively high mass flow. Figure 4 shows the block diagram for the without steam feedback type of turbine-governor model (e.g. Westinghouse without steam feedback).
Fig.4. Block diagram for the turbine-governor model used in this study Since output mechanical power of the turbine can be
affected by the mass flow of warm water, suitable adjustment to it may provide the essential requirements of the synchronous generator. Figure 5 shows the block diagram of the controller of the war water mass flow. The difference existing between mechanical power feedback signal PM(pu) and the reference value PM0(pu) is transmitted to the controller inlet so that it would be able to adjust the mass flow of warm water appropriately. The differential equation corresponding to the figure 5 can be stated as follows [13]:
(TTEM). ( ̇ω∆) = KTEM. PM∆ - ̇ω∆ (4) Where
PM∆ is deviation of per unit mechanical power of turbine, ̇ω∆ deviation of the warm water mass flow, KTEM controller gate, and TTEM temporal constant of the controller in second. The parameter ̇ω0 shown in the
figure is the per unit value of the constant mode of the warm water mass flow.
Fig.5. Block diagram for the controller of the fluid mass flow
D) Stimulation System
Fig.6. Block diagram for the stimulation system including PID PSS
III.
S
IMULATION OF THES
YSTEMD
YNAMICR
ESPONSEIn this section, we evaluate the characteristics of the steady state mode and the transient response of the system in question to various turbulences such as sudden load shedding or short circuit fault. Characteristics of the system under study are as follows:
Table 1: Characteristics of the 10 Megawatt OTEC system combined with a 500 megawatt thermal power plant [20] Tw, temperature of surface water 26 0c Tc, temperature of deep cold water 40c
̇w, mass flow of warm water 25 m3/s
̇c, mass flow of cold water 25 m3/s d, diameter of cold water tube 2 m As, surface area of heat exchanger 1000 m2 q, thermal power of the 500 megawatt
power plant condenser in apparent load
53.5 Mw
The set is a combination of a thermal power plant and a thermal energy conversion system. The thermal power plant has a synchronous generator with the apparent values of 600 megavolt-ampere, 22 kilovolt terminal voltage, 60 hertz frequency, and 3600 RPM velocity. The OTEC power plant is equipped with a generator with apparent values of 12.5 megavolt-ampere power, 13.8 kilovolt terminal voltage, 60 hertz frequency, and 1800 RPM velocity. The 600 megavolt ampere generator also supplies a 50 megawatt local load. The two generators are paralleled to each other via two transformers and connected to the 230 kilovolt power network through two transmission lines. Time constants of the heat exchangers and ammoniac pump are 6 and 3 second, respectively [20].
A) Dynamic Response of the system to the sudden
change in the system load
Change in load is made in the 20th second so that the 50
a) Mass flow of warm water
b) Temperature of warm water
c) Mechanical power of the OTEC system
15 20 25 30 35 40 45 50 55
0.983 0.984 0.985 0.986 0.987 0.988 0.989 0.99 0.991 0.992
time (s)
m'
w
(
p
u
)
15 20 25 30 35 40 45 50 55
26.374 26.376 26.378 26.38 26.382 26.384 26.386 26.388
time (s)
T
st
m
(
oc
)
0.826 0.827 0.828 0.829 0.83 0.831
P
n
et
(
p
u
d) Thermal power of the condenser
e) Mechanical velocity of the 500 megawatt generator
f) Mechanical velocity of the 10 megawatt generator
g) Power of the 500 megawatt power plant
h) Power of the 10 megawatt power plant
i) Bus voltage
j) Reactive power of the 500 megawatt generator
k) Reactive power of the 10 megawatt generator
Fig.7. Response of the system to sudden change in load of the OTEC system combined with the thermal power plant The simulations indicated that in addition to having desirable characteristics in its steady state mode, the system has maintained its stability after the load has been removed. Change in the thermal power absorbed from the condenser due to the control of the valve of the steam chamber, temperature of the warm water and thus the net produced mechanical power both are changed. The water mass flow controller works in a way that changes in water flow reduce the mentioned effects.
B) Transient response of the system to the short
circuit fault
In this section, it is assumed that a three-phase short circuit fault is occurred in the middle of parallel transmission lines at the 15th second, and the transmission line is removed after 7 cycles have been done. The transient response of the system is presented in figure 8.
15 20 25 30 35 40 45 50 55
52.4 52.6 52.8 53 53.2 53.4 53.6 53.8 time (s) Qc ( M W )
15 20 25 30 35 40 45 50 55
0.9975 0.998 0.9985 0.999 0.9995 1 1.0005 1.001 1.0015 1.002 time (s) Wm t ( p u )
15 20 25 30 35 40 45 50 55
0.998 0.9985 0.999 0.9995 1 1.0005 1.001 1.0015 1.002 1.0025 time (s) Wm o ( p u )
15 20 25 30 35 40 45 50 55
0.76 0.78 0.8 0.82 0.84 0.86 0.88 time (s) Pg t ( p u )
15 20 25 30 35 40 45 50 55
0.76 0.77 0.78 0.79 0.8 0.81 0.82 0.83 0.84 0.85 0.86 time (s) Pg o ( p u )
15 20 25 30 35 40 45 50 55
0.975 0.98 0.985 0.99 0.995 1 1.005 1.01 1.015 1.02 1.025 time (s) V t (p u )
15 20 25 30 35 40 45 50 55
0.12 0.13 0.14 0.15 0.16 0.17 0.18 0.19 0.2 0.21 time (s) Qg t ( p u )
15 20 25 30 35 40 45 50 55
a) Mass flow of warm water
b) Temperature of warm water
c) Mechanical velocity of the 500 megawatt generator
d) Mechanical velocity of the 10 megawatt generator
e) Power of the 500 megawatt generator
f) Power of the OTEC system
g) Thermal power of the condenser
h) Bus voltage
i) Reactive power of the 500 megawatt generator
10 15 20 25 30 35 40 45 50
0.985 0.99 0.995 1 1.005 1.01 1.015 1.02 1.025
time (s)
m'
w
(
p
u
)
10 15 20 25 30 35 40 45 50
26.25 26.255 26.26 26.265 26.27 26.275 26.28 26.285 26.29
time (s)
Tst
m
(
oc
)
10 15 20 25 30 35 40 45 50
0.98 0.985 0.99 0.995 1 1.005 1.01 1.015 1.02 1.025
time (s)
Wm
t
(
p
u
)
10 15 20 25 30 35 40 45 50
0.98 0.985 0.99 0.995 1 1.005 1.01 1.015
time (s)
Wm
o
(
p
u
)
0.8 1 1.2 1.4 1.6
Pg
t
(
p
u
)
10 15 20 25 30 35 40 45 50
0.2 0.4 0.6 0.8 1 1.2 1.4 1.6
time (s)
Pg
o
(
p
u
)
10 15 20 25 30 35 40 45 50
36 36.5 37 37.5 38 38.5 39 39.5
time (s)
Q
c
(M
W
)
10 15 20 25 30 35 40 45 50
0.2 0.4 0.6 0.8 1 1.2 1.4 1.6
time (s)
Vt
(
p
u
)
10 15 20 25 30 35 40 45 50
-0.5 0 0.5 1 1.5 2 2.5
time (s)
Qg
t
(
p
u
j) Reactive power of the 500 megawatt generator
Fig.8. response of the hybrid system of OTEC and thermal power plant to the three-phase short circuit fault in the
transmission line
The results indicate that the hybrid system has a desirable stable performance in such circumstances. Temperature of warm water and thus produced mechanical power are changed proportional to the heat received from the condenser while the changes in water mass flow are made towards reduction of these effects. Although the duration of fluctuations is shorter, it has a larger domain in such condition.
Fig.9. relationship between changes in temperature of warm water relative to the changes in thermal power of the
condenser
Fig.10. Relationship between changes in net produced mechanical power relative to the changes in temperature
of surface warm water
The following curves show that temperature of the warm surface water is almost increased linearly and proportional to the change in the heat received from condenser. So, change in steam valve from zero to its apparent value cause its temperature to be increased by around 0.40 centigrade. Furthermore, the net produced mechanical power is increased proportional to temperature. In order to have net output power in this
system, it is necessary to make the minimum operational temperature difference of the oceanic thermal energy conversion system cycle to be equal to 160 centigrade.
IV.
C
ONCLUSIONIn the present article, we have assessed the performance and dynamic stability of an OTEC system combined with a thermal power plant whose efficiency has been improved by absorption of condenser heat. The system, either in its steady state or when faced with turbulences such as sudden change in load, short circuit fault, is kept stable having a desirable performance. In addition, it is also able to reduce the thermal pollution caused by discharge of the power plant condenser. Depending upon dimensions of thermal power plant and rate of access to cold water, combination of a 10 megawatt oceanic thermal energy conversion system and an around 500 megawatt thermal power plant causes led to increase in the temperature of its thermodynamic cycle by almost 0.40 centigrade. This temperature difference results in improvement of thermal efficiency by about 3 to 4 percent. The system need to have minimum temperature difference of around 160 centigrade in its operational cycle in order to make a non-zero output net power.
R
EFERENCES[1] Gerard C. Nihous. An Order-of-Magnitude Estimate of Ocean Thermal Energy Conversion Resources. Journal of Energy Resources Technology, 127:328, 333, December 2005.
[2] Gerard C. Nihous. An Estimate of Atlantic Ocean Thermal Energy Conversion (OTEC) Resources. Journal of Ocean Engineering, 34:2210{2221, July 2007.
[3] Gerard C. Nihous. Mapping Available Ocean Thermal Energy Conversion Resources around the Main Hawaiian Islands with State of the Art Tools. Journal of Renewable and Sustainable Energy, 2, July 2010.
[4] C. Zener. Solar Sea Power. Bulletin of the Atomic Scientists, 35, 1976.
[5] O. Bai, M. Nakamura, Y. Ikegami, and H. Uehara, “Simulation and evaluation of transient performance of ocean thermal energy conversion plant with working fluid of binary mixtures,” in Proc. Twelfth Int. Offshore and Polar Engineering Conf., Kitakyushu, Japan, May 2002, pp. 641–648.
[6] R. H. Yeh, T. Z. Su, and M. S. Yang, “Maximum output of an OTEC power plant,” Ocean Eng. J., vol. 32, no. 5, pp. 685–700, Apr. 2005.
[7] P. J. T. Straatman and W. G. J. H. M. Sark, “A new hybrid ocean thermal energy conversion-offshore solar pond (OTEC-OSP) design: A cost optimization approach,” Solar Energy J., vol. 82, no. 6, pp. 520–527, Jun. 2008.
[8] V. Morisson, M. Rady, E. Palomo, and E. Arquis, “Thermal energy storage systems for electricity production using solar energy direct steam generation technology,” Chem. Eng.
Process. J., vol. 47, no. 3, pp. 499–507, Mar. 2008.
[9] H. Takazawa, A. Murata, and T. Kajikawa. Sensitivity Analysis of Ocean-Based Closed Cycle OTEC Power System. Electrical Engineering in Japan, 107, 1987.
[10] Luis A. Vega. Economics of Ocean Thermal Energy Conversion. [11] James F. George. System Design Considerations for a Floating OTEC Modular Experiment Platform. In Proceedings of the 6th Ocean Energy Conference, volume 1, 1979. Johns Hopkins University Applied Laboratory.
[12] Noboru Yamada, Akira Hoshi, and Yasuyuki Ikegami, “Performance simulation of solar-boosted ocean thermal energy conversion Plant,” Renewable Energy 34 (2009) 1752–1758.
10 15 20 25 30 35 40 45 50
-0.5 0 0.5 1 1.5 2 2.5
time (s)
Qg
o
(
p
u
)
0 5 10 15 20 25 30 35 40
25.5 25.6 25.7 25.8 25.9 26 26.1 26.2 26.3 26.4 26.5
Qc (MW)
T
st
m
(
p
u
)
16 18 20 22 24 26 28
0 0.1 0.2 0.3 0.4 0.5 0.6 0.7 0.8
T stm
(oc)
Pnet
(
p
u
[13] Li Wang, and Chen-Bin Huang, “Dynamic Stability Analysis of a Grid-Connected Solar-Concentrated Ocean Thermal Energy Conversion System”, IEEE TRANSACTIONS ON SUSTAINABLE ENERGY, VOL. 1, NO. 1, APRIL 2010. [14] Amit Bhatia, Shreya Agarwal, and SwaminiKhurana, “Optimal
Use of Waste Heat of Condenser of Thermal Power Plant,”
978-1-4244-5586-7/10, 2010 IEEE.
[15] Hyeon-Ju Kim, Ho-Saeng Lee, Seung-Won Lee, Dong-Ho Jung and Duck-Su Moon, “Mitigation of Environmental Impact of Power-plant Discharge by Use of Ocean Thermal Energy Conversion System,” 978-1-4244-5222-4/10/ 2010 IEEE.
[16] H. P. Garg and R. K. Agarwal, “Some aspects of a PV/T collector/ forced circulation flat plate solar water heater with solar cells,” Energy Convers. Manage. J., vol. 36, no. 2, pp. 87– 99, Feb. 1995.
[17] P. C. Krause, Analysis of Electric Machinery. New York: McGraw Hill, 1987.
[18] P.Kundur, Power System Stability and Control. New York: McGraw Hill, 1994, ch. 8–9.
[19] IEEE Committee Report, “Dynamic models for steam and hydro turbines in power system studies,” IEEE Trans. Power App.
Syst., vol. PAS-92, no. 6, pp. 1904–1915, Nov. 1973.

![Table 1: Characteristics of the 10 Megawatt OTEC system combined with a 500 megawatt thermal power plant [20] Ttemperature of surface water 26 0c](https://thumb-us.123doks.com/thumbv2/123dok_us/8788095.1765039/4.595.303.542.262.740/table-characteristics-megawatt-combined-megawatt-thermal-ttemperature-surface.webp)
