Volume 02, No. 4, April 2016
P
age
199
Test Case Prioritization for Regression Testing Based on Fault
Dependency and Fault Severity
Sumon Chatterjee* & M. Mohan**
*M. Tech, Department of Computer Science and Engineering, SRM University, NCR Campus
**Assistant Professor, Department of Computer Science and Engineering, SRM University, NCR Campus
ABSTRACT
The sole purpose of Test Case Prioritization technique is to schedule test cases for Regression Testing in a certain order that increases the effectiveness of the testing process while achieving some performance goal. It ensures that the most beneficial test cases are executed first. A number of techniques have been proposed for Test Case Prioritization. One of the techniques prioritizes test cases based on Fault Dependency. This technique helps the developers to start debugging on the faults that cause other fault sto appear later. The only limitation of this approach is that the fault severity is considered uniform, which in practical world may often vary. So, this paper aims to resolve it by considering fault severity along with fault dependency and thus further improving the performance of the regressiontesting process.
Keywords – Fault Dependency, Fault Severity, Regression Testing, Test Case Prioritization.
I. INTRODUCTION
Regression testing is the re-execution of some subset of tests that have already been conducted to ensure that changes have not propagated unintended side effects [6]. Regression testing ensures that there is no additional error introduced due to the modification of the software. Regression test suites are usually previously designed and saved for later reuse. But, re-executing all the test cases can take an enormous amount of time leading to overall inefficiency of the process. To improve the efficiency, either of test suite reduction, test case selection or test case prioritization is used [7].
Volume 02, No. 4, April 2016
P
age
200
II. RELATED WORK
In recent years, many metrics have been proposed by researchers to improve regression testing. One such metric is proposed in [3] and [4], to measure fault detection rate as objective function along with statement coverage. The metric proposed in [2] deals with varying test case and fault costs. Prioritization of test cases using relevant slices is proposed in [5].In [1],a metric is proposed that measures fault dependency detection rate.The proposed technique first determines the number of faults dependent for each fault and then calculates total dependency count for each test case. The value of total dependency count determines the sorting order of the test cases.
III. PROBLEM DESCRIPTION
The existing technique proposed in [1], prioritizes test cases based on Fault Dependency. This technique helps the developers to start debugging on the faults that cause other faults to appear later. The only limitation of this approach is that the fault severity is considered uniform, which in practical world may often vary. This paper aims to resolve it by considering fault severity along with fault dependency and thus further improving the performance of the regression testing process.
IV. PROPOSED METHODOLOGY
A. Existing Approach Considering Fault Dependency
Fault dependencies are represented in [1] with directed graph, G (V, E). The vertex set V represents the faults, V= {V1, V2, V3, V4, V5}. The edge set E represents fault dependencies where an edge (F1, F2) represents fault F1 is dependent on fault F2. “Fig. 1” shows the dependency graph, as shown in [1].
Fig. 1. Dependency Graph
The dependency matrix, M, from [1],is formed from the graph where M (i, j) =1 if fault
Volume 02, No. 4, April 2016
P
age
201
Table 1. Dependency Matrix
F1 F2 F3 F4 F5
F1 0 0 0 0 0
F2 0 0 0 1 1
F3 0 0 0 0 0
F4 0 0 1 0 0
F5 1 0 1 1 0
From the dependency matrix M, NFD (F) i.e., Number of Faults Dependent on fault F, is calculated for each fault.
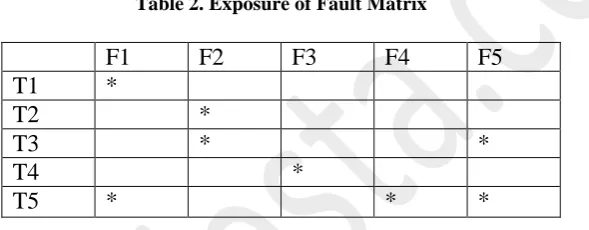
Test cases with fault detecting abilities are also considered in [1] which is shown in Table 2.
Table 2. Exposure of Fault Matrix
F1 F2 F3 F4 F5
T1 *
T2 *
T3 * *
T4 *
T5 * * *
From dependency matrix and exposure of faults matrix, Total Dependency Count (TDC) is calculated for each test case. TDC of a test case is the summation of NFD of faults that first expose in the test case [1]. Then test cases are sorted in descending order of TDC value.
B. New Prioritization Technique Considering Fault Dependency and Fault Severity
The fault dependency component of the proposedprioritization factor is derived as described in [1].For the fault severity component, each fault is assigned a Severity Measure (SM) based on five classes as shown below:
1) Very Low (Severity Measure = 1): Class S1 2) Low (Severity Measure = 2): Class S2 3) Moderate (Severity Measure = 3): Class S3 4) Complex (Severity Measure = 4): Class S4 5) Critical (Severity Measure = 5): Class S5
Volume 02, No. 4, April 2016
P
age
202
Table 3. Severity Matrix
S1 S2 S3 S4 S5
T1 1 1 1 0 0
T2 1 0 1 1 1
T3 0 1 1 0 0
T4 0 0 0 0 0
T5 0 0 1 1 0
Total Severity Count (TSC) for each test case is calculated from the summation of Severity Measures (SM) of all faults identified for the test case.
TSC = .
(1.1) Prioritization Factor (PF) is calculated for each test case, which is the summation of the two components i.e., Total Dependency Count (TDC) and Total Severity Count (TSC).
PF = .
(1.2)
Using the value of the Prioritization Factor (PF), the algorithm sorts the test cases in the descending order of PF to generate the required test case prioritization order of regression testing based on fault dependency and fault severity.
C. Algorithm
The algorithm for the new prioritization technique considering fault dependency and fault severity, which is the modified form of the algorithm proposed in [1], is shown below:
Input:Test suite T, Fault dependency matrix M, Fault exposure matrix E, Fault severity
matrix FS, Fault F
Output:Prioritized test suite T’
1: begin
2: set T’ empty
3: set NFD empty
4: set TDC empty
5: set TSC empty
6: set PF empty
7: for each fault f’ϵ F do
8: for each fault f’’ϵ F do
9: if M [f’, f’’] =1 then
Volume 02, No. 4, April 2016
P
age
203
11: end if
12: end for
13: end for
14: for each test case t ϵ T do
15: for each fault f ϵ F do
16: if f first exposes in T then
17: TDC[t] =TDC[t] + NFD[f]
18: end if
19: TSC[t] = TSC[t] + FS[f]
20: end for
21: PF[t] = TDC[t] + TSC[t]
22: end for
23: sort T in descending order based on the PF value of each test case
24: let T’ be T
25: end
The algorithm first calculates the NFD of each fault based on fault dependency matrix M. Then, TDC of each test case is determined from the fault exposure matrix E and the derived NFD. TSC for each test case is calculated from the fault severity matrix FS. Then, PF for each test case is determined from the summation of its TDC and TSC. Finally, based on the value of PF, test cases are sorted in the descending order of PF to generate the required test case prioritization order of regression testing based on fault dependency and fault severity.
V. EXPERIMENTATION AND ANALYSIS
Let us take the fault dependency graph from “Fig. 1”, fault dependency, fault exposure and fault severity tables i.e., Table 1, 2 and 3 respectively as inputs.
From Fig. 1, we have the following six dependencies E= {(F2, F4), (F2, F5), (F4, F3), (F5, F1), (F5, F3), (F5, F4))}.
The NFD of each fault calculated from Table 1 are shown below:
NFD (F1) =1 NFD (F2) =0 NFD (F3) =2 NFD (F4) =2 NFD (F5) =1
After calculating TDC of each test case from Table 1 and 2,we get the following:
Volume 02, No. 4, April 2016
P
age
204
TSC for each test case is calculated from Table 3 by adding up the corresponding SM of faults, which is shown below:
TSC (T1) = 1 + 2 + 3 = 6
TSC (T2) = 1 + 3 + 4 + 5 = 13
TSC (T3) = 2 + 3 = 5
TSC (T4) = 0
TSC (T5) = 3 + 4 = 7
Prioritization factors for each test case is calculated by the summation of TDC and TSC as shown below:
PF (T1) = TDC (T1) + TSC (T1) = 1 + 6 =7
PF (T2) = TDC (T2) + TSC (T2) = 13
PF (T3) = TDC (T3) + TSC (T3) = 1 + 5 = 6
PF (T4) = TDC (T4) + TSC (T4) = 2
PF (T5) = TDC (T5) + TSC (T5) = 2+ 7 = 9
Now, sorting test cases in descending order of PF, we get the following prioritized order of test cases: T2, T5, T1, T3 and T4.
After plotting graph of the percentage of fault dependency and severity detected versus the percentage of test suite executed, we get “Fig. 2” for unsorted test cases and “Fig. 3” for prioritized test cases.
Fig. 2. Graph for Unsorted Test Cases
Volume 02, No. 4, April 2016
P
age
205
Fig. 3. Graph for Prioritized Test Cases
From “Fig. 2” and “Fig. 3”, we see that the area coverageof the fault dependency and severity detection for the prioritized test cases is much better than that for the unsorted test cases, which implies the significant performance increase in the test case prioritization process based on fault dependency and fault severity.
VI. CONCLUSION AND FUTURE WORK
This paper proposed a technique to prioritize test cases based on fault dependency and fault severity. Several other parameters e.g., code coverage, can alsobe incorporated with this approach. Also, genetic algorithms can also be implemented to generate a better pool of input test cases. Test case execution time is also considered uniform here. These factors can be considered to make this algorithm more robust and effective.
ACKNOWLEDGMENT
This work was supported by the Department of Computer Science and Engineering of SRM University, NCR Campus. We would like to thank all the faculty members of our department for their relentless encouragement and support throughout the whole research process.
REFERENCES
i. Md. ImrulKayes, “Test Case Prioritization for Regression Testing Based on Fault
Dependency”, Electronics Computer Technology (ICECT), 3rd
International Conference, IEEE, 2011
ii. Alexey G. Malishevsky, Joseph R. Ruthruff, Gregg Rothermel, Sebastian Elbaum,
Volume 02, No. 4, April 2016
P
age
206
iii. S. Elbaum, A. Malishevsky, and G. Rothermel, “Prioritizing test cases for regression
testing,” Proc. The 2000 ACM SIGSOFT International Symposium on Software Testing and Analysis, Portland, Oregon, U.S.A., August 2000, 102–112.
iv. S. Elbaum, A. Malishevsky, and G. Rothermel, “Test case prioritization: A family of
empirical studies,” IEEE Transactions on Software Engineering, vol. 28(2), 2002, pp.
159–182.
v. D. Jeffrey and N. Gupta, “Test case prioritization using relevant slices,” Proc.
Computer Software and Applications Conference, 2006, 411–420.
vi. Roger S. Pressman, “Software engineering a practitioner’s approach”, 7/e, 2010
vii. UshaBadhera, G.N Purohit, Debarupa Biswas, “Testcaseprioritization algorithm based
upon modified code coverage in regression testing”, International Journal of Software
Engineering & Applications (IJSEA), Vol.3, No.6, November 2012
viii. B. Qu, C. Nie, B. Xu, and X. Zhang, “Test case prioritization for black box testing,”
Proc. Computer Software and Applications Conference, July 2007, 465–474.
ix. B. Korel, G. Koutsogiannakis, and L. H. Tahat, “Model-based test prioritization
heuristic methods and their evaluation,” Proc. International Conference on Software Maintenance, 2007, 34–43.
x. B. Korel, L. Tahat, and B. Vaysburg, “Model based regression test reduction using