R E S E A R C H
Open Access
Interactive web-based mapping: bridging
technology and data for health
Linda Highfield
1,2*, Jutas Arthasarnprasit
3, Cecelia A Ottenweller
3and Arnaud Dasprez
3Abstract
Background:The Community Health Information System (CHIS) online mapping system was first launched in 1998. Its overarching goal was to provide researchers, residents and organizations access to health related data reflecting the overall health and well-being of their communities within the Greater Houston area. In September 2009, initial planning and development began for the next generation of CHIS. The overarching goal for the new version remained to make health data easily accessible for a wide variety of research audiences. However, in the new version we specifically sought to make the CHIS truly interactive and give the user more control over data selection and reporting.
Results:In July 2011, a beta version of the next-generation of the application was launched. This next-generation is also a web based interactive mapping tool comprised of two distinct portals: the Breast Health Portal and Project Safety Net. Both are accessed via a Google mapping interface. Geographic coverage for the portals is currently an 8 county region centered on Harris County, Texas. Data accessed by the application include Census 2000, Census 2010 (underway), cancer incidence from the Texas Cancer Registry (TX Dept. of State Health Services), death data from Texas Vital Statistics, clinic locations for free and low-cost health services, along with service lists, hours of operation, payment options and languages spoken, uninsured and poverty data.
Conclusions:The system features query on the fly technology, which means the data is not generated until the query is provided to the system. This allows users to interact in real-time with the databases and generate customized reports and maps. To the author’s knowledge, the Breast Health Portal and Project Safety Net are the first local-scale interactive online mapping interfaces for public health data which allow users to control the data generated. For example, users may generate breast cancer incidence rates by Census tract, in real time, for women aged 40-64. Conversely, they could then generate the same rates for women aged 35-55. The queries are user controlled.
Keywords:interactive mapping, health disparities, geographic information systems
Introduction
Geospatial assessment and communication of disease patterns, risk and health outcomes, has historically been limited to specialized researchers, using specialized tools [1]. With the advent of web 2.0, the landscape of acces-sing health information has shifted, and more research-ers (academic and non-academic) are using the web for data sharing, research and planning purposes [2]. Many health departments now provide public access to their health statistics via the Internet, including morbidity
and mortality indicators [3]. This has promoted user involvement and data examination beyond the tradi-tional academic model [3,4]. The web can serve as a tool for sharing real-time information across a spectrum of potential users; additionally geographic information systems (GIS) technologies on the web have become increasingly popular and user- friendly.
GIS technologies are tools that allow for the storage, management, manipulation and visualization of spatial data [5]. Web-based GIS has the potential to connect a large number of researchers and lay people with tial public health data. Distributing and sharing geospa-tial data on the web can aid health planners, policy researchers and decision-makers in their collaborative
* Correspondence: [email protected]
1St. Luke’s Episcopal Health Charities, Houston, TX, USA
Full list of author information is available at the end of the article
efforts to improve public health outcomes and design interventions targeted to local populations [5]. At the forefront of this movement to share data across the spectrum was the Community Health Information Sys-tem (CHIS) online mapping sysSys-tem, which was first launched in 1998. Its overarching goal was to provide researchers, residents and organizations access to health related data reflecting the overall health and well-being of their communities within the Greater Houston Area. The central theme for the development of the original platform was to create a tool that could be used to visualize, analyze and ultimately reduce health dispari-ties. The original interface effectively connected a wide audience with information vital to developing action plans to address identified health needs in underserved areas.
However, over time, a number of issues were identi-fied that limited the utility of the system. The original design of the CHIS mapping system required the down-load of an ActiveX control, which is a Microsoft frame-work that allows programmers to take advantage of additional features that would not normally be available on the browser. It also only worked in Internet Explorer, limiting user accessibility as a host of new browsers came online. The original CHIS provided users pre-cate-gorized static maps, which could be overlaid with clinic locations. Additionally, users could access stand-alone reports containing additional data about the area of interest, such as Census data on population.
As the CHIS was developed and grew over time, the back-end database for the geo-referenced data became an issue. Data was loaded into multiple tables, some-times containing repetitive information, due to the nat-ure of the piecemeal addition of new data. Maintaining up-to-date clinic information is vital to the success of the portals, therefore improving usability in the back-end of the application for both the clinics uploading information and the administrator was important. And the original multiple databases housing all of the data needed to be analyzed and synthesized into a single database that was flexible enough to expand for future data types. These issues are not unique to CHIS. Models developed over time tend to run into issues with data storage and must be adaptive to continue to serve their target audience.
A number of online public health mapping tools have been developed since the launch of CHIS in 1998, including many developed by State and local public health departments. Almost all of these systems are interactive, allowing the user to query data and then generate a map [6]. One of the current limitations with these systems is an issue of scale. Most of these systems provide data at a resolution no smaller than County level. Those providing sub-County data, to date, only do
so in a pre-categorized static map or as separate reports given in conjunction with the County- level data. None, to the authors knowledge, provide both user-generated local-scale geographical and attribute data (e.g., a resolu-tion smaller than County, such as Census tract, block or Zip code). Local-scale geographical and attribute data is critical for conducting research, targeting interventions and siting new service locations. Many public health research and intervention projects are intended to affect a population at a scale smaller than County resolution. Even still, data that is local-scale is typically provided in an aggregated form, such as Census tract, presenting limitations on the utility of the data. Researchers, plan-ners and service providers need to be aware of the issues surrounding scale and data aggregation, such as the modifiable areal unit problem [7]. The Florida CHARTS is an example of an online interactive health GIS tool providing both County and sub-County infor-mation [8]. This site provides the user with the ability to query data on birth or death rates by County across various time periods. Additionally, users can select Cen-sus Tracts to open a separate report containing demo-graphic data for the selected tract. While current implementations, such as CHARTS, serve as an impor-tant data and planning resource, they do not provide the end-user with the ability to generate customized local-scale maps and reports based on specific user-dri-ven criteria in real-time. The ability to generate data at a meaningful level of spatial aggregation has been cited as a major challenge to overcome with interactive map-ping systems in public health [9].
Technological advances have made it possible to begin addressing this challenge, including Google Earth and the Google Maps API launched in 2005. These tools fol-lowed the widespread adoption of Google as a web search engine in the early 2000’s. The Google Data APIs allow programmers to create applications that read and write data from the Google service [10]. The widespread use of Google technologies has created a large number of potential users who already have knowledge of how to use these tools. Additionally, these technologies can easily be used to create custom applications in an inter-face that appears seamless to the user [5,11-16].
Leveraging the power of Google API technologies, we set out to create a local-scale interactive web-based sys-tem for public health data with the next generation of CHIS.
applications. Specifically, the goal was to create a system in which researchers could easily access demographic, health related measures, clinic location, and clinic ser-vice data. The objective was to provide a user-friendly tool to better inform public health intervention develop-ment, healthcare expansion and service delivery and, most importantly improve access to care and reduce health disparities in the Greater Houston region. To achieve these goals and objectives, an online, real-time interactive local-scale database system was created.
Results
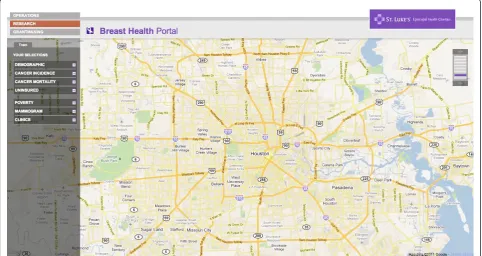
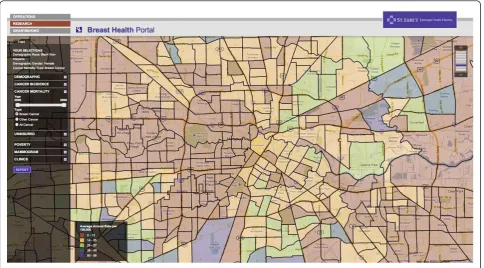
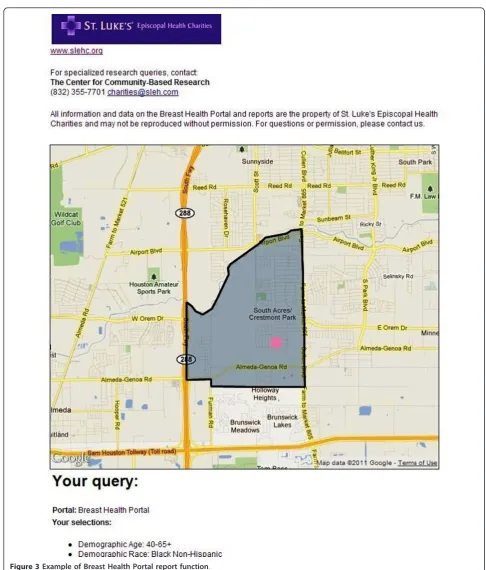
The Beta sites for both the BHP and PSN are functional and available for review online. The BHP can be accessed at: http://interactive-mapping.slehc.org/breast-health-portal/census.aspx. The PSN can be accessed at: http://interactive-mapping.slehc.org/project-safety-net/ census.aspx. The landing page for the BHP is shown in Figure 1. Both portals allow the user to zoom in and out and pan using standard Google navigation tools (Figure 1). Both portals provide data on rates of disease, including cancer incidence and mortality and the top five leading causes of death as defined by the Centers for Disease Prevention and Control. Due to data instability, areas with less than 20 cases or deaths in the selected time period were suppressed. An example of an interactive query is shown in Figure 2; the report func-tion is shown in Figure 3. To date, the response to the Beta portals has been very positive. Over a two month
period, following the launch of the beta site, a total of 395 visits by 285 unique visitors were reported. The average visit length was just over two minutes.
Discussion
The portals present users with an easily accessible plat-form for accessing data, addressing research questions and service delivery decisions. For example, a Federally Qualified Health Center (FQHC) in the local area used the data on PSN related to medically underserved areas, the uninsured, population demographics and clinic loca-tions to determine the proposed site for a new clinic (personal communication). Researchers interested in studying the relationship between mammography screen-ing availability and uninsured women of screenscreen-ing age have used the BHP to address the relationship between these variables. These are two of many examples of how the system can be utilized to benefit researchers, planners and non-profits in the area covered by the portal.
The creation of the next generation of the portals had to be completed given a number of constraints: The portals needed to be accessible to as many people as possible, therefore the technology used to access them needed to be universally accessible, low cost, would not require any additional downloads and be as browser-agnostic as possible. The portals also needed to be as interactive as possible, allowing users to dynamically define their research parameters rather than being forced to accept preset queries.
Google technologies, including Google mapping, were chosen for a variety of reasons: First, Google and Google Maps are well known and widely used by a cross-section of the portals’ target audience, which means reduced barriers to use. Compatibility was also a powerful selec-tion criterion; no third-party implementaselec-tion was neces-sary to install and access the maps. Google maps were a low-cost choice, since they were free and supported by SSL protocol when we began development of the Beta portals. Google announced usage limits to the Maps API in October, 2011 For more details, see http://goo- glegeodevelopers.blogspot.com/2011/10/introduction-of-usage-limits-to-maps.html. As can be seen in the article, Google intends the charges to affect power-users of the API. No charges are incurred with less than 25,000 map loads per day per API. The SLEHC portals are not expected to exceed that limit.
Google also provides an ideal technology for mobile support with access on Google Android-enabled devices and Apple ios devices (iPhone and iPad). Opportunities to integrate with future Google-developed innovative tools, such as Google Public Data Explorer, were impor-tant. We plan to enable the portals for mobile access and use Google Public Data Explorer in the next version of the system. Utilizing a variety of technologies in the Beta portals allowed users to interact with and query local-scale health related data in real time. Nevertheless, four core challenges to the technical implementation
had to be overcome: 1) Polygon loading time, 2) Data consolidation and standardization, 3) Application usabil-ity, and 4) Real-time data calculation.
Polygon loading time
There were 4404 polygons of Census tracts and 2884 Zip code polygons to load in the user’s browser. If they loaded simultaneously it would have made the user experience unacceptably slow. Our solution was to con-strain loading to the given viewing area. We detected the coordinates of the upper left and lower right corners of the display window and then displayed/calculated only those polygons within the proscribed area. This sig-nificantly increased the speed of the system and improved the user experience by reducing wait time for results. The system currently takes just under 1 second to load each polygon.
Consolidation and standardization of data
The first generation of the application (CHIS) used data from 12 separate databases. To streamline the data and improve functionality for the next iteration, the data-bases were consolidated into a single database, requiring a massive reorganization. A majority of the data defini-tion and field types in the database were stored in order to allow scalability. We also strictly defined additional data definition tables that will allow the system adminis-trator to configure the data fields for any future data
provided by non-federal sources and restricted data for-mat to comma-separated variable (CSV), which signifi-cantly improved importation of data into the system and allowed data to go live immediately after upload (assum-ing the data are checked and clean).
Usability, interactivity, presentation
One of the constraints of the redevelopment of the sys-tem specified interactive, user-defined queries. In a typi-cal mapping application, users expect to click on a given polygon and immediately access data. Interactivity of
this type is generally Windows-like behavior and is diffi-cult to accomplish with Web-based technology where interactivity is limited. Applications and widgets exist that improve interactivity within a web environment, but they violated one of the other constraints of the project, which were maximized accessibility with no additional software purchases or downloads. Technolo-gies such as Flex, Flash and JavaFS were options, but each of them would have created severe roadblocks to some users’ability to access the portals. The application of Ajax technology allowed for the development of a Windows-type environment and the posting of data dynamically without requiring page refresh.
Interactivity in the new portals includes dynamic user-defined queries (demographic parameters, date range of data) using sliding scales, as opposed to the canned, pre-set reports in the previous incarnation of the database. Also, Census tracts are dynamically highlighted as the user hovers over specific Census tract numbers in the portal navigation, allowing them to locate tracts visually as well as numerically. In the future the portals will allow users to actually drag a given polygon into a basket.
On-the-fly calculations
The Census tracts in the data set vary widely in popula-tion density, making comparison of relative incidence rates from one to another a complex set of calculations. Those calculations take time, which then detracts from the user experience. Calculating relative radius for iden-tified clinics was also an issue. In the Beta version, we solved both by using the ASP.NET data caching method. The next version will have the ability to save frequently used reports to minimize the amount of calculation time used by the system. The next version of the appli-cation will calculate all of the different permutations and save them in the database.
We have met and solved many challenges in develop-ing these portals, but there are still technological chal-lenges to be addressed. The system does not perform optimally in Internet Explorer due to coding issues within the browser. Currently, it is recommended to access the system in Google Chrome or Mozilla Firefox. Future work will attempt to address the issue with Internet Explorer to ensure a good experience for all users. Additionally, reports are only available as a new html window in the Beta system. Future versions will utilize interactive pdf technology allowing the user to interact with the report as a pdf. This will be particu-larly useful once Google Public Data Explorer is imple-mented, providing the user the capacity to animate a time series of data within a pdf document.
Currently, the portals contain data for the Houston-Galveston-Brazoria Consolidated Metropolitan Statistical
Area (CMSA). To give an idea of the scale of this cur-rent implementation, the CMSA is larger than the State of New Jersey [17]. Plans are underway to expand the next version of the portals to include multi-county, regional and, eventually, statewide data. The State of Texas is the second largest in the U.S., in both geo-graphic area and population. The unique set of chal-lenges in the expansion is: 1) How to enroll and maintain data from clinics serving the underserved and, 2) How to allow users to quickly access local-scale data across wide geographies. In the development of the CHIS and in the Beta portal system, the authors have worked closely with the clinics that serve the under-served population in our region and provided the assis-tance of a community liaison, at no charge, to encourage their enrollment and help maintain the data. Clinics that serve this target population (underserved) are very busy and often under-staffed. Providing assis-tance in enrollment has proven helpful to their partici-pation. Additionally, the clinics benefit from their enrollment by increasing the visibility of the clinic and attracting new patients from portal usage. However, pro-viding a community liaison is an expensive and time intensive investment in the portal data. As we consider expanding to larger geographies, we will have to address how to efficiently enroll and maintain data for these clinics. Approaches that are being considered include region by region expansion with the use of our current liaison working directly with the local clinics and part-nering with organizations that already serve and know the clinics well, such as the Breast Health Collaborative of Texas or the Lone Star Association of Clinics. Both member organizations have state-wide enrollment of our target audience and could potentially provide assis-tance in data entry.
issues. While these are important issues to consider, our purpose with the development of the Beta site was an attempt to create a functional local-scale“query on the fly” system for accessing a variety of public health data, not to address all the issues surrounding the use of spa-tial data. Future versions may also employ spaspa-tial smoothing techniques to deal with issues in presenting disease rates for small areas. Another important issue to consider in the presentation of data in an online map-ping portal is the modifiable areal unit problem (MAUP). The MAUP causes data analyzed at either a varying aggregation or scale to result in different answers [7]. This is an issue that the authors can only control to a certain extent. Much of the data used in the system is natively aggregated (Census data, incidence and mortality data by tract). In the current Beta system, we only present data at the unit of aggregation it was provided to the authors in. In other words, we have made no changes to the data (aggregation or disaggrega-tion). However, as we expand the system to allow users to access data across multiple scales, the MAUP will continue to be an important issue to consider. One way to address this is to control the scale at which data is presented, as we do currently. As part of the future work on the system, the authors plan to convene an advisory panel comprised of spatial data experts to help determine how to address this issue and many others in future versions of the system.
In the first two months following the launch of the portals, there were 395 visits by 285 unique visitors. It is difficult to know if these numbers reflect a good out-come or not. The Beta system was not marketed or advertised. It also doesn’t require a login, so we were not able to record information on the users. A login will be included in the full version of the system and will facilitate better tracking of users and allow for evalua-tion of the system. The development of the Beta portals took a large amount of resources (both time and money). While online mapping systems, such as the portals, have the potential to reach a large number of users, the amount of resources required to develop and maintain such a system is an important consideration. Future work will be focused on evaluation and assess-ment of the utility of the system and its ability to meet its objectives and the needs of users. Once the system moves from Beta to the full version, a focus on market-ing and trainmarket-ing will occur.
Conclusions
To the author’s knowledge, the BHP and PSN are the first local-scale interactive online mapping interface for public health data. The uniqueness of the system lies in the amount of flexibility and control it provides to the user, while providing local-scale data. Rather than
pre-categorizing data, the system gives the user the ability to create custom queries specific to their research needs at local-scale geography. For users, this is a critical advancement. The ability to easily access data (for example, breast cancer mortality in African American women aged 40-64 years) at a local geography is essen-tial to conducting research within specific geographies or specific populations. The authors feel that the major contribution of this work is in serving as an example of what can be done using the latest technologies and ser-ving as a launching platform for others to improve on this work. With that in mind, the authors would encou-rage all interested researchers to contact us if they have an interest in developing similar systems or if they are interested in partnering on continued developments to our site. Initial feedback for the system has been encouraging, particularly regarding the level of user control.
Methods
A series of focus groups were held with a cross-section of local researchers to gain insight into how people used the previous version of CHIS and how they would uti-lize the new system. Organizations participating in the focus groups from across the region included represen-tatives from city and county public health officials, Fed-erally Qualified Health Centers (FQHCs), the Harris County Healthcare Alliance (HCHA) and university-based academic researchers. Participants were asked to provide information about what kind of data they use, how they access it, how they use it and what kind of system would be useful for their research needs. Based on participant feedback and suggestions, initial develop-ment of the next generation of interactive mapping por-tals began. The Breast Health Portal (BHP), focused on breast cancer and access to mammography screening, and the Project Safety Net (PSN), focused on access to primary health care services. The first phase included mock-ups of the system, followed by a prototype (beta website). Feedback on these mock-ups was sought from community (researchers) throughout the development process.
Database Development
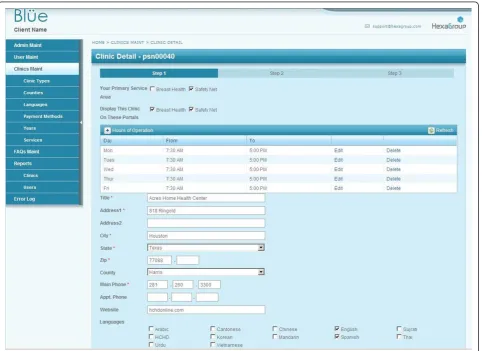
information into the system (Figure 4). At each clinic, a staff member is responsible for data entry and is pro-vided a user identification and password to access the system. For clinics that need assistance, a community liaison is available to assist with data entry and answer questions that arise. The community liaison’s assistance is provided at no charge to the users. Data entry for all other data types is handled by the authors and is done by uploading spreadsheets into the SQL database. Data entry for the clinics is reviewed by the community liai-son prior to pushing live on the system. All other data entry goes live immediately upon entry. All data is checked prior to uploading.
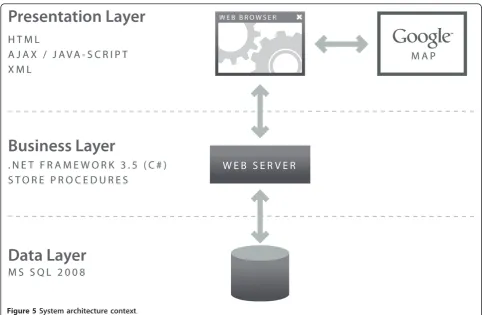
System Architecture
The system offers an n-tier architecture as shown in Figure 5: Data Layer: MS SQL Server 2008, Business Layer: Store procedures and ASP.Net 3.5 Framework (C# programming), Presentation Layer: Html, Cascade Style Sheet and JavaScript (jQuery Framework). The technology used for the portals include: Microsoft .NET
Framework 3.5, Microsoft SQL Server 2008, Google Maps Javascript API V3, JQuery, Telerik RadControls (ASP.NET AJAX), XML and HTML. Telerik RadCon-trols and JQuery are used as part of the presentation layer of the application to enhance the user experience. The data used in the portals were originally ArcGIS sha-pefiles containing spatial and attribute data. The shape-files were converted into KMZ (a KML compressed file), then to KML using ESRI ArcInfo. The KML files were imported into and used by Google to make the online maps. The KML spatial data retained sufficient informa-tion to “join” data from the data tables (in SQL). The data were joined using FIPS (Federal Information Pro-cessing Standards) codes. The spatial data were interac-tively rendered by Google upon request using HTML. Required hardware included windows based servers (Minimum 1 database server and one web server. The platform is load balancing compatible and can scale to high traffic).
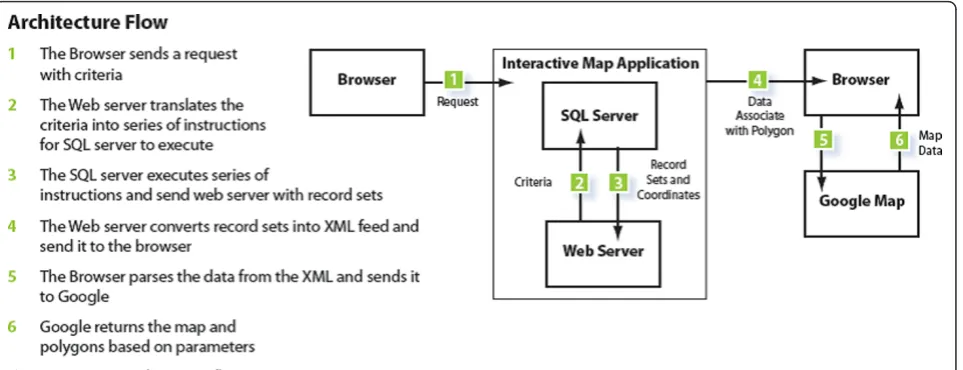
The application flow is as follows: the user sends a request via his/her web browser, including his/her
selection criteria, which the web server translates into a series of instructions for the SQL Server to execute. The SQL Server executes a series of instructions and sends the record sets to the Web server. The Web server con-verts the record sets into an XML feed prior to sending it to the Web browser. The browser parses the data from the XML and sends it to Google, which then returns a map with a series of layered polygons and markers based on the user’s selected parameters (Figure 6).
The polygons returned by the Google mapping API are expressions of coordinates that the user sees as either specific Census tracts or Zip code areas. They are essentially shaped containers of the proprietary informa-tion housed in the database, which is then overlayed on top of Google’s generic map information. In the Breast Health Portal, all polygons are expressions of Census tracts. In the Project Safety Net Portal, information is available for both Census tracts and Zip codes. Both the polygons are shaded and the legend is dynamically cre-ated based on the user’s specific search parameters. All other data on the portals (cancer incidence and mortal-ity, birth, uninsured, etc) are attributed to a specific Census tract or Zip code. The data is received pre-cate-gorized at these geographies. The system also generates polygon outlines expressing a variety of political
boundaries: School District, Commissioner District, Sen-ate and House districts, Counties, etc. The markers are represented as colored squares display health centers locations, type, clinic name, contact information and services offered.
C# coding language was used for programming the system. SQL Server 2008 was used for data storage. The database has been designed to allow for easy data updates, without requiring the assistance of a database administrator. New data can be imported in .csv format and allow for updating the content of the portals. The Beta system contained over 11 GB of data comprised of 52 tables and 59 store procedures used to produce the maps.
Geographic coverage and data
Geographic coverage for both Beta portals was the Houston-Galveston-Brazoria Consolidated Metropolitan Statistical Area (CMSA). The CMSA is comprised of eight counties: Brazoria, Chambers, Fort Bend, Galves-ton, Harris, Liberty, Montgomery and Waller (Figure 7) [17]. The CMSA covers a geographical area of 8,778 square miles (30,108 km2) and is the sixth largest MSA in the U.S., with a population of just under 6 million [17]. The population is centered in the city of Houston, with a population of just over 2 million [17].
Data available on the BHP include: age, race, unin-sured status, poverty, cancer incidence (1995-2007), and mortality rates (2000-2006) over single or multiple years. In addition, point locations of service providers are included. . Additionally, geo-political boundaries such as school districts, city council, and neighborhoods can be overlaid to create customized and comprehensive maps. Data on PSN include: age, race, uninsured status, poverty, birth rates, death rates for the top five leading causes of death as defined by the Centers for Disease Control and Prevention (CDC) and medically under-served areas, in addition to point locations of service providers. Multiple sources provided data: cancer inci-dence data from the Texas Cancer Registry (Texas Department of State Health Services), death data from Texas Vital Statistics, clinic locations for free and low-cost health services from local clinics registered on the site, preventable emergency department visits from the University of Texas School of Public Health, medically underserved areas from the Health Research Services Administration (HRSA) and mammogram capacity as reported by all agencies offering low-cost mammography screening in the study region. Data on cancer incidence and mortality were calculated as rates per 100,000, age-adjusted to the U.S. standard population, 2000. Under IRB agreement, cancer incidence rates could only be cal-culated for tracts with five or more cases.
The BHP allows users to access data at Census tract geography. The PSN allows users to access data at from both Census tract or Zip code geographies and toggle between the two. Both portals allow the user to overlay geographic boundaries on selected data, such as school districts, congressional districts and neighborhoods (tract or Zip code) and to generate customized reports based on user selections.
Usability
Both the mapping interface and provider search rely on up-to-date clinic information. The maintenance of this part of the database is managed by a community liaison. The first generation of the database required IT involve-ment when generating reports, adding new clinics, or authorizing administrative privileges. The second gen-eration now has a backend that is much easier to use, streamlining the process for all involved. This is achieved by relying on Ajax based controls and improved layout of field data, which has accelerated data input by almost 50%. Information upload is signifi-cantly faster with less time eaten by data refresh. Clinics can jump from step to step/section to section with much greater ease (Figure 4). They are also able to retrieve username and passwords via email as opposed to the rigorous process they once had to endure. For the liaison, administration of the clinic information is greatly improved: The administrator can now create custom reports and add clinics, and assign users and passwords without going through the IT department. The administrator can also dynamically create new fields and tables for site scalability (clinic types, counties, lan-guages, payment methods, years, services.) They can also easily move through the various sections of the application, which has been reported as a vast improve-ment over the previously cumbersome backend of the first generation.
On the front end of the portals, users interact with the portals via left-side navigation containing a series of expandable characteristics, all of which can be queried (for example, population data) by clicking either on the variable name or plus sign at the side of the variable (see Figure 1 and 2). Additionally, usability is improved by providing users a series of question marks on the
interface. Each question mark may be clicked on. Once clicked a box open that contains definitions of related terms (Figure 8). Once selected, a drop down box opens containing detailed data available to query (for example, age and race) (Figure 2). The user selects the data either by using a slider bar or filling in a box to indicate their selection. The user can find all selections at the top of the left-side navigation. The system automatically queries the database and returns the results in real-time. Each time the user updates the query selections or
panes the map, a new request is generated and the view-able map is updated, which is a major reason the sys-tem’s loading time is manageable. The system’s zoom has also been specially programmed to be limited based on browser version and type. For example, Internet Explorer (IE) 6 JavaScript engine is very poor at execut-ing large amounts of scriptexecut-ing; therefore, when opened in IE 6, the portals’ zooms are limited to levels that won’t crash the application. After generating selected data, users could create a report showing their selected
geographic locations and corresponding data as a new html window (Figure 3).
Acknowledgements
The author would like to acknowledge St. Luke’s Episcopal Health Charities for funding this research. Marlynn May and Karen Williams provided internal review.
Author details
1St. Luke’s Episcopal Health Charities, Houston, TX, USA.2Texas A&M School
of Rural Public Health, Department of Epidemiology and Biostatistics, College Station, TX, USA.3Hexagroup LLC, Houston, TX, USA.
Authors’contributions
LH developed the conceptual design for the Beta portals, collected and analyzed data and drafted the manuscript. CO carried out the focus groups and contributed to the draft manuscript. JA carried out the technical development and programming of the portals. AD oversaw all technical development and had final approval on the implementation. All authors read and approved the final manuscript.
Competing interests
The authors declare that they have no competing interests.
Received: 20 October 2011 Accepted: 23 December 2011 Published: 23 December 2011
References
1. Mills JW, Curtis A:Geospatial Approaches for Disease Risk Communication in Marginalized Communities.Prog Comm Health Partnerships: Res, Educ, Action2008,2(1):61-72.
2. Lee BK:Epidemiologic Research and Web 2.0–the User-driven Web.
Epidemiol2010,21:6.
3. Gao S, Mioc D, Xiaolun Y, Anton F, Oldfield E, Coleman DJ:Towards Web-based representation and processing of health information.Int J Health Geog2009,8:3.
4. Bell BS, Hoskins RE, Pickle LW, Wartenberg D:Current practices in spatial analysis of cancer data: mapping health statistics to inform policymakers and the public.Int J Health Geog2006,5:49.
5. Gao S, Mioc D, Anton F, Xiaolun Y, Coleman DJ:Online GIS services for mapping and sharing disease information.Int J Health Geog2008,7:8. 6. Croner CM:Public Health GIS and the Internet.Annu Rev Public Health
2003,24:57-82.
7. Openshaw S, Taylor P:A million or so correlation coefficients: Three experiments on the modifiable area unit problem.Statistical Applications in the Spatial Sciences1979, ed.
8. Grigg M, Alfred B, Keller C, Steele JA:Implementation of an Internet-based Geographic Information System: The Florida Experience.J Public Health Man2006,12(2):139-145.
9. Cromley EK:GIS and Disease.Annu Rev Public Health2003,24:7-24. 10. Google data protocol:Developer’s Guide Overview., Accessed September
16, 2011. Available at: http://code.google.com/apis/gdata/docs/developers-guide.html.
11. Gu W, Wang X, McGregor SE:Optimization of preventive health care facility locations.Int J Health Geog2010,9:17.
12. Cinnamon J, Schuurman N:Injury surveillance in low-resource settings using geospatial and social web technologies.Int J Health Geog2010,
9:25.
13. Yi Q, Hoskins RE, Hillringhouse EA, Sorensen SS, Oberle MW, Fuller SS, Wallace JC:Integrating open-source technologies to build low-cost information systems for improved access to public health data.Int J Health Geog2008,7:29.
14. Kamel Boulos MN, Viangteeravat T, Anyanwu MN, Nagisetty VR, Kuscu E:
Web GIS in practice IX: a demonstration of geospatial visual analytics using Microsoft Live Labs Pivot technology and WHO mortality data.Int J Health Geog2011,10:19.
15. Chang AY, Parrales ME, Jimenez J, Sobieszcyzk ME, Hammer SM, Copenhaver DJ, Kulkarni RP:Combining Google Earth and GIS mapping technologies in a dengue surveillance system for developing countries.
Int J Health Geog2009,8:49.
16. Kamel Boulos MN:Web GIS in practice III: creating a simple interactive map of England’s strategic health authorities using Google maps API, Google Earth KML and MSN virtual earth map control.Int J Health Geog
2005,4:22.
17. City of Houston:Houston Facts and Figures., Accessed October 20, 2011. Available at: http://www.houstontx.gov/abouthouston/houstonfacts.html. 18. Anselin L, Lozano N, Koschinsky J:Rate Transformations and Smoothing.
2006, Accessed September 16, 2011. Available at: http://geodacenter.asu. edu/pdf/smoothing_06.pdf.
19. Clayton D, Kaldor J:Empirical Bayes Estimates of Age-Standardized Relative Risks for Use in Disease Mapping.Biometrics1987,43:671-681. 20. Marshall RJ:Mapping disease and mortality rates using empirical bayes
estimators.Applied Statistics1991,40:283-294.
doi:10.1186/1476-072X-10-69
Cite this article as:Highfieldet al.:Interactive web-based mapping: bridging technology and data for health.International Journal of Health Geographics201110:69.
Submit your next manuscript to BioMed Central and take full advantage of:
• Convenient online submission
• Thorough peer review
• No space constraints or color figure charges
• Immediate publication on acceptance
• Inclusion in PubMed, CAS, Scopus and Google Scholar
• Research which is freely available for redistribution