R E S E A R C H
Open Access
Built environment and physical activity
among adolescents: the moderating effects
of neighborhood safety and social support
Venurs H. Y. Loh
1*, Jenny Veitch
1, Jo Salmon
1, Ester Cerin
2, Lukar Thornton
1, Suzanne Mavoa
3,
Karen Villanueva
4and Anna Timperio
1Abstract
Background:Increasing emphasis has been placed on improving physical activity levels through multilevel interventions. This study aims to examine moderating effects of neighborhood safety (crime and traffic) and social support (from parent and sibling/peer) for physical activity in the relationship between the built environment and moderate-to-vigorous physical activity (MVPA) outside school hours among adolescents in Melbourne.
Methods:Data were from the NEighbourhood Activity in Youth study conducted among adolescents in Melbourne, Australia (n= 358, 15.3 (SD = 1.5) years). MVPA outside school hours was assessed by accelerometer. Built environment features within 1 km and 2 km residential buffers including recreation facilities, park area, and walkability and its components were assessed using Geographic Information Systems. Neighborhood safety, social support for physical activity and sociodemographic information were self-reported by adolescents. Multilevel linear regression models were used to estimate associations.
Results:Support for physical activity from sibling/peer positively moderated the relationship between recreation facilities (1 km), residential density (2 km) and MVPA. Recreation facility (count within 2 km), walkability (1 km and 2 km) and residential density (1 km) had significant positive associations with MVPA outside school hours.
Conclusion:The built environment appeared to have stronger facilitating effects on MVPA among adolescents who had favourable support for physical activity from their sibling or peer. Multilevel interventions that target the built environment and social factors are needed to promote MVPA outside school hours among adolescents.
Keywords:Built environment, Walkability, Physical activity, Adolescent, Ecological models, Multilevel analysis
Introduction
Globally, 80% of adolescents (aged 13–17) do not meet the moderate-to-vigorous physical activity (MVPA) guidelines of 60 min per day [1] and 17% are overweight or obese [2]. Despite numerous interven-tions developed to promote physical activity, which often focus on individual behavior change, most interventions have moderate-to-small effects on objectively-measured MVPA (average 4 min/day) [3]. Understanding the determinants of physical activity among adolescents, particularly beyond intrapersonal
influences, is essential for the development of effect-ive public health interventions to produce long term health benefits.
Socioecological models highlight that there are mul-tiple physical environmental influences on physical activ-ity [4]. The current evidence on the relationship between the built environment and physical activity is less consistent among adolescents than adults [5]. Re-views [5] have reported consistent relationships between some features of the built environment (e.g., availability of recreation facilities and mixed land use) and youth physical activity, but inconsistent associations with other built environment features (e.g., street connectivity and walkability). These inconsistencies may in part be due to
© The Author(s). 2019Open AccessThis article is distributed under the terms of the Creative Commons Attribution 4.0 International License (http://creativecommons.org/licenses/by/4.0/), which permits unrestricted use, distribution, and reproduction in any medium, provided you give appropriate credit to the original author(s) and the source, provide a link to the Creative Commons license, and indicate if changes were made. The Creative Commons Public Domain Dedication waiver (http://creativecommons.org/publicdomain/zero/1.0/) applies to the data made available in this article, unless otherwise stated.
* Correspondence:[email protected]
1Institute for Physical Activity and Nutrition (IPAN), School of Exercise and Nutrition Sciences, Deakin University, Geelong, Australia
the use of different measures of the built environment [6] or due to potential moderation by other factors.
In recent years, there has been an increased emphasis on the role of the social environment as a key modifiable determinant of physical activity [7]. Studies on adults from the United States and older adults from China found significant interactions between some features of the built environment (e.g., walkability and parks) and perceived pedestrian safety on physical activity [8, 9]. For example, activity-friendly built environments were associated with higher physical activity among adults who perceived their neighborhoods to be safer compared to those who perceived their neighborhoods to be less safe [8,9]. However, in contrast to these findings among adults, only one known adolescent study from the US has examined this relationship and no significant inter-actions between neighborhood safety and the built envir-onment on physical activity were observed. In addition, social support for physical activity from friends and fam-ily was found to be a potential moderator of associations between the built environment and physical activity in adults [10]. However, evidence of interactive effects of walkability and social support on physical activity among adolescents is limited and the findings are mixed: a sig-nificant interaction was found among US adolescents [11] but not among Belgium adolescents [12]. The lack of studies and inconsistent findings among adolescents warrants further investigation.
Studies investigating the moderating effects of social factors on the built environment-physical activity rela-tionship are needed to better understand the conditions under which built environment attributes are associated with physical activity, which in turn can help to develop effective multilevel interventions to increase MVPA among adolescents. This cross-sectional study examined whether perceived neighborhood safety (crime and traf-fic) and social support for physical activity from parents, peers and siblings moderated associations between the built environment and MVPA. It was hypothesized that the positive effect of supportive built environments on MVPA would be stronger among individuals with higher perceived safety and social support.
Methods
Study population
This investigation used data collected between August 2014 and December 2015 from the NEighbourhood Ac-tivity in Youth (NEArbY) study, which included adoles-cents living in Melbourne, Australia. It is part of the multi-country IPEN Adolescent (International Physical Activity and the Environment Network Adolescent; http://www.ipenproject.org/IPEN_adolescent.html) pro-ject. Ethical clearance was obtained from the Human Ethics Advisory Committee - Health, Deakin University
(HEAG-H 152_2013), the Department of Education and Training (2013_002182) and the Catholic Education Of-fice (Project #1950).
School and participant recruitment
In Australia, a statistical area level 1 (SA1) is the smal-lest administrative unit used by the Australian Bureau of Statistics (ABS) to release census data, with an average population of ~ 400 individuals [13]. To optimize het-erogeneity in built environment and socioeconomic-position, each SA1 across Melbourne was ranked by walkability and income. The walkability index was cre-ated in a geographic information system (GIS) based on earlier conceptual work from Frank et al. [14] that com-bines a standardized sum of street connectivity, land use mix and residential density. Income was based on the median household income within the SA1 from the 2011 census data [15]. Each SA1 was classified into one of four strata: high walkable/high income (HW/HI), high walkable/low income (HW/LI), low walkable/high in-come (LW/HI) and low walkable/low inin-come (LW/LI), based on median values of walkability and income, respectively.
A total of 137 secondary schools from the four strata were invited to participate in the NEArbY study. Of these, 18 schools agreed to participate (13% school re-sponse rate). The schools nominated specific year levels (between years 7 and 12) and interested students re-ceived a recruitment package, which included informa-tion about the study, a consent form and parent survey. Written parental consent and student assent were re-ceived from 528 participants. Of these, 468 students completed an online survey at school and 472 wore an Actigraph accelerometer. Parents also completed a sur-vey (only used in this analysis to provide missing data for age). In total, 465 of those who completed a survey had their residential address successfully geocoded. Based on the SA1 of residential addresses, similar pro-portions of students in the analytical sample resided in each of the four walkability-income strata (HW/HI = 23%, LW/HI = 25%, HW/LI = 28% and LW/LI = 24%).
Measures
Physical activity outside school hours
defined as the number of minutes spent at ≥4 METS using the Trost et al. [18] age-appropriate cut-points for adolescents. Non-wear periods were determined by≥60 min of consecutive zeros [19] and subtracted from each 24-h day and period of interest. On weekdays, time spent in MVPA outside of school hours (before school, after school and evenings) was computed for days on which participants had≥50% wear time [20] in the after school period (end of school to 6 pm). On weekend days, total time spent in MVPA was computed for those with≥7 h of wear time. Average MVPA and wear time (minutes/ day) outside school hours was computed for those with valid data for outside school hours on at least three valid weekdays (outside school hours) and those with at least one valid weekend day. School hours were excluded as it is unlikely that the neighborhood environment would in-fluence MVPA during this time.
Objectively measured built environment
The IPEN GIS templates were used to guide the compu-tation of objective indicators of built environments and to ensure comparability across countries [21]. Each par-ticipant’s home address was geocoded using ESRI Arc-GIS 10.3. Street network buffers of 1 km and 2 km were created around each residential address using street cen-treline data sourced from VicMap Transport [22] and processed to remove non-walkable roads (freeways, on/ off ramps). While there is no consensus on the most ap-propriate buffer size, 1 km and 2 km represent walkable or threshold distances for adolescents [23], and were prescribed by the IPEN adolescent study GIS guidelines.
Recreation facilities
Defined as a count of publicly-funded recreational facil-ities (e.g., soccer fields, basketball courts) within each buffer. Recreational facility data were compiled from a range of sources [24,25].
Park area
The total park area (m2) of all parks that intersected each buffer was calculated. Parks included protected areas, natural and semi-natural areas, parkland and gar-dens, organized recreation areas, services and utilities areas, civic squares and promenades [24].
Walkability and walkability components
For analyses, the walkability index was computed as a sum of three standardized measures from GIS computed at the 1 km and 2 km street network buffers: street inter-sections, gross dwelling density and land use mix [26]. The total number of street intersections with ≥3 legs within each buffer was calculated using Vicmap Trans-port [22]. Gross residential density was calculated as the number of dwellings divided by residential area within
the buffer (dwelling/m2). Meshblock level (smallest geo-graphical area defined by the ABS) residential dwelling data were sourced from the 2011 census [27]. For this analysis, residential density was multiplied by 10,000 so the coefficient is interpreted as one dwelling increase per hectare. Within each buffer, the area of four land uses (residential, commercial, entertainment and institu-tional) were extracted to compute land use mix. Land use data were compiled from a range of sources (Axiom Business Points [28]; 2010 Victorian Valuer General’s Office valuations database [29]; Metro ARIA TAFE loca-tions [30]; National Health Service Directory [31]; and VEAC Public Open Space Inventory [24]). The formula for land use mix was provided by Giles-Corti et al. [26]. The land use mix score ranges between 0 and 1. A score of 0 indicates that a buffer has a single land use and a score of 1 indicates that the area has an even distribu-tion of all land uses.
Potential moderators Perceived safety from crime
Perceived safety from crime was measured using modi-fied scales from the Neighborhood Environment Walk-ability Scale-Youth (NEWS-Y) questionnaire, which has acceptable reliability (test-retest intraclass correlation coefficients [ICC] = 0.73 to 0.75) [32]. Participants were asked to respond to seven statements on a 4-point Likert scale (1 = strongly disagree; 4 = strongly agree) about the level of crime in their neighborhood and fear of abduc-tion or attack by strangers around home, outside with friends on local streets, and in a local/nearby park. Sum-mary scores were computed by averaging the scores on the corresponding items (reverse coded where necessary in the direction consistent with higher safety from crime). Internal consistency evaluated with the current sample wasα= 0.85, which was similar to that observed in Hong Kong adolescents (α= 0.82) [32].
Perceived traffic-related safety and pollution
scores on the corresponding items (reverse coded where necessary).
Perceived parent support for physical activity
Parent support was assessed by four items pertaining to encouragement of physical activity, provision of trans-portation, co-participation in physical activity and pay-ment for sporting clubs (adapted from Norman et al. [33] for the IPEN Adolescent Study [32], with acceptable reliability (ICC = 0.79) [32]). Frequency of parent sup-port was rated on a 4-point Likert scale ranging from never (coded 0) to very often (coded 4). Scores for each item were summed. Total scores could range from zero to 16. Internal consistency of the items evaluated with the current sample was higher (α= 0.81) than observed in a previous study (α= 0.68) [32].
Perceived sibling or peer support for physical activity The siblings or peer support scale was also adapted from Norman et al. [33] and included two items that assessed (a) companionship for physical activity and (b) offers to walk or ride to school or friend’s house. Frequency of social support was rated on a 4-point Likert scale ran-ging from never (coded 0) to very often (coded 4). Scores for each item were summed. Total scores could range from zero to eight. The test-retest reliability of this scale was acceptable (ICC = 0.74) [32]. Internal consistency of the items evaluated with the current sam-ple was higher (α= 0.72) than in a previous study (α= 0.69) [32].
Covariates
Age (years) and sex were self-reported by the adoles-cents. Missing information on adolescent age was sup-plemented from the parents survey (n = 7). Information on residential neighborhood disadvantage was obtained from the ABS SEIFA Index of Relative Socioeconomic Disadvantage [34], reflecting the overall level of disad-vantage at the SA1 level.
Statistical analyses
Of the 465 participants, those who did not provide valid accelerometer data (n = 97), or information about age (n= 5) and sex (n = 5) were excluded. This reduced the analytic sample to 358 participants.
First, separate multilevel linear models were conducted to examine associations between each built environment variable and MVPA, accounting for age, sex, neighbor-hood disadvantage and accelerometer wear time. School ID and neighborhood SA1s were entered as random ef-fect variables to account for cross-classified clustering. Moderating effects of neighborhood safety (crime and traffic) and social support (parent, sibling/peer) on asso-ciations between the built environment and MVPA were
then estimated by adding a two-way interaction term to the main effects in the first step for each built environ-ment exposure separately. Third, significant moderation effects were probed by estimating associations at mean-ingful values of moderators (mean ± 1SD) and were pre-sented graphically (predicted MVPA [minutes/day] plotted against the minimum and maximum of built en-vironment variables at meaningful values of the modera-tors). Data analyses were undertaken using STATA/SE 15.0.
Results
The mean age was 15.3 (SD = 1.5) years and 59% were girls. On average, participants spent 25.1 min/day (SD = 14.9) in MVPA outside school hours on weekdays and 24.3 min/day (SD = 20.7) in MVPA on weekend days. There were no significant differences in MVPA accumu-lated outside school hours on weekdays and MVPA ac-cumulated on weekend days (p = 0.56). The average wear time outside school hours on weekdays and week-end days were 441 and 1317 min per day, respectively.
Table1presents descriptive statistics for each objectively-assessed built environment variable and scores for self-reported safety from crime, traffic-related safety and pollution, parent support and sibling/peer support. Walkability and land use mix had similar mean values within the 1 km and 2 km buffer, residential density had lower mean values in the 2 km buffer than the 1 km buffer, while the remaining environmental vari-ables had higher mean values in the 2 km buffer than the 1 km buffer.
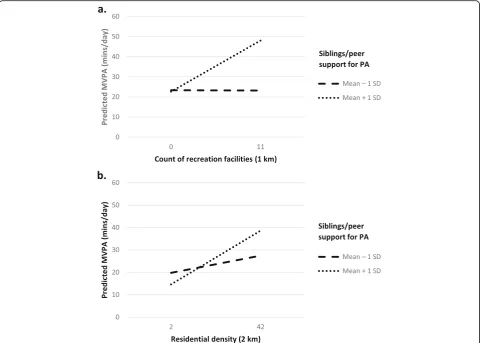
Sibling/peer support was the only moderator of associa-tions between the objective built environment variables and MVPA outside school hours (Table 2). In general, there were stronger positive associations between recre-ation facilities within 1 km and residential density within 2 km and MVPA for those with higher levels of sibling/ peer support, compared to those with less support (Fig.1). For recreation facilities within 1 km, associations were b =
−0.01 (95% CI:−1.07, 1.06,p= 0.9) for participants with lower and b = 2.19 (95% CI: 0.86, 3.52, p = 0.001) for participants with higher sibling/peer support. For resi-dential density within 2 km and MVPA, associations were b = 0.19 (95% CI: −0.10, 0.50, p = 0.50) at lower and b = 0.58 (95% CI: 0.26, 0.91, p = < 0.001) at higher sibling/peer support. Parent support for physical ac-tivity, perceived crime and traffic-related safety and pollution did not moderate associations between the built environment and MVPA.
of school hours. There were no significant associations be-tween MVPA and park area, street intersections or land use mix for either buffer size.
Discussion
The main aim of the study examined whether the as-sociations between built environment features and objectively-assessed MVPA were moderated by neigh-borhood safety and social support for physical activity. Overall, two aspects of the built environment ap-peared to have stronger facilitating effects on MVPA among adolescents who had favorable support from their siblings or peers. Walkability within 1 and 2 km, residential density within 1 km and recreation facilities within 2 km showed positive associations with MVPA that were not moderated by neighborhood safety or social support.
Our findings showed that built environment features had interactive effects with social support on MVPA. Positive associations between recreation facilities, resi-dential density and MVPA were found among those with the highest sibling/peer support. This pattern of interac-tions suggests that while the built environment can sup-port MVPA, the relationship may vary according to the perceived level of social support. This is not surprising given that adolescents are not totally independent and may rely on others for encouragement for MVPA oppor-tunities, particularly outside school hours. Our finding is in agreement with a previous study among US adoles-cents which found a positive interaction between walk-ability and social support on MVPA [11].
Contrary to our hypothesis, adolescents’perception of safety from crime and traffic did not moderate associa-tions between the built environment and MVPA. The Table 1Descriptive information for the analytical sample
1 km buffer 2 km buffer
N Mean (SD) Range Mean (SD) Range
Objectively assessed built environment variables
Recreation facilities (n) 358 1.4 (1.7) 0.0–11.0 5.2 (5.0) 0.0–30.0
Park area (km2) 358 0.4 (0.8) 0.0–5.8 1.2 (1.3) 0.0–9.7 Walkability scorea 358 −0.1 (2.2) −5.7- 10.0 −0.1 (2.3) −6.7-9.6 Street intersection (n)b 358 88.8 (41.9) 6.0–289 349.1 (163.2) 25.0–1209.0 Residential density (dwelling/ha) 358 25.7 (8.3) 3.9–60.4 20.6 (6.8) 1.8–42.0
Land use mixc 358 0.4 (0.2) 0.0–0.9 0.5 (0.1) 0.0–0.9 Mean (SD) Range
Potential moderators
Perceived safety from crimed 358 3.4 (0.6) 1.3–4.0 Perceived traffic-related safety and pollutione 357 3.0 (0.4) 1.5–4.0 Perceived parent support for PAf 357 9.2 (4.1) 0.0–16.0 Perceived sibling/peer support for PAg 355 3.7 (2.2) 0.0–8.0 Note:SDStandard deviation,PAPhysical activity;a
standardized sum of street intersections, residential density and land use mix;b
count of three or more way street intersections;c
mix of land use based from 0 to 1;d
higher value indicates safest from crime;e
higher value indicates safest from traffic-related safety and pollution;fhigher value indicates better parent support for physical activity;ghigher value indicates better sibling/peer support for physical activity
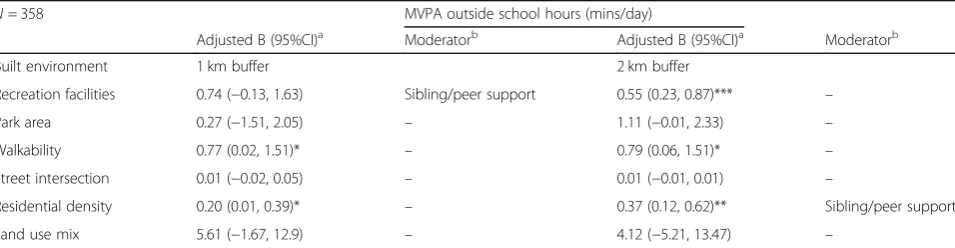
Table 2Associations between built environment (1 km and 2 km network buffers) and moderate-to-vigorous physical activity (MVPA) outside school hours (minutes/day) among adolescents (B coefficient and 95% confidence intervals)
N= 358 MVPA outside school hours (mins/day)
Adjusted B (95%CI)a Moderatorb Adjusted B (95%CI)a Moderatorb
Built environment 1 km buffer 2 km buffer
Recreation facilities 0.74 (−0.13, 1.63) Sibling/peer support 0.55 (0.23, 0.87)*** –
Park area 0.27 (−1.51, 2.05) – 1.11 (−0.01, 2.33) –
Walkability 0.77 (0.02, 1.51)* – 0.79 (0.06, 1.51)* –
Street intersection 0.01 (−0.02, 0.05) – 0.01 (−0.01, 0.01) –
Residential density 0.20 (0.01, 0.39)* – 0.37 (0.12, 0.62)** Sibling/peer support
Land use mix 5.61 (−1.67, 12.9) – 4.12 (−5.21, 13.47) –
Notes:CIConfidence interval;a
Adjusted for age, sex, neighborhood disadvantage and accelerometer wear time;b
small variation and high mean scores for neighborhood safety suggests potential ceiling effects. Further, although the sample was drawn from areas of different socioeco-nomic status, the small variation in neighborhood safety scores may have limited the ability to observe statisti-cally significant interactions, leading to an underestima-tion of interacunderestima-tions between individual exposure and the built environment.
Our findings showed positive, albeit relatively weak associations between recreation facilities (2 km), walk-ability (1 and 2 km), residential density (1 km) and MVPA outside school hours. The association between recreation facilities and MVPA is consistent with pre-vious studies conducted among adolescents [35, 36]. The positive association between residential density, walkability and MVPA among adolescents is also con-sistent with studies from New Zealand [37] and the U.S. [38]. However, no significant associations were observed between park area, street connectivity, land use mix and MVPA outside school hours. The non-significant relationship between street connectivity and MVPA is consistent with two previous studies
intensity activities, such as sitting or standing. There-fore, stronger associations may be observed between park area and light-intensity activity.
Our study explored associations of the built environ-ment with MVPA using two buffer sizes. Many studies on the built environment and physical activity have used a 1.6 km (1 mile) buffer size, as this is a comfortable walking distance for adolescents [44]. However, re-searchers have cautioned the use against a single buffer size as the concept of reasonable walking distance may vary by age group [6, 44]. Given our sample was adoles-cents, and the count of certain built environment vari-ables within 1 km buffers was small, the 2 km buffer seemed to be a more sensitive buffer size to understand the effect of the built environment and MVPA in a city such as Melbourne. Defining and choosing the most ap-propriate buffer size to measure meaningful differences in the built environment and health behavior is an on-going challenge.
Limitations
The cross-sectional nature of the study means that claims about causality are not possible. Longitudinal studies or natural experiments would add strength to the study findings. The accelerometer-assessed MVPA measure lacked specificity as it was not possible to dis-tinguish between activity undertaken in the neighbor-hood or elsewhere and the MVPA assessed may not have occurred within the neighborhood. The MVPA measure was also unable to discriminate between phys-ical activity domains (e.g., leisure or transport), which may lead to the conceptual mismatch between the built environment and physical activity. It is therefore likely that the associations we reported in this study are underestimated. Incorporating data from Global Posi-tioning Systems as well as domain-specific information would help identify where and which domain of physical activity have occurred, which are important consider-ations for future research. In addition, it is possible that physical activity accumulated in the neighborhood may not meet the intensity needed to be defined as MVPA using the criteria applied in this study, which may ex-plain the weak associations found. The lack of concep-tual match between physical activity domain and environmental attributes information is subject to bias associated with conceptual mismatch. Further, the GIS-computed built environment measures were unable to capture the quality, conditions and actual destinations (particularly for land use mix), which have been shown to be important for physical activity among adults and older adults [45]. The exact information on response rate was unavailable for the study and this may have im-plications on sample generalizability. Finally, data on perceived neighborhood safety and social support
variables were self-reported by adolescents, and there-fore subject to recall and/or desirability bias [46].
Conclusion
Some features of the neighborhood built environment have the potential to support MVPA among adolescents. Of all life stages, adolescence is the period with most profound changes, including changes in the focus of so-cial relationships from parents to peers. Strongest associ-ations between the built environment and MVPA were found among those with the highest level of social sup-port from sibling or peer. These findings imply that multilevel interventions that target both the built envir-onment and social support may be needed to maximize active behaviors among adolescents outside school hours.
Abbreviations
ABS:Australian bureau of statistics; GIS: Geographic information systems; ICC: Intraclass correlation coefficients; IPEN: International physical activity and the environment network adolescent; MVPA: Moderate-to-vigorous physical activity; NEArbY: NEighbourhood activity in youth; PA: Physical activity; SA1: Statistical area level 1; SD: Standard deviation
Acknowledgements
The authors would like to thank all research staff involved in the NEArbY study, and Carl Higgs for assistance with the spatial data and analysis. Spatial data was provided by the State Government of Victoria, Sports Victoria and Pitney Bowes Ltd. We also acknowledge the Australian Urban Research Infrastructure Network (AURIN) for assistance in accessing some of the spatial datasets.
Authors’contributions
VL conceptualized the research question, contributed to the analytical approach, interpreted results, drafted and edited the manuscript. AT and JV contributed to research question, analytical approach, interpretation of results. EC contributed to the design of analysis and interpretation of results. SM contributed to the spatial data and interpretation of results. All authors critically commented on drafts of the manuscript and approved the final version.
Funding
The NEArbY study received funding from the National Institutes of Health (NIH) R01 HL111378. JV is supported by an Australian National Heart Foundation Future Leader Fellowship (ID 101928). JS was supported by a National Health and Medical Research Council (NHMRC) Principal Research Fellowship (APP1026216) during this study. EC is supported by an Australian Research Council Future Fellowship (FT14010085). SM is supported by an Australian NHMRC Early Career Fellowship (#1121035). AT was supported by a National Heart Foundation Future Leader Fellowship (Award 100046) during the study.
Availability of data and materials
The dataset used and/or analyzed during the current study are available from the corresponding author on reasonable request.
Ethics approval and consent to participate
The Human Ethics Advisory Committee - Health, Deakin University (HEAG-H 152_2013), the Department of Education and Training (2013_002182) and the Catholic Education Office (Project #1950) approved this study. Written informed parental consent and student assent for participation was obtained from participants.
Consent for publication
Competing interests
The authors declare that they have no competing interests.
Author details
1Institute for Physical Activity and Nutrition (IPAN), School of Exercise and Nutrition Sciences, Deakin University, Geelong, Australia.2Mary MacKillop Institute for Health Research, Australian Catholic University, Melbourne, Australia.3Melbourne School of Population and Global Health, The University of Melbourne, Melbourne, Australia.4The Centre for Urban Research, RMIT University, Melbourne, Australia.
Received: 16 July 2019 Accepted: 10 December 2019
References
1. World Health Organization. Physical activity. Available at:https://www.who. int/news-room/fact-sheets/detail/physical-activity2019.
2. World Health Organization. Prevalence of overweight among children and adolescents, BMI >+1 standard deviation above the median, crude. Available at:http://apps.who.int/gho/data/view.main.
BMIPLUS1CREGv?lang=en .
3. Metcalf B, Henley W, Wilkin T. Effectiveness of intervention on physical activity of children: systematic review and meta-analysis of controlled trials with objectively measured outcomes. BMJ. 2012;345:e5888.
4. Sallis JF, Cervero RB, Ascher W, et al. An ecological approach to creating active living communities. Annu Rev Public Health. 2006;27:297–322. 5. Ding D, Sallis JF, Kerr J, et al. Neighborhood environment and physical
activity among youth: a review. Am J Prev Med. 2011;41:442–55. 6. Brownson RC, Hoehner CM, Day K, et al. Measuring the built
environment for physical activity: state of the science. Am J Prev Med 2009;36:S99-S123. e112.
7. McNeill LH, Kreuter MW, Subramanian S. Social environment and physical activity: a review of concepts and evidence. Soc Sci Med. 2006;63:1011–22. 8. Bracy NL, Millstein RA, Carlson JA, et al. Is the relationship between the built
environment and physical activity moderated by perceptions of crime and safety? Int J Behav Nutr Phys Act. 2014;11:24.
9. Cerin E, Lee K-y, Barnett A, et al. Objectively-measured neighborhood environments and leisure-time physical activity in Chinese urban elders. Prev Med. 2013;56:86–9.
10. Carlson JA, Sallis JF, Conway TL, et al. Interactions between psychosocial and built environment factors in explaining older adults' physical activity. Prev Med. 2012;54:68–73.
11. D’Angelo H, Fowler SL, Nebeling LC, et al. Adolescent physical activity: moderation of individual factors by neighborhood environment. Am J Prev Med. 2017;52:888–94.
12. De Meester F, Van Dyck D, De Bourdeaudhuij I, et al. Do psychosocial factors moderate the association between neighborhood walkability and adolescents' physical activity? Soc Sci Med. 2013;81:1–9.
13. Australian Bureau of Statistics. Australian Statistical Geography Standard (ASGS): Volume 1 - Main Structure and Greater Capital City Statistical Areas. Available at:http://www.abs.gov.au/ausstats/[email protected]/Lookup/by%2 0Subject/1270.0.55.001~July%202016~Main%20Features~Statistical%2 0Area%20Level%201%20(SA1)~10013 .
14. Frank LD, Schmid TL, Sallis JF, et al. Linking objectively measured physical activity with objectively measured urban form. Am J Prev Med. 2005;28: 117–25.
15. Australian Bureau of Statistics. Basic Community Profile Release 1: SA1, DataPacks; 2011. Available at:https://www.abs.gov.au/websitedbs/ censushome.nsf/home/datapacksdetails?opendocument&navpos=250. 16. De Vries S, Van Hirtum H, Bakker I, et al. Validity and reproducibility of
motion sensors in youth: a systematic update. Med Sci Sports Exerc. 2009; 41:818.
17. De Vries S, Bakker I, Hopman-Rock M, et al. Clinimetric review of motion sensors in children and adolescents. J Clin Epidemiol. 2006;59:670–80. 18. Trost SG, Pate RR, Sallis JF, et al. Age and gender differences in objectively
measured physical activity in youth. Med Sci Sports Exerc. 2002;34:350–5. 19. Chinapaw MJ, de Niet M, Verloigne M, et al. From sedentary time to
sedentary patterns: accelerometer data reduction decisions in youth. PLoS One. 2014;9:e111205.
20. Cain KL, Sallis JF, Conway TL, et al. Using accelerometers in youth physical activity studies: a review of methods. J Phys Act Health. 2013;10:437–50.
21. Adams MA, Frank LD, Schipperijn J, et al. International variation in neighborhood walkability, transit, and recreation environments using geographic information systems: the IPEN adult study. Int J Health Geogr. 2014;13:43.
22. State Government of Victoria: Vicmap Transport. Road network 2013. 23. Garrard J. Young people and walking. Victoria Walks and YACVic,
Melbourne, Australia; 2017.
24. Victorian Environmental Assessment Council, State Government of Victoria. Public Open Space Inventory. Victoria; 2011.
25. State Government of Victoria: Vicmap Property. Parcel boundaries 2013. 26. Giles-Corti B, Macaulay G, Middleton N, et al. Developing a research and
practice tool to measure walkability: a demonstration project. Health Promot J Austr. 2014;25:160–6.
27. Australian Bureau of Statistics. Census of Population and Housing: Mesh Block Counts; 2011. Available at:http://www.abs.gov.au/ausstats/[email protected]/ Lookup/2074.0main+features12011..
28. Pitney Bowes Ltd. Axiom business points. Sydney: Pitney Bowes Ltd; 2014. 29. Valuer-General V. State of Victoria: valuation system. Melbourne, Vic: Valuer
General Office; 2010.
30. Australian Population and Migration Research Centre. Metro ARIA TAFE locations. Australian Capital City TAFE Campuses, Victoria; 2015. 31. Healthdirect Australia. National Health Service Directory. National health
service directory, 2015.
32. Cerin E, Sit CHP, Barnett A, et al. Reliability of self-report measures of correlates of obesity-related behaviours in Hong Kong adolescents for the iHealt(H) and IPEN adolescent studies. Arch Public Health. 2017;75:38. 33. Norman GJ, Sallis JF, Gaskins R. Comparability and reliability of paper- and
computer-based measures of psychosocial constructs for adolescent physical activity and sedentary behaviors AU - Norman, Gregory J. Res Q Exerc Sport. 2005;76:315–23.
34. Australian Bureau of Statistics. Census of Population and Housing: Socio-Economic Indexes for Areas (SEIFA). Australia; 2011.
35. Cohen DA, Han B, Kraus L, et al. The contribution of the built environment to physical activity among young women. Environ Behav. 2018; 0013916517753036.
36. Sallis JF, Conway TL, Cain KL, et al. Neighborhood built environment and socioeconomic status in relation to physical activity, sedentary behavior, and weight status of adolescents. Prev Med. 2018;110:47–54. 37. Hinckson E, Cerin E, Mavoa S, et al. Associations of the perceived and
objective neighborhood environment with physical activity and sedentary time in New Zealand adolescents. Int J Behav Nutr Phys Act. 2017;14:145. 38. Carlson JA, Saelens BE, Kerr J, et al. Association between neighborhood
walkability and GPS-measured walking, bicycling and vehicle time in adolescents. Health Place. 2015;32:1–7.
39. Jago R, Baranowski T, Baranowski JC. Observed, GIS, and self-reported environmental features and adolescent physical activity. Am J Health Promot. 2006;20:422–8.
40. Mota J, Almeida M, Santos P, et al. Perceived neighborhood environments and physical activity in adolescents. Prev Med. 2005;41:834–6.
41. Mecredy G, Pickett W, Janssen I. Street connectivity is negatively associated with physical activity in Canadian youth. Int J Environ Res Public Health. 2011;8:3333–50.
42. Saelens BE, Handy SL. Built environment correlates of walking: a review. Med Sci Sports Exerc. 2008;40:S550.
43. Veitch J, Carver A, Abbott G, et al. How active are people in metropolitan parks? Observational Study Park Visitation Aust BMC Public Health. 2015;15:610. 44. Colabianchi N, Coulton CJ, Hibbert JD, et al. Adolescent self-defined
neighborhoods and activity spaces: spatial overlap and relations to physical activity and obesity. Health Place. 2014;27:22–9.
45. Barnett DW, Barnett A, Nathan A, et al. Built environmental correlates of older adults’total physical activity and walking: a systematic review and meta-analysis. Int J Behav Nutr Phys Act. 2017;14:103.
46. Grimes DA, Schulz KF. Bias and causal associations in observational research. Lancet. 2002;359:248–52.
Publisher’s Note