R E S E A R C H
Open Access
Tracking and visualization of space-time activities
for a micro-scale flu transmission study
Feng Qi
1*†and Fei Du
2†Abstract
Background:Infectious diseases pose increasing threats to public health with increasing population density and more and more sophisticated social networks. While efforts continue in studying the large scale dissemination of contagious diseases, individual-based activity and behaviour study benefits not only disease transmission modelling but also the control, containment, and prevention decision making at the local scale. The potential for using tracking technologies to capture detailed space-time trajectories and model individual behaviour is increasing rapidly, as technological advances enable the manufacture of small, lightweight, highly sensitive, and affordable receivers and the routine use of location-aware devices has become widespread (e.g., smart cellular phones). The use of low-cost tracking devices in medical research has also been proved effective by more and more studies. This study describes the use of tracking devices to collect data of space-time trajectories and the spatiotemporal processing of such data to facilitate micro-scale flu transmission study. We also reports preliminary findings on activity patterns related to chances of influenza infection in a pilot study.
Methods:Specifically, this study employed A-GPS tracking devices to collect data on a university campus.
Spatiotemporal processing was conducted for data cleaning and segmentation. Processed data was validated with traditional activity diaries. The A-GPS data set was then used for visual explorations including density surface visualization and connection analysis to examine space-time activity patterns in relation to chances of influenza infection.
Results:When compared to diary data, the segmented tracking data demonstrated to be an effective alternative and showed greater accuracies in time as well as the details of routes taken by participants. A comparison of space-time activity patterns between participants who caught seasonal influenza and those who did not revealed interesting patterns.
Conclusions:This study proved that tracking technology an effective technique for obtaining data for micro-scale influenza transmission research. The findings revealed micro-scale transmission hotspots on a university campus and provided insights for local control and prevention strategies.
Keywords:Tracking technology, Space-time activity, GPS, Individual behaviour, Influenza, Micro-scale, Disease transmission
* Correspondence:[email protected]
†Equal contributors
1
School of Environmental and Life Sciences, Kean University, 1000 Morris Ave., Union, NJ 07083, USA
Full list of author information is available at the end of the article
Background
Infectious disease transmission
The diffusion of a contagious disease traverses various scales from the local and regional to the global [1]. Mathe-maticians and geographers have long studied the spatio-temporal transmission of infectious diseases from different perspectives with numerical models [2-8], graph or map-ping tools [9-11]. Recent outbreaks of highly communi-cable diseases [7,12-15] have triggered a marked rise in the number of studies on infectious disease transmissions [16], with equal amount of attention on the mechanisms of global disease spread [3,8,17], and at the regional scale of within countries or cities [4-7,13,18-21]. Only limited research, however, was reported at the micro scale, such as in the environment exemplified by a relatively closed campus, small community, school, residential, or hospital buildings with a few exceptions [22,23].
It is well recognized that human movement in the spatial and temporal dimensions has direct influence on disease transmission [18,24-27]. An infectious disease typically spreads via contact between infected and sus-ceptible individuals in their overlapped activity spaces. Therefore, daily mobility-activity information can be used as an indicator to measure exposures to risk factors of infection. A major difficulty and thus the reason for paucity of studies of infectious disease transmission at the micro scale in the past was the lack of detailed indi-vidual mobility and exposure data. Since the records of small-scale movements and contacts between people were generally not available with only a few exceptions [22,23,28,29], studies of infectious disease were often aggregates in space and time [5].
Tracking technology
Research on individual human space-time behaviour started first in the social sciences [30-36]. Previously in tourism research, transportation studies and shopping behaviour studies detailed space-time activity data often relied on the time-space diary technique, which requires subjects to actively record his or her activities in time and space. This method is highly demanding for the par-ticipants and collaboration from the parpar-ticipants greatly affects the quality of data [34,37].
Over the past decade, technology has transformed researchers’ability to gather quantitative data on human activities. Global positioning systems (GPS), mobile communications, and wireless network make possible the tracking of human and object movements, generat-ing large amounts of data with unprecedented quality and timeliness at relatively low cost. Applications of these technologies started to flourish in transportation research [38], retail studies [35], human ecology [36], and more recently, health related studies [27,39-54]. Examples of health related studies include investigating
human mobility affected by diseases or surgeries or in young or aged populations [39-46], studying physical ac-tivity and the environment [48-51], and defining specific geographic contexts [52,53] or an operational“ neighbour-hood”in place-based health studies [54]. Kwan [52,53] has suggested that examining space-time activity spaces of individuals can lead to more accurate exposure measures. A couple of studies have attempted to track exposures to health risk factors related to human movement [27,47], with one targeting infectious disease but the focus was on vector-borne disease only.
The potential for using such tracking technologies is increasing rapidly, as technological advances enable the manufacture of small, lightweight, highly sensitive, and affordable receivers. The routine use of location-aware devices has become widespread (e.g., cellular phones) and regulations on the use of such technology (i.e. to protect user privacy mature [55]. The large amount of time-location data collected with these technologies allows for the investigation of space-time behaviour and its associated health impact [27]. This is especially relevant to the study of infectious disease transmission at the local to micro scales as precise structural details of the network of person-to-person contacts may be revealed.
A number of methods and technologies are currently available for tracking individual movements, among which GPS is the most commonly used in medical re-search because of its improving accuracy and portability. Compared to some controversial study that uses cell-phone data when the data collection and analysis was not disclosed to the users [36], GPS is also associated with less privacy issues as the participants are always informed about the study and only location information is collected. A number of studies have either evalua-ted the accuracy of portable, low-cost GPS devices [37,48,56,57] or have demonstrated with specific studies the feasibility and effectiveness of their uses in health-related research [39-46]. GPS, however, is limited to out-door tracking. Inout-door tracking technologies such as Radio frequency identification (RFID) and Wi-Fi-based positioning systems have only been used in modelling shopping behaviour in a specific grocery store [35] or tracking healthcare personnel or patients in a specific hospital [57] (and see [58] for a review) because all avai-lable indoor tracking systems are self-contained and re-quire additional setup in the tracking environment, which can only be implemented within a fixed range.
In such case, A-GPS uses data from a cellular network to obtain faster fix times than standalone GPS. Fix time can be reduced from minutes to seconds and thus leads to more-accurate trip detection [49]. This is particular useful for tracking long durations when objects move both in-doors and outin-doors, as outdoor locations can be immedi-ately picked up upon exiting from an indoor location.
This study uses A-GPS-based tracking devices to col-lect data of individuals’ space-time trajectories. One of the objectives of this study is to explore the potential of such technology to be used in the study of infectious disease transmission. To date, there are only a limited number of studies of human mobility in relation to dis-ease transmission at the micro scale [27-29]. One of the studies used GPS to track human mobility [27] while the other two relied on traditional activity questionnaires [28,29]. The focus of these studies has been limited to vector-borne diseases. Vector-borne disease depends largely on spatial patterns of vector abundances and can thus be readily evaluated. In case of directly transmitted infectious disease, the risk is not known because the dis-ease carriers engage in dynamic space-time activities themselves. Therefore, risk patterns could only be mod-elled by examining overlapping of space-time activity spaces of individuals and may possibly inferred by com-paring the space-time behaviours of those infected with those of a control group during an outbreak. Therefore, daily mobility-activity information obtained from GPS tracking can be used as an indicator to measure expo-sures to risk factors of infection.
Space-time data visualization and exploratory analysis The space-time trajectory of human movement has many interacting dimensions: location, time, duration, sequencing and type of activities and/or trips [33,59]. Tracking devices can generate large volumes of mobility data in terms of time-stamped spatial locations. Such data is not only complex as they represent rough approximations of the complex human movement tra-jectories, but also semantically poor [60]. It is thus diffi-cult to develop analysis techniques to extract meaningful abstractions from the raw data. Visualization has been suggested to be particularly suitable for dealing with such data when conventional inferential statistics and pattern recognition algorithms fail due to the complex attributes involved [33,59,61]. Exploratory visual analysis engages the powerful visual information processing and pattern recognition abilities of humans to reveal inter-esting patterns and lead to more focused and fruitful methods or models in later stages of a study.
Approaches to visualization and exploratory analysis of movement data include the use of static maps, ani-mated maps, ringmaps [62] and space-time cubes (STC) [33,63-70]. Among these methods, the interactive 3D
STC is the most endorsed because it is more intuitive than other 2D visualizations in handling the multi-dimensions of a space-time trajectory [71]. STC representation is based on Hagerstrand’s space-time model [72] and repre-sents individuals’ movements in a cube where the base represents geography (space) and height represents time. It features geospatial lifelines related to the movement of individuals. While Miller [63,64], Neutens, Zeigler, and Schwanen [65,66] have focused on the accessibility prob-lem induced by human mobility and focused on the conceptualization of and computation with space-time prisms, others [73] have focused on interaction among individuals during movement and suggested that STC as an effective tool in epidemiological research.
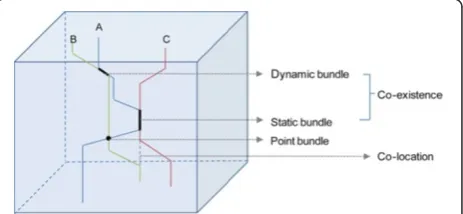
Figure 1 below illustrates a simplified STC representa-tion of three college students’activities in the morning of a typical school day, showing some of the concepts in time geography that are the most relevant to micro-scale disease transmission. It shows that student A and C sat in the same classroom for a class period (co-existence in terms of a static bundle). A and B walked by each other without more interaction (point co-existence) but met again later and walked along (co-existence in terms of a dynamic bundle). B and C never had direct interaction but the fact that C (and A) used the same classroom after B left from an earlier class makes it a situation called co-location. In the context of disease transmis-sion, both dynamic bundles and static bundles are highly relevant, whereas point bundles and co-location beyond the lifespan of an airborne virus can be less important.
Ideally to model micro-scale disease transmission we need data on the inter-human interactions as illustrated in Figure 1. Not only outdoor, but also highly accurate indoor trajectories are needed for such purpose. Current technology and privacy concerns, however, still prohibit the collection of large amount of detailed trajectory data for modelling at this level. Therefore, although STC has been suggested as an effective tool in epidemiological re-search examples have been limited to large-scale disper-sions of identified cases. In this pilot study, we collected detailed outdoor trajectories and inferred indoor stays
through spatiotemporal processing of the data collected with an A-GPS. Approximated indoor stays cannot be as precise to specific locations inside a building. Thus we are not able to examine the actual human to human transmission patterns, but only rough estimates of risk patterns indicated by the overlapping of approximated space-time activity spaces of individuals. Risk patterns related to individual’s space-time behaviour, however, may be possibly inferred by comparing the behaviours of those infected with those of a control group during an outbreak.
One other issue regarding the use of STC for visual exploration of trajectory data is that large data volumes may result in apparent visual clutters that prohibit im-mediate visual detection of any patterns [59,60,67]. A few researchers have tackled the visual clutter problem with different approaches. Kwan [59] used density sur-faces to represent the spatial distributions of activity intensities. High density indicates more overlapping of individuals’activity spaces and more chances of human to human contacts that are relevant to the spread of flu viruses. Other methods used to support visual examina-tion of large sets of movement data involve data aggre-gation [67,68,74]. Data is aggregated either on the spatial or temporal or both dimensions and clustering techni-ques are applied to extract generalized patterns.
This paper reports some initial attempts to analyze the trajectory data collected using A-GPS devices to examine space-time behaviours. Existing methods and others will be used to map space-time activity spaces and compare activity patterns of students who contracted the flu in con-trast to those who were not infected. To summarize, this study aims for using A-GPS tracking to collect data, pro-cessing the data and visually exploring patterns for micro-scale disease transmission investigations. Potential findings may benefit micro-scale infectious disease transmission modelling and local prevention, control, and containment decision making by providing insights into specific ques-tions such as:
1) How does one’s habit in terms of spending time in different places on a university campus affect chances of infection?
2) Are there certain places/buildings that lead to higher probability of infection?
3) Is a heavily trafficked cafeteria or student centre particularly susceptible to the spread of viruses and thus increase the chance of flu infection?
Methods Data collection
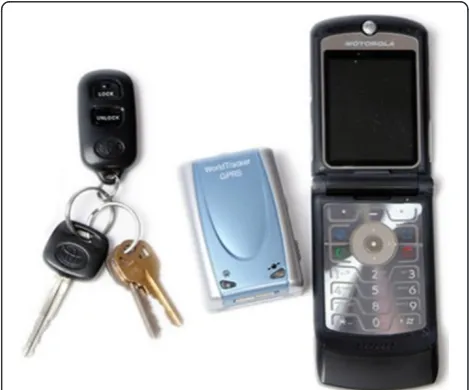
The main tracking device used in this study is a com-mercial child tracker device, WorldTracker GPRS. It is highly portable (see Figure 2 for its size compared to a
set of keys and a cell phone) and thus does not disrupt or affect one’s normal activity pattern once carrying it to log movements. It uses the SiRF Star III GPS Chipset with high sensitivity to enhance performance in low signal areas. It is A-GPS based with a fast fix time (in seconds) and accuracy within 3 meters in typical outdoor environ-ments [75]. It does not store data in the device but trans-mits constantly the time and location information to a central storage server. Therefore participants do not need to perform any complicated operation except for charging it every night. One participant was also trained to carry a Garmin eTrex Venture HC GPS receiver and an Apple iPhone 3 with a tracking app (Path Tracker) installed at the same time to collect data with all three devices for one day for comparisons.
During the early spring of 2011 (the flu season), a total of 100 participants were recruited to carry the A-GPS device during their daily activities for a week. 96 of them generated over 400 valid day-trajectories. Ten students were also asked to actively record their stops and move-ments on an activity diary at the same time when they were carrying the devices. The diary contains columns about time, location, and activities such as taking class, dining, etc. for the student to fill up whenever he/she gets a chance to do so during the day. A three-day ex-periment in our study generated 30 trajectories paired with diary records.
Volunteers were recruited through the use of blast email and posters on campus. Enrolment is limited to full-time undergraduate student who did not receive flu vaccination for at least one year. Students were all inter-viewed on whether they have caught the flu during the current flu season, and if so, symptoms and severities were also recorded. Both recruitment and interviews were conducted based on protocols approved by the IRB
of the University. No personal information was asso-ciated with the collected trajectories except flu status, gender and ethnical information.
Data pre-processing and segmentation
Pre-processing is the cleaning of noisy raw trajectory data. Limited especially by the indoor positioning abi-lities of current tracking technology, trajectory data col-lected with all GPS devices tend to exhibit noises [52] especially during long period of stays in a building. Pre-processing is thus necessary as the first step of using the collected data. Previous research has addressed the prob-lem with various filtering algorithms, such as though Gaussian Kernel smoothing or using a modified Kalman filter [49]. These filtering algorithms are general smoo-thing approaches used to reduce random errors in the data. Visual examination of the A-GPS trajectory data collected in our study reveals distinct patterns of errors resulting mostly from indoor stays. Such errors may be easily identified by overlaying the trajectory data with a detailed building layer and manually removed by selecting the erroneous track points. Large volume of data, however, prohibits manual processing. Therefore we developed both an interactive visual interface for manual pre-processing and a heuristic spatiotemporal algorithm based on the same mechanism for automa-tic batch processing [76].
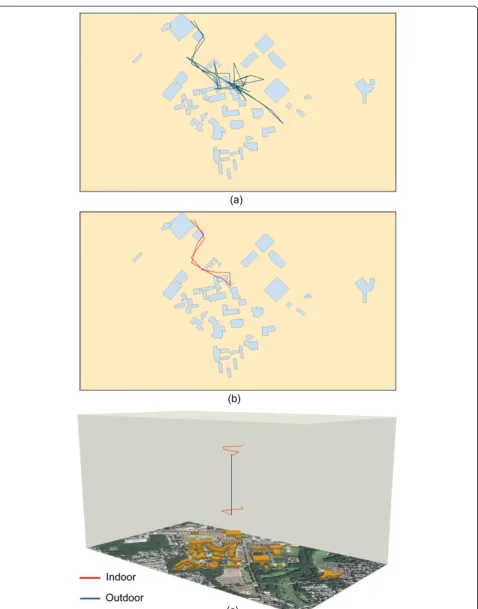
The interactive option allows one to manipulate the 3D display of raw trajectories in the space-time cube representation. Noises may be identified based on the shape, speed and/or topology of track segments. Speci-fically, track points (vertices) with unrealistic high speed or abrupt direction change usually signify errors. A clus-ter of track points with spiky shapes (Figure 3a) spatially, located within and close to a building, and spanning a long duration temporally signifies positioning errors. This is because when signals are weak or absent, GPS locations are often off and appear to be toward random directions. Indoor segments thus tend to exhibit jagged or spiky shapes made up by many sudden directional changes in the trajectory. The interactive interface allows user to select a group of these points, calculate the spa-tiotemporal centroid of the selected points, and adjust the track to go through the centroid [76].
The automatic pre-processing algorithm searches through the loaded trajectory data and mimics the visual error detection approach mentioned above. Specifically, the algorithm starts from selecting segments with high roughness and then expands back and forth to clean up the trajectory. A spatial roughness indicator is used to reveal the spiky shapes representing noises resulted from indoor error. Other indicators such as speed and dura-tion of the segment are also calculated. Obvious errors
such as extremely high speed points are first removed. Spiky segments are then targeted to calculate their spa-tiotemporal centroids using a time-weighted cluster cen-troid approach. With this approach, tracking points that make up the spiky clusters are given different weights based on their“temporal importance”. Points that repre-sent segments with longer durations are assigned higher importance. Once spatiotemporal centroids are iden-tified, the trajectory is adjusted to pass through the centroid.
Trajectory segmentation involves the identification of indoor and outdoor parts as well as activities such as walking, driving from pre-processed space-time tracks. Our algorithm uses spatiotemporal centroids identified in the last step as seed indoor points and searches seg-ments back and forth from the indoor centroid and as-sign those with very low speed indoor segments until speed starts to pick up. Besides criteria such as speed and duration of tracking points, spatial topology with re-gard to buildings is also used to label segments to corre-sponding categories. During this step, identified indoor segments are adjusted to geometries of the correspon-ding builcorrespon-dings. Activities such as attencorrespon-ding a class, dining in the cafeteria, studying in the library, working out in the gym, etc. can be differentiated based on knowledge of the buildings’usages.
Space-time activity analyses and visualizations
The participants’ trajectories were used to model their space-time activities for the semester under study. The assumption was that individuals’ habitual behaviour in their activity space tends to repeat over time and thus tracking data sometime within the flu season could re-veal useful information and patterns that are relevant to flu infections that happen in the season. This assump-tion is supported by recent research that models human mobility patterns concluding that humans are habitual animals whose space-time behaviours“follow simple re-producible patterns” [36] and that especially for univer-sity students activity patterns could be very similar from week to week during a particular semester as their class schedules are set.
(1) Density surfaces. The activity density pattern of the participants could be examined using density surface visualization as described in [33,59]. The density of different activities at different campus locations is visualized and the different patterns between the infected and non-infected may be examined. We developed a visualization tool that enables the mapping of three options of density surfaces [76]. With the first option, all vertices from the trajectory data are used to calculate kernel densities of the points. The second option calculates and displays density of individual paths travelled. And the third option re-samples the trajectory data using a set time interval and maps the densities of points spread evenly in time. This option is designed for tracking devices that collect tracking points in irregular time intervals due to varying sensitivity of the devices under various physical conditions or segmented trajectories, such as the child tracker we employed in our study. While density visualizations may help reveal overall patterns in the data, we could benefit from highlighting certain time periods to detect more detailed clusters and patterns. Temporal focusing [77] is a necessary addition to the control of a density surface visualization interface to allow for highlighting specific time periods and focusing on the selected sub-set of data for density surface calculation and visualization. (2) Connection analysis. Connection analysis was
conducted in our study in an attempt to identify strong connections among places of interests based on the trajectory data collected. For example, our study collected pedestrian trajectories on a university campus. Students walk to different buildings for taking classes, dining, and other purposes. A connection is a link represented by one or multiple segments in the collected trajectory data indicating a student has travelled from one building to another. Such connections can be derived from segmented trajectory data and the strength of each connection can be also determined by the volume of traffic that populates it. A connection analysis may help identify popular connections among campus buildings and infer typical activity sequences on campus. Hotspots such as those buildings with the most outbound or inbound traffic and hubs that connect the most trafficked places by a certain group of students (such as those who were infected by flu) may also be identified.
Results and discussion
Tracking data collection and pre-processing
A raw trajectory obtained from a student recording half day of his activity on campus using one of our A-GPS
devices is illustrated in Figure 3a. The trajectory is dis-played in 2D thus the time dimension is not shown. The campus buildings are shown as the spatial reference. It is noted that some portion of the trajectory close to a cam-pus building appears to be noisy (indicated by the spiky portion of the track). This is caused by weak GPS signals around and inside buildings. The spike can sometimes reach very far due to the low-accuracy of positioning when the device is indoors. We employed the automatic pre-processing algorithm on the raw data and conducted spatiotemporal segmentation. Figure 3b shows the pre-processed trajectory and Figure 3c displays the segmen-ted trajectory with color-coded indoor and outdoor seg-ments in the space-time cube with reference to photo imagery and campus buildings. The horizontal dimen-sions represent space and the vertical dimension is time. While oblique lines indicate movement in space, straight segments should represent stays over a period of time.
Trajectories collected by one participant using three different tracking devices are shown in Figure 4a. It shows that the three trajectories miss-match each other for some portions of the activity space, especially during indoor stays. Figure 4b shows the pre-processed trajec-tories and we see the three trajectrajec-tories match each other much better after removing erroneous points. Table 1 lists the basic parameters of the three devices. The hand-held GPS has the minimal time interval setting and longest battery life. But continuous data collection over several days would require participants to possess basic skills of using the GPS (i.e., saving tracks). iPhone 3 G has the shortest battery life when set to actively record and save locations. The A-GPS device we used, the Worldtracker GPRS, has a 15 hour battery life that enables the recording of an entire daytime trajectory with a simple plug-in charging at night. It also is not limited in data storage as the data transmits to the data server immediately via a cellular network. All three devices were reported to have similar spatial accuracies. The A-GPS, however, has the coarsest temporal resolution (15 seconds) among the three devices tested. These have resulted slightly more generalized trajectories in time-space as indicated by the red trajectory in Figure 4b.
Figure 4Trajectories collected with an iPhone, a Garmin GPS, and an A-GPS based child tracker. (a)raw trajectories;(b)
pre-processed trajectories.
Table 1 Basic parameters of the three tracking devices employed in the experiment
Device Minimum interval Battery life Accuracy* Data storage
Handheld GPS(Garmin eTrex Venture HC) 2” 22 h 3 m In device
iPhone 3with Path tracker App 4” 4 h <3 m In device
A-GPS(WorldTracker GPRS) 15” 15 h 10-30 ft Real time transmission
65.40 hours. Two indoor stays described in the diary were missing from the trajectory data, while the later captured 4 more segments that were not recorded in the diary. The mismatch between the two sets of data could be due to errors in either the segmented trajectory data or the diary data or both. By examining the mismatches and interviewing students who participated in the study we found that one of the two “miss”es by the trajectory data lasted only 2 minutes and the other happened after a long-stay in a dorm building when the device probably has suffered from a slow fix time. It has also occurred to us that the diary takers may not have often recorded ac-tivities as soon as they happened but wrote their diaries out of memory when time allowed. As a result they often recorded down a rough estimate of time and some activities could be completely missing as such skipped their memories.
One problem we noticed from the comparison was that the segmentation algorithm we used sometimes mislabelled an indoor segment in a wrong building, es-pecially when two buildings are connected to each other, which is the case with some buildings in our study, such as a group of dormitory halls on campus. Improvement on this aspect of the algorithm is needed. At the same time, an attempt to remediate the problem exercised in this study was to examine student behaviour by deriving attributes associated with a particular type of activity in-stead of the specific location-activity. The time that stu-dents spent in their dorm buildings is such an attribute. The dorm time recorded in the diary data totalled to be 10.70 and that derived from the trajectory data was 10.32 hours.
These two experiments indicate that all three com-monly used GPS or A-GPS devices perform comparable in obtaining detailed trajectory data for space time activ-ity studies. Handheld GPS supports the most temporal details but needs intervention for long durations of data collection. iPhone and the Worldtracker GPRS are both A-GPS based devices. However, the added indoor track-ing ability does not lead to improvement as the cellular network positioning accuracy could be 50 meters or greater depending on the density of available cellular network. The battery life of the iPhone device is of the most concern in this experiment but new generations of the smart phone and better apps could improve signifi-cantly on this aspect. The Worldtracker GPRS employed in this study generates the coarsest trajectories but is the most user-friendly that doesn’t require any user inter-vention except for night charging. It also supports long duration of tracking as there is no limit of data storage. Comparison to diary data indicated that the trajectory data captured with the GPRS was able to approximate major patterns in students’on-campus activities, and the 15 second time-interval still provides much finer
temporal resolution than the traditional diary data could record.
Exploratory analysis and visualizations
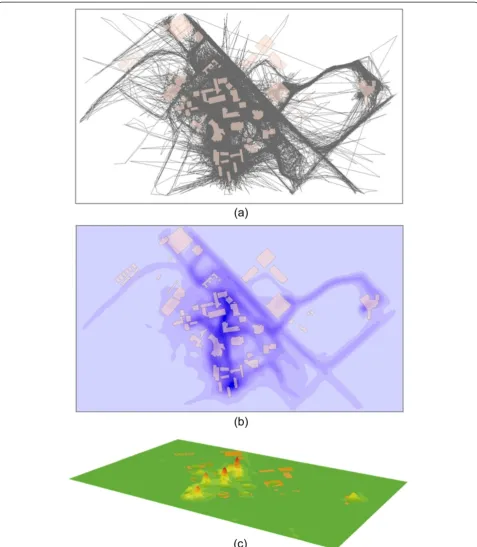
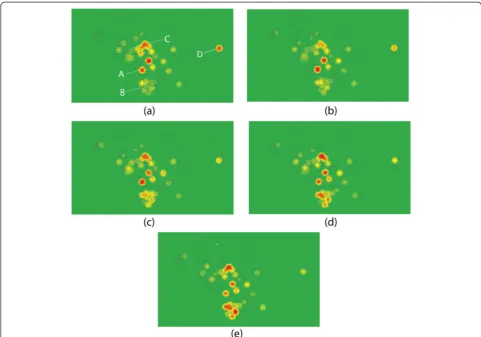
Figure 5a displays a total of 470 trajectories collected in our study. The visual clutter problem mentioned before is apparent when large amount of trajectories is involved. Figure 5b shows the density of the travelled paths on cam-pus, from which it is observable that a few sidewalks are the most heavily travelled by the participants. Figure 5c shows the 3D density surface of space-time activities on campus, where it is notable that student activities are clus-tered around a few hotspots, including the University Center (UC), a group of departmental buildings, and resi-dential halls. By controlling the time variable in the trajec-tory data through temporal focusing, we were able to examine spatial patterns at different time periods. Figure 6 shows the density surfaces at different times of a day in 2D, with red colour indicating high density and yellow being low. It is observed that activity patterns differ and hotspots may change throughout the day. For example, the UC (A) appears to be a hotspot from morning (Figure 6a) to late afternoon (Figure 6d) but slightly cools down toward the evening (Figure 6e). The dorm buildings (B) do not show high density until the late afternoon. The departmental building cluster indicated by label C seems to be crowded throughout the day but especially so in late afternoon and evening. The graduate college on east cam-pus (D), however, only seem to be accommodating the most visitors in the morning.
potential to reveal hidden space-time activity patterns that may give insights to flu transmission at the micro-scale.
In addition to detecting specific space-time hot spots, connection analysis was conducted to identify strong
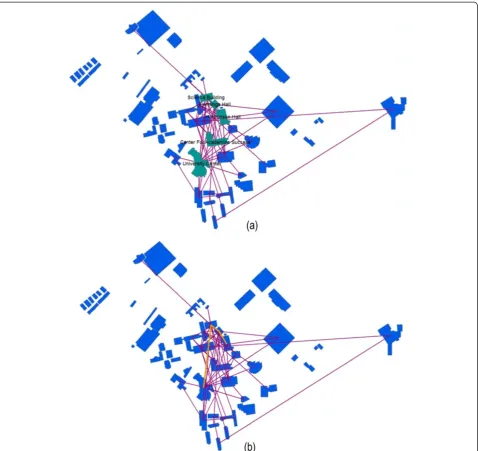
connections among campus buildings based on trajectory data (Figure 8). Figure 8a shows all straight line connec-tions among buildings captured by the participating stu-dents and the highlighted buildings are those with the highest outbound traffic volumes. Figure 8b illustrates the
most trafficked connections (bold lines). It shows strong connections among the same group of departmental buildings identified as hotspots in density surface vi-sualization. Strong connections also exist between this group of departmental buildings (with Science building being the centre) and the UC, and between the UC and the Center of Academic Success (CAS), a building that has undergraduate advisement offices and classrooms. Figure 9 shows the connection analysis results for only students who had been sick. Comparing Figure 9 to Figure 8, we see that one strong connection (between the UC and the CAS building) is no longer present from the set of strong connections identified for sick students only. The two strong connections that remain are one between the UC and the departmental buildings and another among the departmental buildings. The UC is the most heavily trafficked stop on campus being the main ation centre where the cafeteria, book store, and recre-ation rooms are located. It was hypothesized as a potential high risk hub during flu season when students interact with each for a long period of time in a crowded space. The departmental buildings involved in the second
connection are all attached to each other with indoor pathways. As indicated earlier, our segmentation algo-rithm has limitations when it comes to labelling segments with buildings especially when the buildings are close to-gether or connected. Mislabelling may have contributed to part of the strong connection shown here. It is also speculated that these buildings have classrooms where students may spend many hours indoors taking classes without having to go outside of a building. These build-ings are also relatively old constructions with aged ventila-tion systems that could increase risks of respiratory disease transmission. The CAS building that appears in the connection in Figure 8 but not in Figure 9, on the other hand, is a brand new building and stands by itself in a large open space. New ventilation and the fact that stu-dent activity has to often involve outdoor time periods whenever taking other classes out of the building both could lead to lower risks. These, are of course speculations but proves that such analysis, like other methods pre-sented in this paper can be a useful exploratory analysis tool to reveal hidden patterns, given the availability of the detailed trajectory data.
Conclusions and future work
Infectious diseases such as influenza remain an impor-tant global problem in public health. While efforts con-tinue in studying the large scale dissemination of such highly contagious diseases, human behavioural mode-lling at the micro scale benefits local control, contain-ment, and prevention decisions. This study investigated tools to collect data for the analysis of individual space-time behaviours and exploration of activity patterns.
Current tracking technology proved to be able to collect data accurate enough for space-time activity study in the micro-scale. Compared to the traditional activity dairy and questionnaire techniques, employment of GPS based devices, such as the A-GPS we experimented in this study, supports convenient collection of large amount of trajec-tory data. Once processed with an effective data cleaning algorithm the trajectory information can be used in vari-ous spatiotemporal analyses and exploratory visualizations such as the exercises discussed in this paper. Such ana-lyses may help generate hypothesis on where and when people engage in behaviour which puts them at risk of contracting the flu through human-to-human contact or air inhalation in a relatively closed environment. In addition to the usual health advice like“wash your hands or avoid crowding”, more specific space-time activity recommendations could be made.
One limitation of our approach is that the segmented trajectory data sometimes mislabel an indoor segment in a wrong building, especially when two buildings are con-nected to each other, which is the case with some build-ings in our experiment. Improvement on this aspect of the algorithm is needed. This study also only took some first steps into the examination of spatial patterns using the trajectory data collected. Following these steps, other methods like statistical analyses of variables characterizing one’s activity space and activity sequence analyses such as sequence alignment [41,78] can be performed in order to answer additional questions like how one’s activity space and sequences affect risks to infectious diseases. Spatio-temporal interactions such as bundles [64] may also be modelled to examine disease transmission patterns.
Despite the applicability of tracking technology in the study of disease risks at the micro-scale, readily available tracking technologies nowadays, however, still face the challenge of unsatisfactory accuracy for indoor position-ing. Technologies such as RFID are limited in applica-tion scope as the tracking system is self-contained and require meticulous setup in the targeted environment [79]. Wi-Fi-based positioning can be a promising tech-nology to lead to highly detailed space-time behaviour data collection and studies with much improved indoor accuracies. However, such high accuracy leads to more
serious privacy concerns that may be another barrier for their uses.
Privacy has long been a major concern in both medical research and geospatial studies that involve tracking of individuals [80]. This concern has been one of the limit-ing factors in efforts to model infectious disease trans-mission at the micro scale. As need for real-time surveillance and intervention at the micro scale becomes more obvious with increasing threats of pandemics in a globalized world, and as the potential for precise sur-veillance and intervention explodes with the fast
advancement of technology, it is critical to confront the privacy issue involved in using such technology. It is the social responsibility of researchers to protect privacy when using data such as the tracking trajectories col-lected in this study. Legal regulations regarding the use of such technology and data are also expected to be put in place for both research and practice. Although our current legal framework has not yet adapted to the potential privacy abuses of tracking technology [55], initiatives such as the US. Federal Communications Commission’s E-911 mandate has generated visions in
the direction of progress in legal regulations regarding the use of such data and technology.
This study explores the potential of using tracking technology for research in infectious disease transmis-sion and expects more applications when new, more ac-curate data is coming in no time with the current pace of technological advancement and privacy solutions or regulations set in place. With accurate indoor tracking technology, it is possible to set up real-time control and alert systems [79]. The idea is to monitor individual movements with portable devices during an outbreak.
When someone is diagnosed as infected, his/her move-ments over the previous few days will be retrieved and others who have crossed paths with the infected will be given alerts to get checked. With more accurate indoor tracking, we are also able to obtain trajectory data in a sin-gle office or school building (such as the St. Francis school that marked one of the first outbreak of H1N1 flu infec-tions in the US or a hospital ward that had many doctor infections in the Severe acute respiratory syndrome (SARS) outbreak in Hong Kong) to reveal indoor transmission pat-terns and even identify building ventilation problems.
Figure 9Connection analyses for students who were sick during the flu season. (a)buildings highlighted indicating heavy traffic;(b)
Abbreviations
GPS: Global positioning system; A-GPS: Assisted GPS; RFID: Radio frequency identification; SARS: Severe acute respiratory syndrome.
Competing interests
The authors declare that they have no competing interest.
Authors’contributions
FQ contributed to the conception and the design of the study, collected the field data and contributed to the analysis and interpretation of the data and wrote the manuscript. FD contributed to the study design, the data processing, algorithm development, and visualizations. All authors read and approved the final manuscript.
Acknowledgements
This project is funded by the US National Institute of Health (NIH) grant number 1R03AI090465.
Author details
1School of Environmental and Life Sciences, Kean University, 1000 Morris Ave., Union, NJ 07083, USA.2Department of Geography, University of Wisconsin-Madison, Wisconsin-Madison, WI, USA.
Received: 29 November 2012 Accepted: 4 February 2013 Published: 7 February 2013
References
1. Cliff AD, Haggett P, Ord JK:Spatial Aspects of Influenza Epidemics. London: Routledge Kegan & Paul; 1987.
2. Riley S:Large-scale spatial-transmission models of infectious disease.
Science2007,316:1298–1301.
3. Colizza V, Barrat A, Barthe′lemy M:Modeling the worldwide spread of pandemic influenza: baseline case and containment interventions.PLoS Med2007,4:e13. doi:10.1371/journal.pmed.0040013.
4. Eubank S, Guclu H, Kumar VA, Marathe M, Srinivasan A, Toroczkai Z, Wang N: Modeling disease outbreaks in realistic urban social networks.Nature2004, 429:180–184.
5. Mugglin AS, Cressie N, Gemmell I:Hierarchical statistical modeling of influenza epidemic dynamics in space and time.Stat Med2002,21:2703–2721. 6. Choi BC, Pak AW:A simple approximate mathematical model to predict
the number of severe acute respiratory syndrome cases and deaths.
J Epidemiol Community Health2003,57:831–835.
7. Dye C, Gay N:Epidemiology: modeling the SARS epidemic.Science2003, 300:1884–1885.
8. Meyers LA, Pourbohloul B, Newman ME:Network theory and SARS: predicting outbreak diversity.J Theor Biol2005,232:71–81.
9. Cliff AD, Haggett P, Smallman-Raynor M:The changing shape of island epidemics: historical trends in Icelandic infectious disease waves.Journal of Historical Geography2008, :1902–1988. doi:10.1016/j.jhg.2008.11.001. 10. Kamel Boulos MN:Descriptive review of geographic mapping of severe
acute respiratory syndrome (SARS) on the Internet.Int J Health Geogr
2004,3:2. doi:10.1186/1476-072X-3-2.
11. Kitron U:Risk Maps: transmission and burden of vector-borne diseases.
Parasitol Today2000,16:324–325.
12. Kapan DD, Bennett SN, Ellis BN, Fox J, Lewis ND, Spencer JH, Saksena S, Wilcox BA:Avian influenza (H5N1) and the evolutionary and social ecology or infectious disease emergence.Ecohealth2006,3:187–194. 13. Lipsitch M, Cohen T, Cooper B:Transmission dynamics and control of
severe acute respiratory syndrome.Science2003,300:1966–1970. 14. Cohen ML:Changing patterns of infectious disease.Nature2000,406:762–767. 15. Weiss RA, McMichael AJ:Social and environmental risk factors in the
emergence of infectious diseases.Nat Med2004,10:S70–S76. 16. Crepey P, Barthelemy M:Detecting robust patterns in the spread of
epidemics: a case study of influenza in the United States and France.Am J Epidemiol2007,166:1244–1251.
17. Hufnagel L, Brockmann D, Geisel T:Forecast and control of epidemics in a globalized world.Proc Natl Acad Sci2004,101:15124–15129.
18. Viboud C, Bjornstad ON, Smith DL, Simonsen L, Miller MA:Synchrony, waves, and spatial hierarchies in the spread of influenza.Science2006, 312:447–451.
19. Brownstein JS, Wolfe CJ, Mandl KD:Empirical evidence for the effect of airline travel on inter-regional influenza spread in the United States.
PLoS Med2006,3:e401. doi:10.1371/journal.pmed.0030401. 20. Donnelly CA, Ghani AC, Leung GM:Epidemiological determinants of
spread of causal agent of severe acute respiratory syndrome in Hong Kong.Lancet2003,361:1761–1766.
21. Wang W, Ruan S:Simulating the SARS outbreak in Beijing with limited data.J Theor Biol2004,227:369–379.
22. Lloyd-Smith JO, Galvani AP, Getz WM:Curtailing transmission of severe acute respiratory syndrome within a community and its hospital.Proc Biol Sci
2003,270:1979–1989.
23. Qian H, Li Y, Nielsen PV, Huang X:Spatial distribution of infection risk of SARS transmission in a hospital ward.Build Environ2009,44:1651–1658. 24. Prothero RM:Disease and mobility: a neglected factor in epidemiology.
Int J Epidemiol1977,6:259–267.
25. Morens DM, Folkers GK, Fauci AS:The challenge of emerging and re-emerging infectious diseases.Nature2004,430:242–249.
26. Morse S:Factors in the emergence of infectious diseases.Emerg Infect Dis
1995,1:7–15.
27. Stoddard ST, Morrison AC, Vazquez-Prokopec GM, Paz Soldan V, Kochel TJ:The role of human movement in the transmission of vector-borne pathogens.
PLoS Negl Trop Dis2009,3:e481. doi:10.1371/journal.pntd.0000481.
28. Thompson R, Begtrup K, Cuamba N, Dgedge M, Mendis C, Gamage-Mendis A, Enosse SM, Barreto J, Sinden RE, Hogh B:The Matola Project: a temporal and spatial study of malaria transmission and disease in a suburban area of Maputo, Mozambique.Am J Trop Med Hyg1997,57:550–559. 29. Watts S, Khallaayoune K, Bensefia R, Laamrani H, Gryseels B:The study of
human behavior and schistosomiasis transmission in an irrigated area in Morocco.Soc Sci Med1998,46:755–765.
30. Chapin FS:Human Activity Patterns in the City; Things People do in Time and in Space. New York: Wiley; 1974.
31. Fox M:Transport planning and the human activity approach.Journal of Transport Geography1995,3:105–116.
32. Goodchild MF, Anselin L, Appelbaum RP, Herr-Harthorn B:Towards spatially integrated social science.International Regional Science Review2000, 23:139–159.
33. Kwan M-P:Interactive geovisualization of activity-travel patterns using three-dimensional geographical information systems: a methodological exploration with a large data set.Transportation Research Part C2000, 8:185–203.
34. Ten Hagen K, Kramer R, Modsching M, Gretzel U:Capturing the beaten paths: a novel method for analyzing tourists’spatial behavior at an urban destination. InInformation and Communication Technologies in Tourism. Edited by Hitz M, Sigala M, Murphy J. Vienna: Springer; 2006:75–86. 35. Larson JS, Bradlow ET, Fader PS:An exploratory look at supermarket shopping
paths.International Journal of Research in Marketing2005,22:395–414. 36. Gonzalez MC, Hidalgo CA, Barabasi A-L:Understanding individual human
mobility patterns.Nature2008,453:779–782.
37. Shoval N, Isaacson M:The Application of tracking technologies to the study of pedestrian spatial behavior.The Professional Geographer2006, 58:172–183.
38. Wolf J, Guensler R, Bachman W:Elimination of the travel diary: an experiment to derive trip purpose from GPS travel data.Transportation Research Board2001,17688:125–134.
39. Elgethun K, Fenske RA, Yost MG, Palcisko GJ:Time-location analysis for exposure assessment studies of children using a novel global positioning system instrument.Environ Health Perspect2003,111:115–122. 40. Wiehe SE, Carroll AE, Liu GC, Haberkorn KL, Hoch SC, Wilson JS, Fortenberry
JD:Using GPS-enabled cell phones to track the travel patterns of Adolescents.Int J Health Geogr2008,7:22. doi:10.1186/1476-072X-7-22. 41. Mavoa S, Oliver M, Witten K, Badland M:Linking GPS and travel diary data
using sequence alignment in a study of children’s independent mobility.
International Joural of Health Geographics2011,10:64.
42. Shoval N, Auslander GK, Freytag T, Landau R, Oswald F, Seidl U, Wahl H, Werner S, Heinik J:The use of advanced tracking technologies for the analysis of mobility in Alzheimer’s disease and related cognitive diseases.BMC Geriatr2008,8:7.
43. Shoval N, Auslander G, Cohen-Shalom K, Isaacson M, Landar R, Heinik J: What can we learn about the mobility of the elderly in the GPS era?
44. Duncan JS, Badland HM, Schofield G:Combining GPS with heart rate monitoring to measure physical activity in children: a feasibility study.
J Sci Med Sport2009,12:583–585.
45. Le Faucheur A, Abraham P, Jaquinandi V, Bouye P, Saumet JL, Noury-Desvaux B: Measurement of walking distance and speed in patients with peripheral arterial disease.Circulation2008,117:897–904.
46. Barzilay Y, Shoval N, Liebergall M, Auslander G, Birenboim A, Isaacson M, Vaccaro AR, Kaplan L:Assessing the outcomes of spine surgery using global positioning systems.Spine2011,36(4):E263–E267.
47. Morabia A, Amstislavski P, Mirer F, Amstislavski T, Eisl H, Wolff M, Markowitz S: Air pollution and activity during transportation by car, subway, and walking.Am J Prev Med2009,37:72–77.
48. Abraham P, Noury-Desvaux B, Gernigon M, Mahe G, Saugaget T, Leftheriotis G, Le Faucheur A:The inter- and intra-unit variability of a low-cost GPS data looger/receiver to study human outdoor walking in view of health and clinical studies.PLoS One2012,7:2:e31338.
49. Kerr J, Duncan S, Schipperjin J:Using global positioning systems in health research.Am J Prev Med2011,41(5):532–540.
50. Krenn PJ, Mag D, Titze S, Oja P, Jones A, Ogilvie D:Use of global positioning systems to study physical activity and the environment.Am J Prev Med
2011,41(5):508–515.
51. Terrier P, Schutz Y:How useful is satellite positioning system (GPS) to track gait parameters? A review.J Neuroeng Rehabil2005,2:28. 52. Kwan M-P:The uncertain geographic context problem.Annals of the
Association of American Geographers2011,102(5):958–968. 53. Kwan M-P:From place-based to people-based exposure measures.
Soc Sci Med2009,69:1311–1313.
54. Boruff BJ, Nathan A, Nijenstein S:Using GPS technology to (re)-examine operational definitions of‘neighbourhood’in place-based health research.Int J Health Geogr2012,11:22.
55. Renenger A:Satellite tracking and the right to privacy.Hastings Law Journal2002,53:549–565.
56. Noury-Desvaux B, Abraham P, Mahe G, Saugaget T, Leftheriotis G, Le Faucheur A:The accuracy of a simple, low-cost GPS data logger/receiver to study outdoor human walking in view of health and clinical studies.
PLoS One2011,6(9):e23027.
57. Duncan JS, Oliver M, MacRae E:Positional accuracy of seven portable GPS receivers under a variety of environmental conditions. InActive Living Research Annual Conference. San Diego CA: 2011. www. Activelivingresearch.org/node/12191. 58. Liu X, Sen A, Bauer J, Zitzmann C:A software client for Wi-Fi based
real-time location tracking of patients.Lecture Notes in Computer Science2008, 4987:141–150.
59. Kwan M-P:GIS methods in time-geographic research: Geocomputation and geovisualization of human activity patterns.Geografiska Annaler B
2004,86(4):267–280.
60. Andrienko G, Andrienko N, Rinzivillo S, Nanni M, Pedreschi D:A Visual Analyltics Toolkit for cluster-based classification of mobility data.Lecture Notes in Computer Sciecne2009,5644:432–435.
61. Gahegan M:The case for inductive and visual techniques in the analysis of spatial data.Journal of Geographical Systems2000,2:77–83.
62. Zhao J, Forer P, Harvey AS:Activities, ringmaps and geovisualization of large human movement fields.Information Visualization2008,7:198–209. 63. Miller HJ:Modeling accessibility using space-time prism concepts with
geographical information systems: Fourteen years on. InClassics from IJGIS: Twenty Years of the International Journal of Geographical Information Science and Systems. Edited by Fisher P. London: Taylor and Francis; 2007:175–179. 64. Miller HJ:A measurement theory for time geography.Geographical
Analysis2005,37:17–45.
65. Neutens T, Schwanen T, Witlox F:The prism of everyday life: towards a new research agenda for time geography.Transport Reviews2011,31(1):25–47. 66. Ziegler F, Schwanen T:'I like to go out to be energised by different
people': an exploratory analysis of mobility and wellbeing in later life.
Ageing and Society2011,31(5):758–781.
67. Shaw S-L, Yu H, Bombom LS:A space-time GIS approach to exploring large individual-based spatiotemporal datasets.Transactions in GIS2008, 12:425–441.
68. Andrienko G, Andrienko N:Spatio-temporal aggregation for visual analysis of movements. InIEEE Visual Analytics Science and Technology (VAST 2008) Proceedings. Columbus, USA: IEEE Computer Society Press; 2008:51–58.
69. Kraak M, Koussoulakous A:A visualization environment for the space-time cube. InProceedings of 11th International Conference on Developments in Spatial Data Handling. Edited by Fisher P. Berlin: Springer; 2004:189–200. 70. Gatalsky P, Andrienko N, Andrienko G:Interactive analysis of event data
using space-time cube. InProceedings of 8th International Conference on Information Visualization. Edited by Banissi E. London, UK: IEEE Computer Society Press; 2004:145–152.
71. Ware C:Information Visualization: Perception for Design. CA: Morgan Kauffman; 2004.
72. Hagerstrand T:What about people in regional science?Papers of Regional Science Association1970,24:7–21.
73. Kraak MJ, Madzudzo PF:Space time visualization for epidemiological research. InICC 2007: Proceedings of the 23nd international cartographic conference ICC: Cartography for everyone and for you. Moscow, Russia: International Cartographic Association; 2007.
74. Mountain D:Visualizing, querying and summarizing individual spatio-temporal behaviour. InExploring Geovisualization. Edited by Dykes J, MacEachren AM, Kraak M-J. Amsterdam: Elsevier Science Ltd; 2005:181–200. 75. Tracking The World:WorldTracker GPRS specifications: http://www.
trackingtheworld.com/wtgprs.htm.
76. Qi F, Du F:Trajectory data analyses for pedestrian space-time activity study.J Vis Exp2013,72:e50130. doi:10.3791/50130.
77. MacEachren AM, Polsky C, Haug D, Brown D, Boscoe F, Beedasy J, Pickle L, Marrara M:Visualizing spatial relationships among health, environmental, and demographic statistics: interface design issues. InProceedings of 18th International Cartographic Conference. Stockholm: International Cartographic Association; 1997:880–887.
78. Shoval N, Isaacson M:Sequence alignment as a method for human activity analysis in space and time.Annals of the Assocation of American Geographers2006,97:282–297.
79. Kamel Boulos MN, Berry G:Real-time locating systems (RTLS) in healthcare: a condensed primer.Int J Health Geogr2012,11:25. 80. Kamel Boulos MN:Towards evidence-based, GIS-driven national spatial
health information infrastructure and surveillance services in the United Kingdom.Int J Health Geogr2004,3(1):1.
doi:10.1186/1476-072X-12-6
Cite this article as:Qi and Du:Tracking and visualization of space-time
activities for a micro-scale flu transmission study.International Journal of
Health Geographics201312:6.
Submit your next manuscript to BioMed Central and take full advantage of:
• Convenient online submission
• Thorough peer review
• No space constraints or color figure charges
• Immediate publication on acceptance
• Inclusion in PubMed, CAS, Scopus and Google Scholar
• Research which is freely available for redistribution