R E S E A R C H
Open Access
Mitigating the heroin crisis in Baltimore,
MD, USA: a cost-benefit analysis of a
hypothetical supervised injection facility
Amos Irwin
1,2*, Ehsan Jozaghi
3,4, Brian W. Weir
5, Sean T. Allen
5, Andrew Lindsay
5and Susan G. Sherman
6Abstract
Background:In Baltimore, MD, as in many cities throughout the USA, overdose rates are on the rise due to both the increase of prescription opioid abuse and that of fentanyl and other synthetic opioids in the drug market. Supervised injection facilities (SIFs) are a widely implemented public health intervention throughout the world, with 97 existing in 11 countries worldwide. Research has documented the public health, social, and economic benefits of SIFs, yet none exist in the USA. The purpose of this study is to model the health and financial costs and benefits of a hypothetical SIF in Baltimore.
Methods:We estimate the benefits by utilizing local health data and data on the impact of existing SIFs in models for six outcomes: prevented human immunodeficiency virus transmission, Hepatitis C virus transmission, skin and soft-tissue infection, overdose mortality, and overdose-related medical care and increased medication-assisted treatment for opioid dependence.
Results:We predict that for an annual cost of $1.8 million, a single SIF would generate $7.8 million in savings, preventing 3.7 HIV infections, 21 Hepatitis C infections, 374 days in the hospital for skin and soft-tissue infection, 5.9 overdose deaths, 108 overdose-related ambulance calls, 78 emergency room visits, and 27 hospitalizations, while bringing 121 additional people into treatment.
Conclusions:We conclude that a SIF would be both extremely cost-effective and a significant public health and economic benefit to Baltimore City.
Keywords:Supervised injection facility, Supervised consumption rooms, Cost-benefit, Cost-effectiveness, People who inject drugs, Harm reduction, Opiate overdose, Heroin, Baltimore, Maryland
Background
Baltimore City has one of the highest overdose death rates in the country, and overdoses have been increasing in recent years. From 2014 to 2015, heroin-related over-dose deaths in Baltimore increased from 192 to 260 [1]. These increases are in part attributed to the prevalence of fentanyl in the heroin supply, with fentanyl causing 31 and 51% of 2015 and 2016 overdose deaths, respect-ively. Fentanyl is 50–100 times more potent than heroin or morphine. Illicit fentanyl and derivatives are appeal-ing to illicit drug networks as these chemicals are
cheaper than prescription opioids, heroin, and cocaine, and are extremely potent [2–5].
There are numerous additional medical costs associ-ated with injection drug use, largely relassoci-ated to infectious diseases and soft-tissue infections. Roughly 18% of the people who inject drugs (PWID) in Baltimore are HIV positive, twice the 9% national average for PWID and 50 times the prevalence in the general population [6–8]. One in five Baltimore PWID suffers chronic skin and soft-tissue infection, the leading cause of PWID hospitalization [9–11].
Supervised injection facilities (SIFs) have been estab-lished worldwide to reduce the harms associated with in-jection drug use. In SIFs, PWID inject previously obtained drugs in the presence of medical staff. A * Correspondence:[email protected]
1Law Enforcement Action Partnership, Silver Spring, MD, USA 2Criminal Justice Policy Foundation, Silver Spring, MD, USA
Full list of author information is available at the end of the article
number of public health, social, and economic benefits of SIFs have been evaluated by studies of the Insite SIF in Vancouver, Canada and the Medically Supervised Injecting Centre (MSIC) in Sydney, Australia, both of which were established in 2003 [12–15].
Among these benefits, studies have demonstrated four in particular that can be quantified. First, SIFs re-duce blood-borne disease transmission by providing clean needles and safer injecting education [12, 16, 17]. Second, SIF staff reduce bacterial infection by providing clean injection equipment, cleaning wounds, and iden-tifying serious infections early [18–20]. Third, SIF staff intervene in case of overdose, meaning that while PWID may overdose at a SIF, none die and few suffer complications [13]. Fourth, the SIF and its staff become a trusted, stabilizing force in many hard-to-reach PWID’s lives, persuading many to enter addiction treat-ment [12, 14, 21].
As in other US cities, a multisector discussion about the merits and utility of SIFs has begun in Baltimore due to rising overdose deaths as well as the inadequacy of the current criminal justice-focused response [22].
The purpose of this article is to analyze the potential cost-effectiveness of establishing a SIF in Baltimore. We estimate the annual cost of the facility and the savings resulting from six separate health outcomes: prevention of HIV infection, HCV infection, skin and soft-tissue in-fection (SSTI), overdose death, and nonfatal overdose and increased medication-assisted treatment (MAT) up-take. Each estimate includes the health outcome, finan-cial value, and a sensitivity analysis. First, we present the existing literature on SIF cost-benefit analyses, then our study’s method, its results, its implications, and its limitations.
SIF cost-benefit analysis literature review
Prior cost-benefit analyses of Insite in Vancouver and MSIC in Sydney have assessed a more limited range of outcomes than the present study. The Insite studies were limited to the outcomes of HIV prevention, HCV prevention, and overdose death prevention. They have agreed that Insite generates net savings when all three outcomes are considered [23, 24]. The cost-benefit ana-lysis of Sydney’s MSIC only included savings from over-dose deaths, ambulance calls, and police services averted by the SIF.
A number of other studies have estimated HIV and HCV prevention benefits for hypothetical SIFs in Canadian cities from Montreal to Saskatoon [25–30]. Irwin et al. [31] are the only other cost-benefit analysis of a hypothetical SIF in the USA—in San Francisco, California—and the only other study to consider more than three outcomes. We discuss the differences in
methodologies between this paper and past analyses for each individual outcome in the“Methods”section.
Methods
This study calculates the financial and health costs and benefits of a hypothetical Baltimore SIF modeled on Insite. Insite occupies roughly 1,000 ft2, provides 13 booths for clients, and operates 18 h per day. Insite serves about 2100 unique individuals per month, who perform roughly 180,000 injections per year [32, 33].
This study measures the cost of the facility against sav-ings from six outcomes: prevention of HIV, HCV, SSTI, and overdose deaths, reduced overdose-related medical costs, and referrals to MAT. We assess each model’s de-pendence on important variables with a sensitivity ana-lysis. For the sensitivity analysis, we increase and decrease the chosen variable by 50% and report the im-pact on the outcome.
Cost of the facility
Cost calculations are based on a facility equal in size and scope to Insite. We estimate that the annual cost of es-tablishing a new SIF combines both upfront and operat-ing costs. Since we assume the same staffoperat-ing levels, equipment needs, and other operating cost inputs as Insite, we calculate the operating costs by multiplying the Insite SIF’s $1.5 million operating costs by a 4% cost of living adjustment between Vancouver and Baltimore [34, 35]. Since the upfront costs would depend on the exact location and extent of renovations required, we make a conservative estimate of $1.5 million based on actual budgets for similar facilities and standard per-square-foot renovation costs [12, 36]. We convert this upfront cost into a levelized annual payment by assum-ing that it was financed with a loan lastassum-ing the lifetime of the facility. We determine the levelized annual pay-ment according to the standard financial equation:
C¼ i Pð Þ
1−ð1þiÞ−N
whereCis the levelized annual upfront cost,iis a stand-ard 10% interest rate, P is the $1.5 million total upfront cost, and N is the estimated 25-year lifetime of the facility.
HIV and HCV prevention benefits
while Andresen and Jozaghi [23] incorporate the fact that the SIF reduces needle sharing outside the SIF as well, since Insite staff educate clients on safer injecting practices [38].
To estimate the impact of reduced needle sharing on HIV and HCV infection rates, we use an epidemiological “circulation theory” model developed to calculate how needle exchange programs impact HIV infection among PWID and subsequently used to study SIF HIV and HCV infection [23, 39]. We use the model to estimate new HIV infection cases (IHIV):
IHIV ¼iNsd½1−ð1−qtÞM
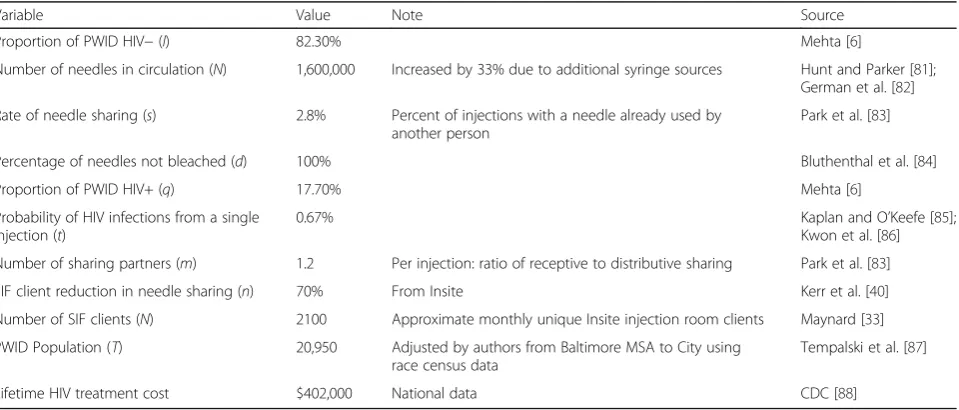
where i is the percentage of HIV-negative PWIDs, Nis the total number of needles in circulation, s is the per-centage of injections with a shared needle, dis the per-centage of injections with an unbleached needle,qis the percentage of HIV-positive PWIDs, t is the chance of transmitting HIV through a single injection with a shared needle, and M is the average number of people injecting with a single previously used needle. Table 1 shows the values and sources for each variable.
We estimate SIF-averted HIV infections by finding the difference between IHIV at the current rate of needle sharing (spre) andIHIVat the post-SIF rate (spost). We cal-culatespostwith the formula:
Spost¼SpreðT−NÞ þ
1−n ð ÞN T
whereT is the total number of PWID in Baltimore City, Nis the number of SIF users, andnis the 70% reduction in needle sharing by SIF users [40].
We perform the same calculations for HCV, and the values and sources for the HCV variables are contained in Table 2.
We check the model’s validity by comparing its base-line prediction of HIV and HCV incidence in Baltimore (IHIV and IHCV at spre) with the city’s actual incidence data. The model predicts 53 new PWID-related HIV cases in Baltimore each year in the absence of a SIF, only slightly lower than the 55 diagnoses reported by the Maryland Department of Health and Mental Hygiene [41]. Since many new HIV cases go undiagnosed, espe-cially in the hard-to-reach PWID population, this base-line figure suggests that we are underestimating potential HIV infections averted [42].
For HCV, the model predicts 302 cases in the absence of a SIF. The Maryland Department of Health and Men-tal Hygiene (DHMH) does not report annual injection-related HCV infections for Baltimore City. However, based on Mehta et al.’s [43] finding that 7.8% of a sample of Baltimore’s HCV-negative PWID contract HCV every year, we estimate PWID HCV incidence at 398 new cases per year. Since our model predicts a significantly lower incidence, we are most likely underestimating the potential number of HCV infections averted.
Skin and soft-tissue infection benefits
Since PWID frequently contract skin and soft-tissue in-fection from unsanitary injection practices and often avoid seeking medical treatment until these infections become life threatening, SSTI is the number one reason for PWID hospital admission. Insite studies have dem-onstrated that SIFs significantly reduce SSTI medical costs by providing clean injection materials and referring PWID for medical treatment when necessary [18, 20]. Irwin et al. [31], the only cost-benefit analysis to
Table 1Values, notes, and sources for variables used to predict HIV infection reduction savings
Variable Value Note Source
Proportion of PWID HIV−(I) 82.30% Mehta [6]
Number of needles in circulation (N) 1,600,000 Increased by 33% due to additional syringe sources Hunt and Parker [81]; German et al. [82]
Rate of needle sharing (s) 2.8% Percent of injections with a needle already used by another person
Park et al. [83]
Percentage of needles not bleached (d) 100% Bluthenthal et al. [84]
Proportion of PWID HIV+ (q) 17.70% Mehta [6]
Probability of HIV infections from a single injection (t)
0.67% Kaplan and O’Keefe [85];
Kwon et al. [86]
Number of sharing partners (m) 1.2 Per injection: ratio of receptive to distributive sharing Park et al. [83]
SIF client reduction in needle sharing (n) 70% From Insite Kerr et al. [40]
Number of SIF clients (N) 2100 Approximate monthly unique Insite injection room clients Maynard [33]
PWID Population (T) 20,950 Adjusted by authors from Baltimore MSA to City using race census data
Tempalski et al. [87]
incorporate this outcome, have shown this outcome to be significant, concluding that a SIF in San Francisco could reduce SSTI-related hospitalizations by 415 days per year, saving $1.7 million.
We estimate annual savings due to SIF SSTI reduction (SSSTI) according to
SSSTI¼NhLrC
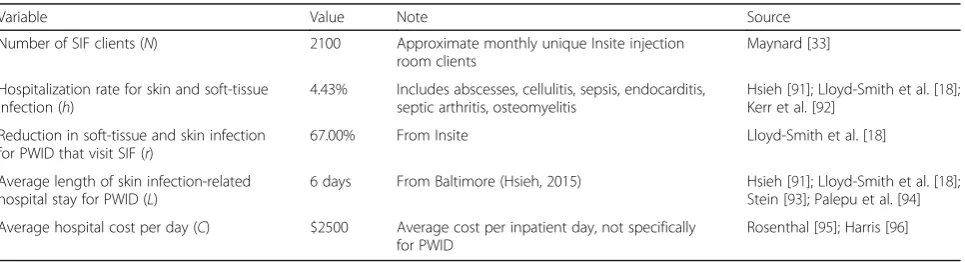
whereNis the total number of SIF clients, his the per-cent of PWID hospitalized for SSTI in an average year,L is the average length of SSTI hospitalization,ris the 67% reduction in SSTI hospital stay length that Lloyd-Smith et al. [18] documented for Insite clients, and C is the average daily cost of a hospital stay. See Table 3 for values and sources.
Overdose mortality benefits
While Andresen and Boyd [44] estimate that Insite pre-vents one overdose death per year, out of roughly 20 total overdose deaths in the neighborhood, they are sim-ply extrapolating that if Insite hosts 5% of the city’s
injections, it should prevent 5% of the city’s overdose deaths. However, Milloy et al. [45] demonstrate that Insite prevents more than 5% of the city’s overdose deaths. Milloy et al. attribute this effect to drug use education, which 32% of all Insite clients report receiv-ing. For example, PWID learn to pre-inject a small dose of their drug to“test”the potency, which can pre-vent accidental overdose in case of an unusually pure or contaminated dose. In Sydney’s SIF, known as MSIC, 80% of clients report changing their injection behavior to reduce the risk of overdose as a result of in-SIF education [15].
This finding is supported by Marshall et al. [46], who compare the change in overdose deaths within 500 m of Insite to the change in other Vancouver neighbor-hoods both before and after the facility’s opening. They find that before Insite opened, roughly 20 overdoses occurred within 500 m of the facility. After Insite opened, overdose mortality within 500 m of the facility fell by 35%, compared to a 9.3% reduction further away, suggesting that Insite reduced neighborhood overdose deaths by at least 26% [46].
Table 2Values, notes, and sources for variables used to predict HCV infection reduction savings
Variable Value Note Source
Proportion of PWID HCV−(I) 25% Average of values reported (10–40%) Falade-Nwulia et al. [89]
Number of needles in circulation (N) 1,600,000 Increased by 33% due to additional syringe sources Hunt and Parker [81]; German et al. [4]
Rate of needle sharing (s) 2.8% Percent of injections with a shared needle Park et al. [83]
Percentage of needles not bleached (d) 100% Bluthenthal et al. [84]
Proportion of PWID HCV+ (q) 75% Average of values reported (60–90%) Falade-Nwulia et al. [89]
Probability of HCV infections from a single injection (t)
3% Kwon et al. [86]; Kaplan
and O’Keefe [85]
Number of sharing partners (m) 1.2 Per injection: ratio of receptive to distributive sharing Park et al. [83]
SIF client reduction in needle-sharing (n) 70% From Insite Kerr et al. [40]
Number of SIF clients (N) 2100 Approximate monthly unique Insite injection room clients Maynard [33]
Total PWID population (T) 20,950 Adjusted by authors from Baltimore MSA to City using race census data
Tempalski et al. [87]
Lifetime HCV treatment cost $68,219 Adjusted for inflation Razavi et al. [90]
Table 3Values, notes, and sources for variables used to predict skin and soft-tissue infection reduction savings
Variable Value Note Source
Number of SIF clients (N) 2100 Approximate monthly unique Insite injection room clients
Maynard [33]
Hospitalization rate for skin and soft-tissue infection (h)
4.43% Includes abscesses, cellulitis, sepsis, endocarditis, septic arthritis, osteomyelitis
Hsieh [91]; Lloyd-Smith et al. [18]; Kerr et al. [92]
Reduction in soft-tissue and skin infection for PWID that visit SIF (r)
67.00% From Insite Lloyd-Smith et al. [18]
Average length of skin infection-related hospital stay for PWID (L)
6 days From Baltimore (Hsieh, 2015) Hsieh [91]; Lloyd-Smith et al. [18]; Stein [93]; Palepu et al. [94]
Average hospital cost per day (C) $2500 Average cost per inpatient day, not specifically for PWID
Therefore, to predict the impact of a SIF on fatal over-dose, we estimate the number of overdose deaths within a 500-m radius of an optimally placed SIF in Baltimore. Based on the fact that there were 260 heroin-related fatal overdoses in 2015 and 342 in the first three quarters of 2016, we estimate that there were 463 heroin-related fatal overdoses in all of 2016 [1, 47]. Since data on the geospatial distribution of fatal overdoses in Baltimore City are not available, we approximate this distribution by mapping data from the Baltimore City Fire Department Emergency Med-ical Services on the locations where medics adminis-tered naloxone in response to suspected opioid overdoses [48]. We identify the location with the high-est concentration of naloxone administrations within 500 m by plotting the locations of all naloxone admin-istrations in the first three quarters of 2016 in ArcGIS. The chosen location accounts for 6.2% of all naloxone administrations, suggesting that 28 heroin-related overdose deaths occurred within that 500-m radius cir-cle in 2016. As the percent of overdose deaths within this area varies over time, we assume that in an average year, it would encompass a more conservative 23 heroin-related overdose deaths. This is 5% of the city-wide total and slightly higher than the 20 deaths per year within 500 m of Insite.
We calculate the total value of overdose deaths averted by the SIF (SOD) according to the equation:
SOD¼rnDV
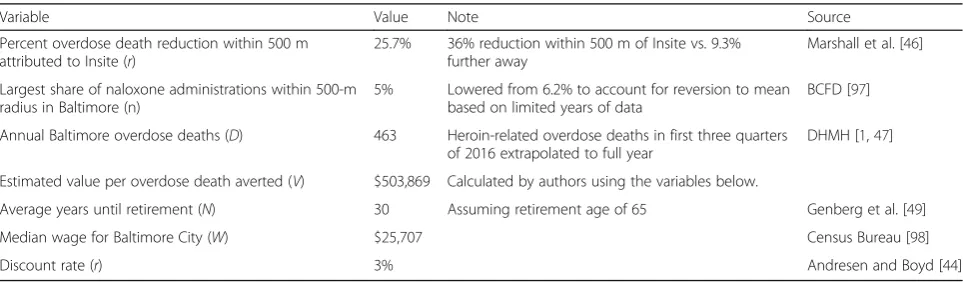
whereris the rate of overdose death reduction expected within 500 m,nis the 5% share of naloxone administra-tions concentrated within a single circle of radius 500 m in Baltimore, D is the total number of overdose deaths in Baltimore, andVis the value of a single life saved.
In order to assign value to the loss of life due to over-dose, we follow Andresen and Boyd [44] in considering only the tangible value to society rather than including the suffering and lost quality of life for loved ones. We
estimate the tangible value by calculating the present value of the remaining lifetime wages of an average person from the community. Since the average age of PWID in Baltimore is 35, we convert 30 years of future wages to present value using a standard discount rate [44, 49]. So the value of a single prevented overdose death (V) is calculated as
V¼X N
i¼1 W ð1þrÞi
where n represents the remaining years of income, W represents the median wage for Baltimore City, and r represents the discount rate. We thus use a value per life saved of $503,869 in the overdose death savings calcula-tion above. The values and sources for each variable in this section are given in Table 4.
Most likely, this method underestimates the facility’s impact, since this method only estimates averted over-dose deaths within 500 m of the SIF, though the facility would also reduce overdose outside a 500-m radius.
Overdose morbidity benefits
Overdoses require emergency medical assistance, even when they are not life threatening. Evaluations of Sydney’s MSIC show that by managing overdose events on-site, the SIF reduces ambulance calls, emergency room visits, and hospital stays for overdose-related mor-bidity [12]. No previous SIF cost-benefit evaluations have included overdose morbidity in their analyses, but MSIC provides sufficient data to estimate the magnitude of a SIF’s impact.
In Baltimore, ambulances are called to the scene of roughly half of all nonfatal overdoses [50]. By contrast, almost all overdoses in MSIC, Sydney’s SIF, were han-dled by on-site medical staff and did not result in ambu-lance calls [14]. We estimate cost savings of averted ambulance calls for a SIF in Baltimore according to the following model:
Table 4Values, notes and sources for variables used to predict savings from averted overdose deaths
Variable Value Note Source
Percent overdose death reduction within 500 m attributed to Insite (r)
25.7% 36% reduction within 500 m of Insite vs. 9.3% further away
Marshall et al. [46]
Largest share of naloxone administrations within 500-m radius in Baltimore (n)
5% Lowered from 6.2% to account for reversion to mean based on limited years of data
BCFD [97]
Annual Baltimore overdose deaths (D) 463 Heroin-related overdose deaths in first three quarters of 2016 extrapolated to full year
DHMH [1,47]
Estimated value per overdose death averted (V) $503,869 Calculated by authors using the variables below.
Average years until retirement (N) 30 Assuming retirement age of 65 Genberg et al. [49]
Median wage for Baltimore City (W) $25,707 Census Bureau [98]
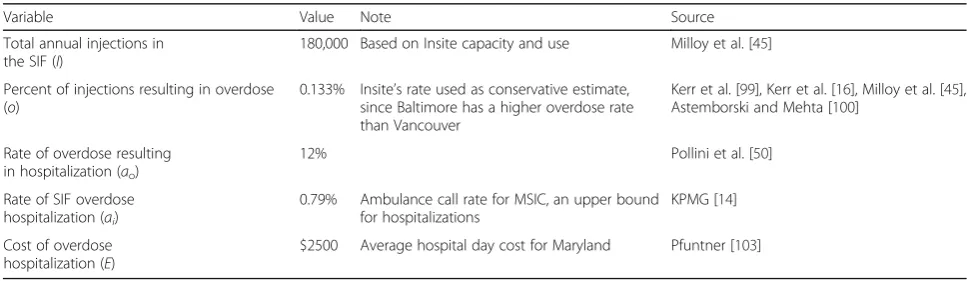
Sa¼Io coð −ciÞA
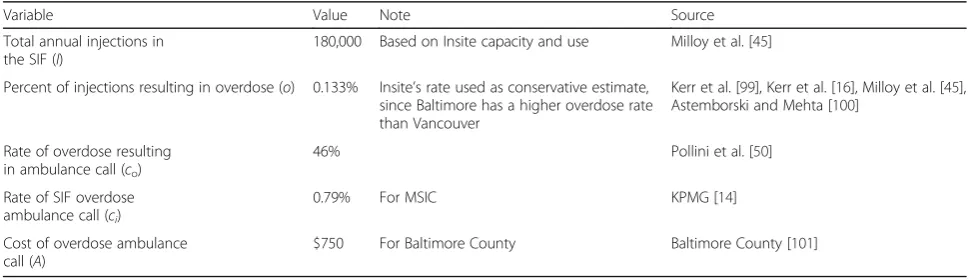
where Sais the annual savings due to the SIF reducing ambulance calls for overdose, I is the annual number of injections in the SIF, o is the per-injection rate of overdose,coandciare the rates of overdose ambulance calls outside and inside the SIF, respectively, and A is the average cost of an overdose ambulance call. The values and sources for these variables are given in Table 5.
Emergency response personnel often transport over-dose victims to the emergency room for treatment. One Baltimore study found that 33% of PWID reported being taken to the ER for their latest overdose [50]. By con-trast, overdoses in SIFs lead to emergency room treat-ment in less than 1% of cases [14]. With a single Baltimore ER visit averaging over $1,300, SIFs reduce medical costs significantly by keeping PWID out of emergency rooms for overdose. We calculate the savings according to the following:
Ser¼Io toð −tiÞF
where Seris the annual savings due to the SIF reducing emergency room visits for overdose, I is the annual number of injections in the SIF, ois the rate of nonfatal overdose, toandti are the rates of ER visit for overdose when the overdose occurs outside and inside the SIF, re-spectively, and F is the average cost of an overdose emergency room visit. The values and sources for these variables are given in Table 6.
Overdose victims are occasionally hospitalized for treatment. In Baltimore, 12% of PWID who overdosed reported being hospitalized, while less than 1% of SIF overdoses lead to hospitalization [14, 50]. With one day in a Baltimore hospital averaging $2,500, SIFs re-duce medical costs significantly by keeping PWID out of the hospital for overdose. We calculate the savings according to the following:
Sh¼Io að o−aiÞE
where Sh is the annual savings due to the SIF reducing hospitalization for overdose, I is the annual number of injections in the SIF, o is the rate of nonfatal overdose, ao and ai are the rates of hospitalization for overdose when the overdose occurs outside and inside the SIF, re-spectively, and E is the average expense of an overdose hospital stay. The values and sources for these variables are given in Table 7.
Medication-assisted treatment benefits
Many PWID who are unable to quit using illicit opioids through traditional abstinence-based treatment pro-grams are successful using methadone or buprenorphine maintenance as part of medication-assisted treatment (MAT) [51]. MAT not only reduces the crime and health care costs of PWID by helping a significant portion quit injecting drugs but also decreases drug use, crime, and health costs among the patients who do relapse [52, 53]. Wood et al. [15, 22] and MSIC [12] show that both Insite and Sydney’s MSIC refer many SIF clients to treat-ment, increasing treatment uptake. Irwin et al. [31] find a single SIF’s impact on treatment uptake to be signifi-cant, estimating that a SIF in San Francisco would bring 110 patients into MAT every year.
We estimate that by referring clients to MAT, a SIF would produce annual health care and crime savings equal toSMAT:
SMAT¼Nr f bð −1ÞT
where N is the number of PWID who use the SIF, ris the percent of SIF clients who have been shown to ac-cess treatment as a result of SIF referrals,fis a conserva-tive 50% estimate for retention in MAT,bis the average cost-benefit ratio studies have found for MAT, andT is the annual cost of treatment. Table 8 shows the values and sources for each variable.
The SIF’s success in referring PWID to MAT depends on the pre-existing local prevalence of MAT uptake,
Table 5Values, notes, and sources for variables used to predict savings from overdose-related ambulance calls
Variable Value Note Source
Total annual injections in the SIF (I)
180,000 Based on Insite capacity and use Milloy et al. [45]
Percent of injections resulting in overdose (o) 0.133% Insite’s rate used as conservative estimate, since Baltimore has a higher overdose rate than Vancouver
Kerr et al. [99], Kerr et al. [16], Milloy et al. [45], Astemborski and Mehta [100]
Rate of overdose resulting in ambulance call (co)
46% Pollini et al. [50]
Rate of SIF overdose ambulance call (ci)
0.79% For MSIC KPMG [14]
Cost of overdose ambulance call (A)
location and availability of MAT slots, and other neighborhood-level factors. As a result, we acknowledge that the 5.8% increase found for Sydney’s MSIC may dif-fer significantly from the actual redif-ferral rate for a SIF in Baltimore.
Results
Overall cost-benefit ratio
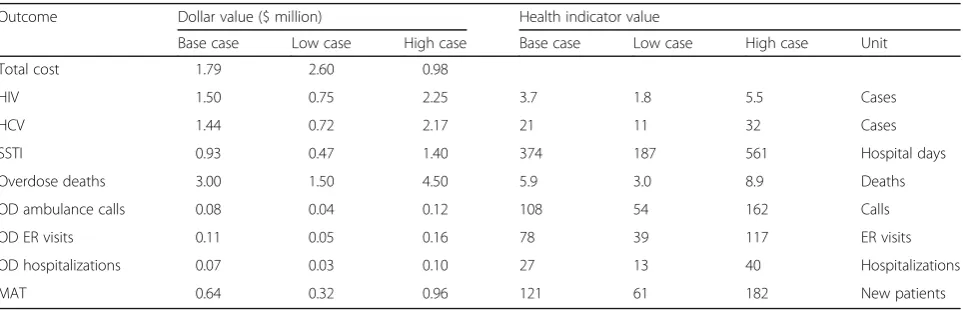
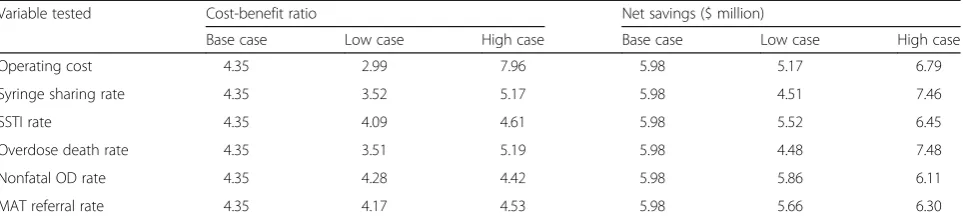
Our analysis finds a total benefit of $7.77 million and a total cost of $1.79 million, yielding a cost-benefit ratio of $4.35 saved for every dollar spent. Net savings are $5.98 million. We present the sensitivity analysis re-sults for each outcome in Table 9, showing both finan-cial and health results for the base, low, and high cases. Table 10 shows the impact of the sensitivity ana-lysis for each key variable on the overall cost-benefit ratio and net savings.
Cost of the facility
Our estimate of the total annual cost is $1.79 million, which includes $1.62 million in operating costs and $170,000 in annualized upfront costs. In our sensitivity analysis, raising the operating cost by 50% increased the total cost to $2.6 million, lowering the cost-benefit ratio from 4.35 to 2.99 and net annual savings from $5.98 million to $5.17 million. Lowering the operating
cost by 50% resulted in a total cost of $980,000, raising the cost-benefit ratio to 7.96 and net savings to $6.79 million.
HIV and HCV benefits
We estimate that a SIF would prevent an average of 3.7 HIV and 21 HCV cases per year, translating to annual savings of $1.50 million and $1.44 million, respectively.
We conducted a sensitivity analysis on the syringe sharing rate. Increasing the rate by 50%, from 2.8 to 4.2%, raises averted infections to 5.5 for HIV and 32 for HCV and savings to $2.25 million for HIV and $2.17 million for HCV. As a result, the overall cost-benefit ra-tio for the SIF increases from 4.35 to 5.17 and net sav-ings increase from $5.98 million to $6.45 million. Decreasing the sharing rate by 50%, from 2.8 to 1.4%, lowers averted infections to 1.8 for HIV and 11 for HCV, reducing HIV savings to $750,000 and HCV savings to $720,000. In this scenario, the overall cost-benefit ratio declines to 3.52 and net savings fall to $4.51 million.
Skin and soft-tissue infection benefits
We estimate that SIF SSTI care will reduce total PWID hospital stays for SSTI by 374 days per year, which trans-lates to annual savings of roughly $930,000.
Table 6Values, notes, and sources for variables used to predict savings from overdose-related emergency room visits
Variable Value Note Source
Total annual injections in the SIF (I)
180,000 Based on Insite capacity and use Milloy et al. [45]
Percent of injections resulting in overdose (o)
0.133% Insite’s rate used as conservative estimate, since Baltimore has a higher overdose rate than Vancouver
Kerr et al. [99], Kerr et al. [16], Milloy et al. [45], Astemborski and Mehta [100]
Rate of overdose resulting in emergency room visit (to)
33% Pollini et al. [50]
Rate of SIF overdose emergency room visit (ti)
0.79% Ambulance call rate for MSIC, an upper bound for emergency room visits
KPMG [14]
Cost of overdose emergency room visit (F)
$1,364 Average Baltimore City emergency room visit cost Rienzi [102]
Table 7Values, notes, and sources for variables used to predict savings from overdose-related hospitalizations
Variable Value Note Source
Total annual injections in the SIF (I)
180,000 Based on Insite capacity and use Milloy et al. [45]
Percent of injections resulting in overdose (o)
0.133% Insite’s rate used as conservative estimate, since Baltimore has a higher overdose rate than Vancouver
Kerr et al. [99], Kerr et al. [16], Milloy et al. [45], Astemborski and Mehta [100]
Rate of overdose resulting in hospitalization (ao)
12% Pollini et al. [50]
Rate of SIF overdose hospitalization (ai)
0.79% Ambulance call rate for MSIC, an upper bound for hospitalizations
KPMG [14]
Cost of overdose hospitalization (E)
We conducted a sensitivity analysis on the SSTI hospitalization rate. Increasing the rate by 50% raises averted hospital days to 561 and savings to $1.40 million. As a result, the overall cost-benefit ratio for the SIF in-creases from 4.35 to 4.61 and net annual savings rise from $5.98 million to $6.45 million. Decreasing the rate by 50% lowers averted hospital days to 187 and reduces savings to $470,000. In this scenario, the overall cost-benefit ratio declines to 4.09 and net savings fall to $5.52 million.
Overdose mortality benefits
We estimate that SIF overdose prevention will save an average of 5.9 lives per year, which translates to $3.00 million in savings for society.
We conducted a sensitivity analysis of drug overdose deaths in the neighborhood around the facility, since deaths fluctuate from year to year. Increasing the total by 50% raises estimated lives saved to 8.9 and financial savings to $4.50 million. This raises the overall cost-benefit ratio for the SIF from 4.35 to 5.19 and net sav-ings from $5.98 million to $7.48 million. Lowering the neighborhood deaths by 50% would reduce estimated lives saved to 3.0 and financial savings to $1.50 million, for an overall cost-benefit ratio of 3.51 and net savings of $4.48 million.
Overdose morbidity benefits
We estimate that the SIF will also prevent 108 ambu-lance calls, 78 emergency room visits, and 27 hospitali-zations for nonfatal overdose, which translates to $81,000, $110,000, and $67,000 in medical savings, respectively.
We conducted a sensitivity analysis on the nonfatal overdose rate, since it is not well documented for Baltimore. Increasing the rate 50% raises the benefits to 162 ambulance calls, 117 ER visits, and 40 hospitaliza-tions, for savings of $120,000, $160,000, and $100,000, respectively. This higher rate would raise the overall cost-benefit ratio for the SIF from 4.35 to 4.42 and net savings from $5.98 to $6.11 million. Lowering the rate by 50% would reduce the benefits to 54 ambulance calls, 39 ER visits, and 13 hospitalizations, lowering the sav-ings to $40,000, $50,000, and $30,000, respectively. This lower rate would reduce the SIF’s overall cost-benefit ra-tio to 4.28 and net savings to $5.86 million.
Medication-assisted treatment benefits
We estimate that 121 PWID will enter MAT as a result of the SIF, translating into $640,000 in benefits for society.
We conducted a sensitivity analysis of the referral rate for MAT. Raising the rate by 50%, from 5.78 to 8.67%,
Table 8Sources for variables used to predict savings from medication-assisted treatment referrals
Variable Value Note Source
Number of SIF clients (N) 2100 Approximate monthly unique Insite injection room clients
Maynard [33]
Percent of SIF users who access MAT as a result of SIF referrals (r)
5.78% From MSIC MSIC [12]
Treatment retention factor (f) 50% General retention rate estimated at 60–90%
CSAM [104]
Cost-benefit ratio for MAT (b) 4.5 Conservative: average of low estimates Cartwright [51], Gerstein [105], Health Canada [32], Harris et al. [52], CHPDM [53]
Average cost of 1 year of MAT (T) $4000 Schwartz et al. [106]
Table 9Summary of sensitivity analysis impact for individual components
Outcome Dollar value ($ million) Health indicator value
Base case Low case High case Base case Low case High case Unit
Total cost 1.79 2.60 0.98
HIV 1.50 0.75 2.25 3.7 1.8 5.5 Cases
HCV 1.44 0.72 2.17 21 11 32 Cases
SSTI 0.93 0.47 1.40 374 187 561 Hospital days
Overdose deaths 3.00 1.50 4.50 5.9 3.0 8.9 Deaths
OD ambulance calls 0.08 0.04 0.12 108 54 162 Calls
OD ER visits 0.11 0.05 0.16 78 39 117 ER visits
OD hospitalizations 0.07 0.03 0.10 27 13 40 Hospitalizations
would increase new people in treatment from 121 to 182 and financial savings to $960,000. This would increase the overall cost-benefit ratio from 4.35 to 4.53 and net annual savings from $5.98 to $6.30 million. Lowering the rate by 50%, to 2.89%, would reduce new people in treatment to 61 and financial savings to $320,000, for an overall cost-benefit ratio of 4.17 and net savings of $5.66 million.
Discussion
Our analysis finds a significantly favorable cost-benefit ratio and net benefits in all scenarios for a SIF in Baltimore, MD. Our base case scenario predicts that every dollar spent would return $4.35 in savings. We estimate that a single, 13-booth facility would generate annual net savings of $5.98 million, which is equivalent to 28% of the city health department’s entire budget for harm reduction and disease prevention [54]. The study predicts that a SIF would prevent 5.9 overdose deaths per year.
Compared to Irwin et al.’s [31] cost-benefit analysis of a SIF in San Francisco, our study estimates the cost-benefit ratio for a Baltimore SIF to be 87% higher (4.35 versus 2.33) and net savings to be 71% higher ($6.0 million versus $3.5 million). A Baltimore SIF would have lower costs, lower benefits from SSTI prevention, similar benefits related to HIV, HCV, and MAT, and much higher benefits related to overdose deaths. Our study also incorporates additional outcomes, demon-strating that a SIF could generate sizeable benefits by preventing ambulance calls, emergency room visits, and hospital stays related to nonfatal overdose.
The most significant difference between the San Francisco and Baltimore studies relates to the SIF’s im-pact on overdose deaths. We predict 5.9 lives saved per year in Baltimore, compared to 0.24 lives in San Francisco [31]. This difference stems primarily from the much higher overdose death rate in Baltimore.
While both cities have roughly 20,000 PWID,
Baltimore has more than 20 times more heroin-related overdose deaths. We also use a more advanced metho-dology—mapping the concentration of overdose deaths—to estimate this outcome.
The SIF’s impact on overdose prevention would com-plement the Baltimore City Health Department’s exten-sive efforts to prevent overdose through trainings and naloxone distribution in community, treatment, and cor-rections settings. The city has trained over 17,500 Baltimore residents in overdose prevention, including use of the overdose reversal drug naloxone [55]. A SIF would ensure that when PWID overdose, they do so in the presence of staff trained to administer naloxone. In addition, a SIF would prevent overdose deaths outside the facility because SIF staff provide PWID with safer injecting education, stressing the importance of injecting where naloxone is available.
Our results also suggest that a SIF would become a key component of Baltimore’s continued efforts to re-duce viral infections among PWID. Preventing four HIV and 21 HCV infections every year would reduce total in-cidence of both HIV and HCV by roughly 5%. The SIF would allow service providers to locate PWID, test them for viral infection, refer them for HIV and HCV treat-ment, and retain them in treatment. It thus addresses all four aspects of the 2017 HIV prevention strategy of the National Institute on Drug Abuse: “seeking, testing, treating, and retaining” PWID and other populations in need of HIV care [56].
Our estimate that a SIF would save close to a million dollars per year in SSTI hospital costs shows the benefits of removing a small population of“frequent fliers” from emergency rooms and hospitals. Still, since San Francisco has both a more serious SSTI problem due to the prevalence of black tar heroin and higher hospital costs, this area of benefits is smaller for Baltimore.
Our estimate of 121 PWID entering MAT in Baltimore is similar to Irwin et al.’s [31] estimate of 110 PWID in San Francisco. However, in both cities, the tual number will depend on the existing ease of MAT ac-cess, as well as the efforts by SIF staff to refer PWID to treatment. Baltimore can maximize these benefits by in-creasing funding to MAT programs, making treatment referrals a priority for SIF staff, and establishing the SIF near existing treatment providers for easy referral and follow-up.
Table 10Summary of sensitivity analysis impact on overall results
Variable tested Cost-benefit ratio Net savings ($ million)
Base case Low case High case Base case Low case High case
Operating cost 4.35 2.99 7.96 5.98 5.17 6.79
Syringe sharing rate 4.35 3.52 5.17 5.98 4.51 7.46
SSTI rate 4.35 4.09 4.61 5.98 5.52 6.45
Overdose death rate 4.35 3.51 5.19 5.98 4.48 7.48
Nonfatal OD rate 4.35 4.28 4.42 5.98 5.86 6.11
Our sensitivity analysis illustrates that the SIF’s operat-ing cost has a significant impact on the overall cost-benefit ratio, though less of an impact on net savings. While we used a conservatively high cost estimate, stra-tegic staffing, location, and procedural decisions by both SIF executives and local government officials could re-duce costs and further increase the net benefits. Cost-effectiveness in Baltimore would be significantly higher largely because Baltimore has lower real estate values, salaries, cost of living, and cost of doing business [31].
There are a number of lessons from the initial opera-tions of Insite which could inform the overall costs asso-ciated with a SIF in Baltimore. For example, Health Canada’s protocols required Insite to call an ambulance for every overdose incident, resulting in unnecessary costs given the ability to reverse overdose at Insite [57]. We recommend that the Baltimore City Health Depart-ment work with a local SIF, with extensive peer involve-ment, to consider the health, social, and economic impact of any such protocols.
The continuum of care provided at the SIF has im-portant implications for its impact. An integrated SIF model would co-locate detoxification, treatment, medical care, mental health care, housing, employment, govern-ment benefits, and legal services. Such a model would facilitate service uptake for a population that faces a number of barriers in accessing services.
We should note that it is difficult to ascertain who exactly would ultimately receive the savings documented in this study. Savings from the HIV, HCV, SSTI, and nonfatal overdose outcomes all accrue to the health care system, but the real beneficiaries are difficult to pin down. Holtgrave [58] and Mehta [6] estimate that the public sector bears the greatest share of HIV treatment costs, in particular Medicaid. Whether PWID have pri-vate insurance, Medicare/Medicaid, or no insurance, the savings ultimately reach federal, state, and local tax-payers, as well as everyone who pays health care pre-miums and hospital bills. MAT savings are split between medical care and reduced crime committed to get money to buy drugs. Overdose death savings represent value to the overall local economy from that person’s fu-ture contributions.
Limitations
This cost-benefit analysis faces a number of limitations. First, this study does not tackle the political, legal, and social barriers confronting the efforts to establish a SIF in Baltimore. In spring 2017, a second attempt to authorize safe consumption spaces in Maryland failed in the Maryland State Assembly. This effort faces oppos-ition concerns similar to SIF campaigns in other cities, including fears of “enabling”drug use, “Not In My Back Yard,” and potential legal vulnerability to prosecution
under federal drug statutes [59–61]. It also faces more unique challenges—while the opiate epidemic’s recent damage to white, middle-class communities has grabbed media attention, Baltimore’s heroin crisis is decades old and fails to generate the same political capital for action because it primarily impacts lower-income African-American communities [62].
To address these issues, advocates have formed a co-alition of public health practitioners, current and former drug users, community organizers, and academics. Over the past year, the coalition has been meeting with the local health department, social service providers, drug users, politicians, and community leaders. In addition to garnering local and state political support, a Baltimore SIF campaign will only be successful if it involves the af-fected communities and elevates their voices.
Our study’s estimates of health and economic out-comes also face limitations. Without specific plans for a facility, some variables are difficult to estimate. Since there are no actual regulations, guidelines, or actual physical plans for a SIF in Baltimore, we can only make a conservative guess at facility cost. Once regulations are established and plans for construction and operation have been created, an updated cost analysis should be performed. Similarly, the SIF’s success at referring PWID to treatment would depend on staffing decisions, the protocol for treatment referrals, and the convenience and availability of effective treatment options.
In addition, our models are difficult to verify because a number of important health indicators are not well doc-umented for Baltimore’s PWID population. For example, researchers have noted that resources have not been de-voted to accurately measuring the Baltimore PWID pop-ulation’s HCV prevalence, much less the HCV incidence or the impact of needle sharing [63]. Also, available data conflicts on the prevalence of SSTI and rates of SSTI hospitalization among PWID. Other variables, from the average number of needle-sharing partners to the rate of ambulance calls to nonfatal overdose, are based on a sin-gle study and should be corroborated.
The study’s accuracy would also benefit from specific cost information. The costs of HIV and HCV care, SSTI hospitalization, medication-assisted treatment, and overdose-related ambulance calls, emergency room visits, and hospital stays have all been approximated using fig-ures for the general population. We consider all of these to be underestimates of the actual costs, since PWID tend to require more services and supervision [64].
or between viral infection and SSTI. While these effects would likely have a minor impact on our overall find-ings, if relevant data becomes available, our analysis should be updated accordingly.
Finally, the impact of the SIF will depend on how well the SIF and co-located service providers align with the unique features of Baltimore’s population of PWID. Studies have shown that the effectiveness of harm reduc-tion programs depends on their considerareduc-tion of ethni-city, gender, age, homelessness, inequality, social networks, drug markets, and other demographic and so-cial factors [65–70]. We have used the best local health data available to tailor our analysis to Baltimore’s unique risk factors and social environment. However, the ultim-ate impact of a SIF in Baltimore will depend on how well the facility adapts to this environment by studying, con-sulting, and collaborating with the local PWID popula-tion [71–73].
Conclusions
Despite the present study’s limitations, it demonstrates that a SIF in Baltimore would bring significant cost sav-ings and public health benefits to the city. A single 13-booth SIF facility in Baltimore City modeled on Insite in Vancouver would generate medical and economic sav-ings of roughly $7.77 million per year. At a total cost of $1.79 million per year, every dollar spent would generate an estimated $4.35 in savings. To put the $5.98 net an-nual savings for a single SIF in perspective, they equal 28% of the Baltimore City Health Department’s budget for harm reduction and disease prevention.
In terms of health outcomes, we estimate that every year, a SIF would prevent 3.7 HIV infections, 21 HCV infections, 374 days in the hospital for skin and soft-tissue infection, 5.9 overdose deaths, 108 overdose am-bulance calls, 78 overdose emergency room visits, and 27 overdose-related hospitalizations, while bringing an additional 121 PWID into treatment.
We recommend that the city avoid excessive regula-tion of a SIF and maximize the linkages to services for the PWID population. We also recommend that re-searchers carefully track health indicators and medical costs associated with the PWID population before and after establishing a SIF in order to evaluate the facility’s benefits.
SIFs provide other important benefits in addition to those quantified in this study. They decrease public in-jection, prevent physical and sexual violence against PWID, and reduce syringe littering [38, 74–76]. They facilitate research to better understand the PWID popu-lation [77]. Lastly, they allow social service providers to harness the power of PWID peer networks and bring important programs to the hard-to-reach PWID popula-tion [78–80].
Establishing a SIF in Baltimore would bring a number of well-established medical, financial, and societal bene-fits. We do not believe that health initiatives like SIFs should be judged purely on financial terms. However, we hope that this cost-benefit analysis provides a helpful starting point to assess the potential impact on Baltimore of a supervised injection facility.
Abbreviations
DHMH:Department of Health and Mental Hygiene (Maryland); HCV: Hepatitis C virus; HIV: Human immunodeficiency virus; MAT: Medication-assisted treatment; MSIC: Medically Supervised Injecting Centre (SIF in Sydney); OD: Overdose; PWID: People who inject drugs; SIF: Supervised injection facility; SSTI: Skin and soft-tissue infection
Acknowledgements
Not applicable.
Funding
The contribution by AI was supported by the Criminal Justice Policy Foundation and the Law Enforcement Action Partnership. The contribution by EJ was supported by theCanadian Institutes of Health Research(CIHR) Postdoctoral Fellowship(201511MFE-358449-223266).The contributions by SGS and BWW were supported by the Johns Hopkins University Center for AIDS Research (P30AI094189). The contribution by STA was supported by a grant from the National Institute on Drug Abuse (T32DA007292, PI: Renee M. Johnson). The contribution by AL was supported by the Criminal Justice Policy Foundation and by Amherst College.
Availability of data and materials
All data used in the current study are furnished in the text and tables. All calculations are available from the corresponding author on a reasonable request.
Authors’contributions
AI designed most of the models, performed the calculations, and took the lead in writing the manuscript. EJ found data for use in the models, designed the models for HIV and HCV, and assisted in formatting and editing the manuscript. AL found data for use in the models. STA conducted the overdose mapping analysis. BWW supplied data for use in the models and assisted with the overdose mapping analysis. SGS assisted in writing and editing the manuscript. All authors read and approved the final manuscript.
Competing interests
The authors declare that they have no competing interests.
Consent for publication
Not applicable.
Ethics approval and consent to participate
Not applicable.
Publisher’s Note
Springer Nature remains neutral with regard to jurisdictional claims in published maps and institutional affiliations.
Author details
1Law Enforcement Action Partnership, Silver Spring, MD, USA.2Criminal
Justice Policy Foundation, Silver Spring, MD, USA.3British Columbia Centre for Disease Control, University of British Columbia, Vancouver, Canada. 4
Received: 28 February 2017 Accepted: 5 May 2017
References
1. DHMH. Drug- and alcohol-related intoxication deaths in Maryland, 2015. Maryland Department of Health and Mental Hygiene Report, September 2016. Accessed 23 Feb 2017, at http://bha.dhmh.maryland.gov/OVERDOSE_ PREVENTION/Documents/2015%20Annual%20Report_revised.pdf. 2. Amlani A, McKee G, Khamis N, Raghukumar G, Tsang E, Buxton JA. Why the
FUSS (Fentanyl Urine Screen Study)? A cross-sectional survey to characterize an emerging threat to people who use drugs in British Columbia, Canada. Harm Reduction J. 2015;12(1):54.
3. Peterson AB. Increases in fentanyl-related overdose deaths—Florida and Ohio, 2013–2015. MMWR Morb Mortal Wkly Rep. 2016;65(33);844–49. 4. Sutter ME, Gerona RR, Davis M, Roche BM, Colby DK, Chenoweth JA, Adams
AJ, Owen KP, Ford JB, Black HB, Albertson TE. Fatal fentanyl: one pill can kill. Acad Emerg Med. 2016;24(1):106-13.
5. McIntyre IM, Anderson DT. Postmortem fentanyl concentrations: a review. J Forensic Res. 2012;3(157):2.
6. Mehta S. Personal correspondence of Dr. Shruti Mehta, Johns Hopkins University Bloomberg School of Public Health Department of Epidemiology, with Susan Sherman, January 15, 2017.
7. Centers for Disease Control and Prevention (CDC). HIV infection and HIV-associated behaviors among injecting drug users—20 cities, United States, 2009. MMWR Morb Mortal Wkly Rep. 2012;61(8):133.
8. Centers for Disease Control and Prevention. CDC—HIV/AIDS, viral hepatitis, sexually transmitted infections, and tuberculosis: FY 2015 President’s Budget Request. https://www.cdc.gov/budget/documents/fy2015/hivaids-factsheet. pdf. 2014. Accessed 20 May 2015
9. Smith ME, Robinowitz N, Chaulk P, Johnson KE. High rates of abscesses and chronic wounds in community-recruited injection drug users and associated risk factors. J Addict Med. 2015;9(2):87.
10. Binswanger IA, Takahashi TA, Bradley K, Dellit TH, Benton KL, Merrill JO. Drug users seeking emergency care for soft tissue infection at high risk for subsequent hospitalization and death. J Stud Alcohol Drugs. 2008;69(6):924–32. 11. Takahashi TA, Maciejewski ML, Bradley K. US hospitalizations and costs for
illicit drug users with soft tissue infections. J Behav Health Serv Res. 2010; 37(4):508–18.
12. MSIC Evaluation Committee. Final report of the evaluation of the Sydney Medically Supervised Injecting Centre. MSIC Evaluation Committee; 2003. 13. UHRI. Findings from the evaluation of Vancouver’s Pilot Medically
Supervised Safer Injecting Facility - Insite. Urban Health Research Initiative, British Columbia Centre for Excellence in HIV/AIDS, June 2009. http://uhri. cfenet.ubc.ca/wp-content/uploads/images/Documents/insite_report-eng. pdf. Accessed 21 Feb 2017
14. KPMG. Further evaluation of the medically supervised injecting centre during its extended trial period (2007–2011): final report.
15. Wood E, Tyndall MW, Montaner JS, Kerr T. Summary of findings from the evaluation of a pilot medically supervised safer injecting facility. Can Med Assoc J. 2006;175(11):1399–404.
16. Kerr T, Kimber J, DeBeck K, Wood E. The role of safer injection facilities in the response to HIV/AIDS among injection drug users. Current HIV/AIDS Reports. 2007;4(4):158–64.
17. Wood E, Tyndall MW, Stoltz JA, Small W, Zhang R, O’Connell J, Montaner JS, Kerr T. Safer injecting education for HIV prevention within a medically supervised safer injecting facility. Int J Drug Policy. 2005;16(4):281–4. 18. Lloyd-Smith E, Wood E, Zhang R, Tyndall MW, Sheps S, Montaner JS, Kerr
T. Determinants of hospitalization for a cutaneous injection-related infection among injection drug users: a cohort study. BMC Public Health. 2010;10(1):327.
19. Small W, Wood E, Lloyd-Smith E, Tyndall M, Kerr T. Accessing care for injection-related infections through a medically supervised injecting facility: a qualitative study. Drug Alcohol Depend. 2008;98(1):159–62.
20. Salmon AM, Dwyer R, Jauncey M, van Beek I, Topp L, Maher L. Injecting-related injury and disease among clients of a supervised injecting facility. Drug Alcohol Depend. 2009;101(1):132–6.
21. Wood E, Tyndall MW, Zhang R, Montaner JS, Kerr T. Rate of detoxification service use and its impact among a cohort of supervised injecting facility users. Addiction. 2007;102(6):916–9.
22. Sherman SG, Hunter K, Rouhani S. Safe drug consumption spaces: a strategy for Baltimore City. Abell Report. 2017;29(7).
23. Andresen MA, Jozaghi E. The point of diminishing returns: an examination of expanding Vancouver’s Insite. Urban Stud. 2012;49(16): 3531–44.
24. Pinkerton SD. How many HIV infections are prevented by Vancouver Canada’s supervised injection facility? Int J Drug Policy. 2011;22(3):179–83. 25. Jozaghi E, Reid AA, Andresen MA. A cost-benefit/cost-effectiveness analysis
of proposed supervised injection facilities in Montreal, Canada. Subst Abuse Treat Prev Policy. 2013;8(1):25.
26. Bayoumi AM, Strike C, Brandeau M, Degani N, Fischer B, Glazier R. Report of the Toronto and Ottawa supervised consumption assessment study, 2012. CATIE website; 2012. http://www.catie.ca/sites/default/files/
TOSCA%20report%202012.pdf. Accessed 12 May 2017.
27. Enns EA, Zaric GS, Strike CJ, Jairam JA, Kolla G, Bayoumi AM. Potential cost‐ effectiveness of supervised injection facilities in Toronto and Ottawa, Canada. Addiction. 2016;111(3):475–89.
28. Jozaghi E, Jackson A. Examining the potential role of a supervised injection facility in Saskatoon, Saskatchewan, to avert HIV among people who inject drugs. Int J Health Policy Manage. 2015;4(6):373.
29. Jozaghi E, Reid AA, Andresen MA, Juneau A. A cost-benefit/cost-effectiveness analysis of proposed supervised injection facilities in Ottawa, Canada. Subst Abuse Treat Prev Policy. 2014;9(1):31.
30. Jozaghi E, Reid AA. The potential role for supervised injection facilities in Canada’s largest city, Toronto. Int Crim Justice Rev. 2015;25(3):233–46. 31. Irwin A, Jozaghi E, Bluthenthal RN, Kral AH. A cost-benefit analysis of a
potential supervised injection facility in San Francisco, California, USA. J Drug Issues. 2016;47(2):164-84.
32. Health Canada. Vancouver’s Insite service and other supervised injection sites: what has been learned from the research? Final report. 2008, March 31; Expert Advisory Committee on Supervised Injection Site Research. Ottawa, Ontario. 33. Maynard R. Personal correspondence of Russell Maynard, Director of Policy
and Research, Portland Hotel Society Community Services, Vancouver, with Dr. Ehsan Jozaghi, February 10, 2017.
34. Jozaghi E, Hodgkinson T, Andresen MA. Is there a role for potential supervised injection facilities in Victoria, British Columbia, Canada? Urban Geography. 2015;36(8):1241–55.
35. Expatistian. Cost of living comparison between Baltimore, Maryland, United States and Vancouver, Canada. Expatistan Cost of Living Index. 2016, December. Cost of living comparison between Baltimore, Maryland, United States and Vancouver, Canada. Accessed 11 Dec 2016. https://www. expatistan.com/cost-of-living/comparison/vancouver/baltimore. 36. Primeau M. San Francisco Department of Public Health, 2013; Accessed 9
Nov 2015. https://www.sfdph.org/dph/files/hc/HCAgen/2013/jan%2015/ mark's%20narrative.pdf
37. Bayoumi AM, Zaric GS. The cost-effectiveness of Vancouver’s supervised injection facility. Can Med Assoc J. 2008;179(11):1143–51.
38. Stoltz JA, Wood E, Small W, Li K, Tyndall M, Montaner J, Kerr T. Changes in injecting practices associated with the use of a medically supervised safer injection facility. J Public Health. 2007;29(1):35–9.
39. Jacobs P, Calder P, Taylor M, Houston S. Cost effectiveness of Streetworks’ needle exchange program of Edmonton. Can J Public Health. 1999;90(3):168. 40. Kerr T, Tyndall M, Li K, Montaner J, Wood E. Safer injection facility use and
syringe sharing in injection drug users. Lancet. 2005;366(9482):316–8. 41. DHMH. Baltimore City HIV/AIDS Epidemiological Profile, Fourth Quarter
2012. Maryland Department of Health and Mental Hygiene Center for HIV Surveillance Report, 2013.
42. Bradley H, Hall HI, Wolitski RJ, Van Handel MM, Stone AE, LaFlam M, Skarbinski J, Higa DH, Prejean J, Frazier EL, Patel R. Vital signs: HIV diagnosis, care, and treatment among persons living with HIV—United States, 2011. MMWR Morb Mortal Wkly Rep. 2014;63(47):1113–7. 43. Mehta SH, Astemborski J, Kirk GD, Strathdee SA, Nelson KE, Vlahov D,
Thomas DL. Changes in blood-borne infection risk among injection drug users. J Infect Dis. 2011;203(5):587–94.
44. Andresen MA, Boyd N. A cost-benefit and cost-effectiveness analysis of Vancouver’s supervised injection facility. Int J Drug Policy. 2010;21(1):70–6. 45. Milloy MS, Kerr T, Tyndall M, Montaner J, Wood E. Estimated drug overdose
deaths averted by North America’s first medically-supervised safer injection facility. PLoS One. 2008;3(10):e3351.
47. DHMH. Drug- and alcohol-related intoxication deaths in Maryland: data update through 3rd quarter 2016. Maryland Department of Health and Mental Hygiene Report, 2017. Accessed 23 Feb 2017, at http://bha.dhmh. maryland.gov/OVERDOSE_PREVENTION/Documents/Quarterly%20report_ 2016_Q3_final.pdf.
48. BCFD. Personal correspondence of Baltimore City Fire Department Emergency Medical Services with Brian Weir, February 23, 2017. 49. Genberg BL, Gange SJ, Go VF, Celentano DD, Kirk GD, Mehta SH. Trajectories
of injection drug use over 20 years (1988–2008) in Baltimore, Maryland. Am J Epidemiol. 2011;173(7):829–36. kwq441.
50. Pollini RA, McCall L, Mehta SH, Vlahov D, Strathdee SA. Non-fatal overdose and subsequent drug treatment among injection drug users. Drug Alcohol Depend. 2006;83(2):104–10.
51. Cartwright WS. Cost–benefit analysis of drug treatment services: review of the literature. J Ment Health Policy Econ. 2000;3(1):11–26.
52. Harris AH, Gospodarevskaya E, Ritter AJ. A randomised trial of the cost effectiveness of buprenorphine as an alternative to methadone maintenance treatment for heroin dependence in a primary care setting. Pharmacoeconomics. 2005;23(1):77–91.
53. CHPDM. Review of cost-benefit and cost-effectiveness literature for methadone or buprenorphine as a treatment for opiate addiction. Baltimore County: Center for Health Program Development and Management at the University of Maryland; 2007. http://www. hilltopinstitute.org/publications/Cost_benefit_Opiate_Addiction_August_ 29_2007.pdf. Accessed 7 Jan 2016.
54. Board of Estimates. Fiscal 2015 Agency Detail. Board of Estimates Recommendations, Volume 1, 2015. Accessed 19 Feb 2017, at http://ca. baltimorecity.gov/flexpaper/docs/Agency_Detail_Vol1_FINAL%20web.pdf. 55. BCHD. Baltimore City overdose prevention and response information.
Baltimore City Health Department website, 2017. http://health.baltimorecity. gov/opioid-overdose/baltimore-city-overdose-prevention-and-response-information. Accessed February 21, 2017.
56. NIDA. Fiscal Year 2017 Funding Priorities. National Institute on Drug Abuse AIDS Research Program Research and Funding Priorities. 2016, October. Accessed 20 Oct 2016 at https://www.drugabuse.gov/sites/default/files/ fy17priorities.pdf
57. Evans S. Personal correspondence of Sarah Evans, former Insite Director, with Amos Irwin, May 8, 2015.
58. Holtgrave D. Personal correspondence of Dr. David Holtgrave, Johns Hopkins University Bloomberg School of Public Health Chair of the Department of Health, Behavior, and Society, with Susan Sherman, January 15, 2017. 59. Beletsky L, Davis CS, Anderson E, Burris S. The law (and politics) of safe
injection facilities in the United States. Am J Public Health. 2008;98(2):231–7. 60. Semaan S, Fleming P, Worrell C, Stolp H, Baack B, Miller M. Potential role of
safer injection facilities in reducing HIV and hepatitis C infections and overdose mortality in the United States. Drug Alcohol Depend. 2011;118(2):100–10. 61. Tempalski B, Friedman R, Keem M, Cooper H, Friedman SR. NIMBY localism
and national inequitable exclusion alliances: the case of syringe exchange programs in the United States. Geoforum. 2007;38(6):1250–63.
62. Lopez G. When a drug epidemic’s victims are white. Vox, April 4, 2017. Accessed 27 Apr 2017 at http://www.vox.com/identities/2017/4/4/ 15098746/opioid-heroin-epidemic-race.
63. Nolan, N. Hepatitis C infection in Baltimore: a need for funding. JHSPH PHASE Internship Program, BCHD Acute Communicable Diseases Department. Accessed 18 Feb 2017, at http://dhmh.maryland.gov/phase/ documents/nolan_nichole.pdf.
64. Ding L, Landon BE, Wilson IB, Wong MD, Shapiro MF, Cleary PD. Predictors and consequences of negative physician attitudes toward HIV-infected injection drug users. Arch Intern Med. 2005;165(6):618–23.
65. Cooper HL, Linton S, Kelley ME, Ross Z, Wolfe ME, Chen YT, Zlotorzynska M, Hunter-Jones J, Friedman SR, Des Jarlais D, Semaan S. Racialized risk environments in a large sample of people who inject drugs in the United States. Int J Drug Policy. 2016;27:43–55.
66. Hottes TS, Bruneau J, Daniel M. Gender-specific situational correlates of syringe sharing during a single injection episode. AIDS Behav. 2011;15(1):75–85. 67. Tassiopoulos K, Bernstein J, Bernstein E. Age and sharing of needle injection
equipment in a cohort of Massachusetts injection drug users: an observational study. Addict Sci Clin Pract. 2013;8(1):20.
68. Zivanovic R, Milloy MJ, Hayashi K, Dong H, Sutherland C, Kerr T, Wood E. Impact of unstable housing on all-cause mortality among persons who inject drugs. BMC Public Health. 2015;15(1):106.
69. Nikolopoulos GK, Fotiou A, Kanavou E, Richardson C, Detsis M, Pharris A, Suk JE, Semenza JC, Costa-Storti C, Paraskevis D, Sypsa V. National income inequality and declining GDP growth rates are associated with increases in HIV diagnoses among people who inject drugs in Europe: a panel data analysis. PLoS One. 2015;10(4):e0122367.
70. Gyarmathy VA, Caplinskiene I, Caplinskas S, Latkin CA. Social network structure and HIV infection among injecting drug users in Lithuania: gatekeepers as bridges of infection. AIDS Behav. 2014;18(3):505–10. 71. McCann E, Temenos C. Mobilizing drug consumption rooms: inter-place
networks and harm reduction drug policy. Health & Place. 2015;31:216–23. 72. Jozaghi E. The role of peer drug users’social networks and harm reduction
programs in changing the dynamics of life for people who use drugs in the downtown eastside of Vancouver, Canada (Doctoral dissertation, Arts and Social Sciences).
73. Jozaghi E. Exploring the role of an unsanctioned, supervised peer driven injection facility in reducing HIV and hepatitis C infections in people that require assistance during injection. Health & Justice. 2015;3(1):16. 74. DeBeck K, Small W, Wood E, Li K, Montaner J, Kerr T. Public injecting among
a cohort of injecting drug users in Vancouver, Canada. J Epidemiol Community Health. 2009;63(1):81–6.
75. Salmon AM, Thein HH, Kimber J, Kaldor JM, Maher L. Five years on: what are the community perceptions of drug-related public amenity following the establishment of the Sydney Medically Supervised Injecting Centre? Int J Drug Policy. 2007;18(1):46–53.
76. Wood E, Kerr T, Small W, Li K, Marsh DC, Montaner JS, Tyndall MW. Changes in public order after the opening of a medically supervised safer injecting facility for illicit injection drug users. Can Med Assoc J. 2004;171(7):731–4. 77. Linden IA, Mar MY, Werker GR, Jang K, Krausz M. Research on a vulnerable
neighborhood—the Vancouver Downtown Eastside from 2001 to 2011. J Urban Health. 2013;90(3):559–73.
78. Small W, Van Borek N, Fairbairn N, Wood E, Kerr T. Access to health and social services for IDU: the impact of a medically supervised injection facility. Drug Alcohol Rev. 2009;28(4):341–6.
79. Tyndall MW, Kerr T, Zhang R, King E, Montaner JG, Wood E. Attendance, drug use patterns, and referrals made from North America’s first supervised injection facility. Drug Alcohol Depend. 2006;83(3):193–8. 80. Jozaghi E, Lampkin H, Andresen MA. Peer-engagement and its role in
reducing the risky behavior among crack and methamphetamine smokers of the Downtown Eastside community of Vancouver, Canada. Harm Reduction J. 2016;13(1):19.
81. Hunt D, Parker L. Baltimore City Syringe Exchange Program. Health Department: Baltimore, Maryland; 2016. Accessed from: http://www. aacounty.org/boards-and-commissions/HIV-AIDS-commission/presentations/ BCHD%20Needle%20Exchange%20Presentation9.7.16.pdf.
82. German D, Park JN, Powell C, Flynn C. Trends in HIV and injection behaviors among Baltimore injection drug users. Baltimore: Presentation at 10th National Harm Reduction Conference; 2014.
83. Park JN, Weir BW, Allen ST, and Sherman SG. Prevalence and correlates of experiencing and witnessing drug overdose among syringe service program clients in Baltimore, Maryland. (Manuscript in preparation). 84. Bluthenthal RN, Wenger L, Chu D, Lorvick J, Quinn B, Thing JP, Kral AH.
Factors associated with being asked to initiate someone into injection drug use. Drug Alcohol Depend. 2015;149:252–8.
85. Kaplan EH, O'Keefe E. Let the needles do the talking! Evaluating the New Haven needle exchange. Interfaces. 1993;23(1):7–26.
86. Kwon JA, Anderson J, Kerr CC, Thein HH, Zhang L, Iversen J, Dore GJ, Kaldor JM, Law MG, Maher L, Wilson DP. Estimating the cost-effectiveness of needle-syringe programs in Australia. Aids. 2012;26(17):2201–10. 87. Tempalski B, Cooper HL, Friedman SR, Des Jarlais DC, Brady J, Gostnell K.
Correlates of syringe coverage for heroin injection in 35 large metropolitan areas in the US in which heroin is the dominant injected drug. Int J Drug Policy. 2008;19:47–58.
88. CDC. HIV/AIDS, viral hepatitis, sexually transmitted infections, & tuberculosis. FY 2016 President’s Budget Request. 2015; Accessed 12 May 2017. https:// www.cdc.gov/budget/documents/fy2016/hivaids-factsheet.pdf .
91. Hsieh, Y-H. Personal correspondence of Dr. Yu-Hsiang Hsieh, Johns Hopkins Department of Emergency Medicine, with Andrew Lindsay, July 17, 2015. 92. Kerr T, Wood E, Grafstein E, Ishida T, Shannon K, Lai C, Montaner J, Tyndall
MW. High rates of primary care and emergency department use among injection drug users in Vancouver. J Public Health. 2005;27(1):62–6. 93. Stein MD, Sobota M. Injection drug users: hospital care and charges. Drug
Alcohol Depend. 2001;64(1):117–20.
94. Palepu A, Tyndall MW, Leon H, Muller J, O'shaughnessy MV, Schechter MT, Anis AH. Hospital utilization and costs in a cohort of injection drug users. Can Med Assoc J. 2001;165(4):415–20.
95. Rosenthal E. As hospital prices soar, a stitch tops $500. New York Times. 2013;12(3).
96. Harris HW, Young DM. Care of injection drug users with soft tissue infections in San Francisco, California. Arch Surg. 2002;137(11):1217–22. 97. BCFD. Personal correspondence of Baltimore City Fire Department
Emergency Medical Services with Brian Weir, February 23, 2017. 98. Census Bureau. Quickfacts for Baltimore City, Maryland. United States
Census Bureau website. 2015. Accessed 18 Feb 2017 at http://www.census. gov/quickfacts/table/RHI805210/24510
99. Kerr T, Tyndall MW, Lai C, Montaner JS, Wood E. Drug-related overdoses within a medically supervised safer injection facility. Int J Drug Policy. 2006; 17(5):436–41.
100. Astemborski J and Mehta S. Personal correspondence of Drs. Shruti Mehta and Jacquie Astemborski, Johns Hopkins University Bloomberg School of Public Health Department of Epidemiology, with Amos Irwin and Andrew Lindsay, July 16, 2015.
101. Baltimore County. Insurance carriers will begin paying for County EMS Transport. Police and Fire News, Baltimore County Government website, July 20, 2015.http://www.baltimorecountymd.gov/News/PoliceNews/iWatch/ keyword/ambulance Accessed 20 Feb 2017.
102. Rienzi G. Johns Hopkins pilots study on EMS treatment of substance abusers. Johns Hopkins University Gazette, Sept-Oct 2014. Accessed 26 Feb 2017. http://hub.jhu.edu/gazette/2014/september-october/focus-baltimore-city-ems/ 103. Pfuntner A, Wier LM, Steiner C. Costs for hospital stays in the United States,
2011: Statistical Brief# 168.
104. CSAM. Methadone treatment issues. California Society of Addiction Medicine website, 2011. http://www.csam-asam.org/methadone-treatment-issues Accessed 20 Feb 2017.
105. Gerstein DR, Johnson RA. Harwood HJ, Fountain D, Suter N, Malloy K. Evaluating recovery services: the California Drug and Alcohol Treatment Assessment (CALDATA), General Report. National Opinion Research Center (NORC) Report, 1994. Accessed January 7, 2016. https://www.ncjrs.gov/App/ publications/abstract.aspx?ID=157812.
106. Schwartz RP, Alexandre PK, Kelly SM, O'Grady KE, Gryczynski J, Jaffe JH. Interim versus standard methadone treatment: a benefit–cost analysis. J Subst Abus Treat. 2014;46(3):306–14.
• We accept pre-submission inquiries
• Our selector tool helps you to find the most relevant journal • We provide round the clock customer support
• Convenient online submission • Thorough peer review
• Inclusion in PubMed and all major indexing services • Maximum visibility for your research
Submit your manuscript at www.biomedcentral.com/submit