Inelastic collisions occur among regolith particles, such as those in the ejecta curtain from a crater, and may cause clustering or agglomeration of particles and thus produce discrete patterns of ejecta deposits around a crater. Previous studies have shown that clusters, and even agglomerates, are formed via mutual, inelastic collisions of spherical particles due to adhering forces between particles in granular streams. To investigate the condition of agglomerate formation in granular streams, we conducted laboratory experiments of granular streams using both spherical and irregular, non-spherical particles. Measurements of particle adhesion in this study were performed using a centrifugal separation method, in contrast to the previous study in which atomic force microscopy (AFM) was used. This enabled simultaneous measurements of multiple particles of various shapes for a statistical analysis of the results. With similar relative velocities and adhesion values, irregular particles were found to form agglomerates much more easily than spherical particles. The axial ratio of the agglomerates of spherical particles and irregular particles was similar and was in accordance with those observed in previous laboratory studies, whereas the size of the agglomerates of irregular particles was larger than the size of spherical particles. The degree of agglomeration and the size of agglomerates can be used as an indicator of the shape or adhesive force of the particles in granular stream. Our findings on agglomeration in granular streams could provide new insights into the origin of rays on airless bodies and grooves on Phobos.
Keywords:Regolith, Granular stream, Cohesion, Agglomerate
Introduction
The flow of granular material enables the formation of discrete structures due to inelastic collisions between particles. For example, high-speed camera observations of the ejection of glass beads and silica sand from craters recorded in laboratory impact experiments have revealed mesh-like patterns in the ejecta curtain (Kadono et al. 2015). Such patterns have also been reproduced using numerical simulations of particles with non-unity resti-tution coefficients (Kadono et al. 2015). It is possible that this process is relevant to the origin of rays around fresh craters on the Moon or other planetary bodies (Kadono et al.2015).
The simplest granular flow is a stream of particles. A laboratory observation of free-falling streams of spherical particles has shown that uniform streams initially form
clusters as they fall under Earth’s gravity (Royer et al. 2009). The clusters are connected by bridges, and the bridges become thinner as the clusters fall downward, breaking apart from one another to form discrete clus-ters. A numerical simulation (Waitukaitis et al. 2011) has shown that particles forming droplets have a very small relative velocity and that the average coordination number (i.e., the number of contacts of each particle with other particles) is approximately 4. A previous la-boratory experiment (Royer et al. 2009) showed that discrete clusters do not change their shape significantly after formation until they are destroyed via air drag; based on the above information, these are most likely agglomerates, not just clusters. Here, “cluster”is defined as a group of particles regardless of whether or not they adhere, and“agglomerate” is defined as a group of parti-cles that adhere to one another. Henceforth, this paper refers to the groups of particles formed in granular streams as agglomerates, although Royer et al. (2009) re-fers to them as clusters. Royer et al. (2009) indicated that * Correspondence:[email protected]
1Graduate School of Science, Kobe University, 1-1 Rokkodaicho, Nada-ku, Kobe 657-8501, Japan
Full list of author information is available at the end of the article
the formation of agglomerates is due to the adhesive force produced by a combination of van der Waals inter-actions and capillary forces between nanoscale surface asperities and not due to hydrodynamic interactions with ambient gas. It has also been experimentally im-plied that the formation of agglomerates is insensitive to the restitution coefficient of particles (Royer et al.2009). A subsequent numerical study showed that a lower resti-tution coefficient of particles acts to increase collimation of the stream and that the adhesive force drives agglom-erate formation (Waitukaitis et al. 2011), which agrees with laboratory experiments (Royer et al.2009).
To obtain a better understanding of the conditions re-quired for the formation of agglomerates in a granular stream and to apply the conditions of impact phenom-ena on asteroids and other celestial bodies, we con-ducted laboratory experiments of granular streams with an emphasis on irregular, non-spherical particles, which are a more suitable analogue of regolith particles than spherical particles are. As mentioned above, mesh-like patterns have been observed in the ejecta curtain in la-boratory impact experiments (Kadono et al.2015). Keep-ing this in mind, we turned our attention to the ejecta curtain produced by an artificial impactor, such as the small carry-on impactor (SCI) of the Hayabusa2 asteroid mission of ISAS/JAXA (Arakawa et al.2017), or that was produced by natural collisions of meteoroids on the regolith surface of small bodies. The ejecta curtain from the surface of a small body is expected to show discrete structures, such as mesh patterns, clusters, or agglomer-ates of regolith particles. In this study, we attempted to demonstrate how the study of these structures could re-veal valuable information about the physical properties of regolith particles.
Methods/Experimental
Particles
We used poly-dispersed spherical glass beads with median diameters of 55 μm (hereafter called 50 μm beads) and 93μm (100μm beads) (Fujikihan Co., Ltd.). To examine the effect of the shape on the agglomeration of particles in granular streams, we also used irregular alumina particles with a median diameter of 77 μm (The Association of Powder Process Industry and Engineering, JAPAN) and silica sand grains (Miyazaki Chemical Co., Ltd.) with a median diameter of 73μm, which were prepared using a sieve with a 45μm mesh opening to reduce fine particles, as in a previous study (Omura et al. 2016). Among the particles, the silica sand grains are the most representative of the regolith particles on asteroids in terms of compos-ition, size, and shape (e.g., Omura and Nakamura 2017). We also show the size distributions of the samples deter-mined by two methods: using a laser diffractometer (SHI-MAZU SALD-3000S) installed at Kobe University, and
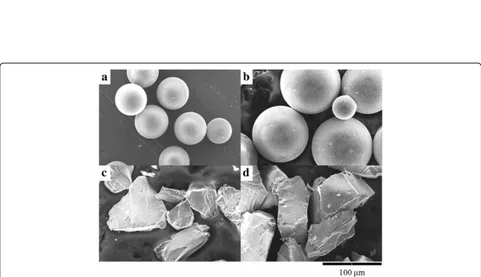
using an optical microscope (Nikon ECLIPSE ME600) and a digital camera (Nikon D300), shown in Fig.1. Both size distributions are consistent. Figure2shows scanning elec-tron microscopy (SEM) images of the particles. The roughnesses of the glass bead were examined using a laser confocal refractometer. The vertical height of the surface was measured with 1μm spacing and a vertical resolution of 0.1 μm (0.2 μm reproducibility is guaranteed by the supplier). According to Gadelmawla et al. (2002), the aver-age roughness of a surface,Ra, is defined as follows:
Ra ¼1n
Xn
i¼1j jyi ð1Þ
whereyiis the vertical deviation from the mean line. We
approximated the mean curved line by a polynomial function.Rawas 1.13 ± 0.24μm for the 50μm beads and
3.82 ± 0.45μm for the 100μm beads. The restitution co-efficient of a glass sphere (diameter 3.2 mm) against a 10-mm-thick glass plate measured using an acoustic emission sensor (Higa et al. 1996) was 0.957 ± 0.012 for a collision velocity in the range of 0.5–1.3 ms−1
. The restitution coefficient of an alumina sphere with a diam-eter of 4 mm against a 10-mm-thick alumina plate was also measured and found to be 0.975 ± 0.006. Table 1
summarizes the physical characteristics of the particles.
Measurement of adhesive force
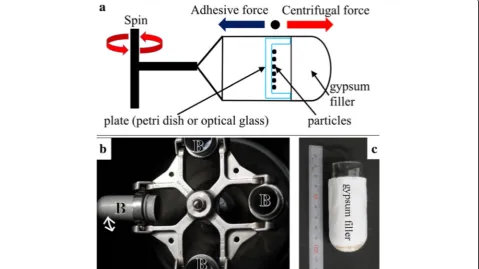
In the previous study of granular streams (Royer et al. 2009), the adhesive force between micron-sized spherical silica particles was measured using an atomic force microscope cantilever. In this study, however, we used a centrifugal separation method (centrifugal method) (e.g., Krupp 1967) to measure the adhesive force between a particle and a plate. This method can directly measure the adhesive force of multiple particles simultaneously, including those of different shapes, enabling a statistical analysis of the results.
Fig. 1Particle size distributions. Cumulative volume fractions plotted against the particle diameter.a50μm glass beads,b100μm glass beads,
calumina particles, anddsilica sand. Solid and dashed lines are the size distributions determined using a laser diffractometer and optical microscope images, respectively. In the latter, the diameter of the equivalent sphere of the projected area of the microscope image is used
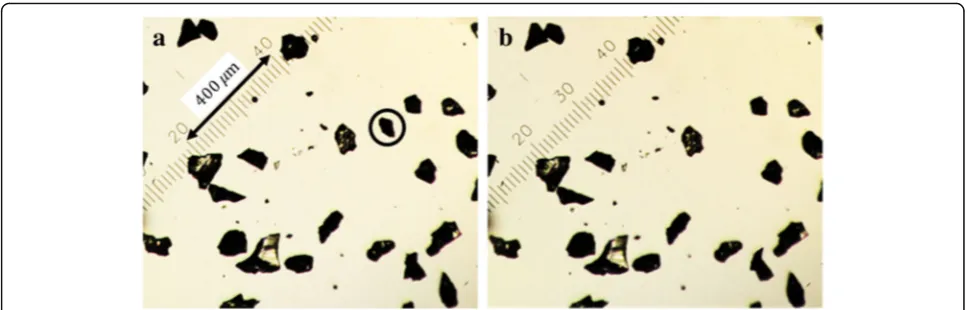
Petri dish with particles. Some particles were in contact with one or more particles; these particles were not in-cluded in the measurement results.
Next, the Petri dish was placed in a cylindrical basket with its surface normally aligned with the axis of the basket, as shown in Fig.3a. The basket was then put in a table-top centrifuge (Kubota KN-70) at Kobe University, as shown in Fig.3b. The distance from the axis of rota-tion to the surface of the Petri dish was set at 0.08 m or 0.12 m, according to the height of the gypsum filler shown in Fig. 3c. The basket was rotated at 300 rpm to apply a centrifugal force to particles adhered to the Petri dish. After a few minutes, the rotation was stopped and
the Petri dish was gently removed from the basket. We took an optical microscope image at the same location of the dish as before applying the centrifugal force, as shown in Fig. 4b. The Petri dish was then once again placed in the basket and rotated faster than before. This process was repeated, as the rotational speed was in-creased in 15 steps to 5000 rpm, which was the max-imum rotational speed of the centrifuge used in this experiment. The centrifugal force acting on the particles increased with the rotation speed. The particles subse-quently separated from the glass plate when the result-ant force of two forces, i.e., the centrifugal force and the force of gravity, which was approximately equal to the
Table 1Physical characteristics of particles
Particle type Density (kg m−
3) Surface energy (J m
−
2) Poissonν ’s ratio, (Pa)Young’s modulus,ε Roughness,(μm) Ra Restitutioncoefficient
Glass bead 50μm 2.5 × 10³ 0.025a 0.17b 7.3 × 10¹⁰b 1.13 ± 0.24 0.957 ± 0.013
Glass bead 100μm 2.5 × 10³ 0.025a 0.17b 7.3 × 10¹⁰b 3.82 ± 0.45 0.957 ± 0.013
Silica sand 73μm 2.645 × 10³c 0.025a 0.17b 7.3 × 10¹⁰b – –
Alumina particle 77μm
4.0 × 10³ 0.041d 0.24e 3.85 × 10¹¹e – 0.975 ± 0.006
a
Heim et al. (1999)
b
Spinner (1962)
c
The silica sand grains were used in a previous study (Omura et al.2016), but we updated the density of the grain according to a measurement of true density made using a pycnometer (SEISHIN ENTERPRISE MAT-7000)
d
Burnham et al. (1990)
e
Wong and Bollampally (1999)
centrifugal force, became larger than the adhesive force between the particle and the dish. Measurements were conducted four times for each particle type. The number of detached particles for which the measurement was completed was 29, 98, 262, and 596 for the 50μm beads, 100 μm beads, alumina particles, and silica sand grains, respectively. In the case of small particles, the centrifugal force applied was smaller than the adhesive force be-tween the particle and the Petri dish; thus, 71, 0, 92, and 29 particles remained on the Petri dish for the 50 μm beads, 100 μm beads, alumina particles, and silica sand grains, respectively.
We measured the vibration acceleration of the centri-fuge using an accelerometer placed on the top cover of the centrifuge and found that it was up to 0.21 G, which is considerably smaller than the centrifugal acceleration. In addition, because the basket could tilt freely from a verti-cal to horizontal position, the vertiverti-cal direction of the Petri dishes should have been in the direction of the resultant force of the centrifugal force and gravity, which was ap-proximately in the direction of the centrifugal force. Ad-hesive forces measured in this experiment included van der Waals, electrostatic forces, and the effects of moisture adsorption from the atmosphere on the particle surface. Regarding the electrostatic force, previous studies, such as that of Royer et al. (2009), involving granular streams indi-cated that this force is very small; as such, the electrostatic force contribution was assumed to be negligible in this study. As another concern, as indicated in the electron mi-croscopy image of Fig.2, it is conceivable that fine objects of a sub-micron to micron scale adhered to the particles; however, the essential point is that the adhesion of parti-cles in this state was measured and that granular stream experiments in the air were also conducted with the parti-cles in the same state.
The possible range of rotation speeds at which the par-ticle separated from the plate was determined based on
optical microscope images to estimate the adhesive force between the particle and the Petri dish. The mass of each particle, which was used for the calculation of the centrifugal force, was estimated using the size of the par-ticle from the images and the mass density value. The optical microscope images were then translated into bin-ary data using ImageJ software to measure the area based on the major and minor axes of each particle. For a glass bead, we assumed the shape to be a perfect sphere and determined the radius from the projected area, which enabled calculation of the volume. For an ir-regularly shaped particle of either alumina particles or silica sand, we assumed that the shape was instead el-lipsoidal. The axial ratios of the two-dimensional (2D) projections were 0.63 ± 0.16 with a median of 0.64 and 0.66 ± 0.16 with a median of 0.67 for the alumina parti-cles and silica sand grains, respectively. These values are smaller than the value of the medium to the maximum axial ratio (0.73) and larger than the minimum to the maximum axial ratio (0.50) of collisional fragments (Fujiwara 1978). We assumed that the axial ratio of the irregularly shaped particles was similar to that of colli-sional fragments as 2c:pffiffiffi2c:c, wherecis the minimum axis. We determined the value of c from the projected area S of the microscope image and calculated the vol-ume of particleVon the assumption that the minimum axis was along the line of sight, i.e., that the minimum axis was vertical to the Petri dish:
S¼πcffiffiffi2
2
p ; ð2Þ
V¼
ffiffiffi
2 p
πc3
3 : ð3Þ
calculated volumes together with the density of the ma-terial (shown in Table 1), the distance from the axis of rotation, and the rotation speed ω. The adhesive force between the particle and the Petri dish was then ob-tained as the geometric mean of the two subsequent centrifugalffiffiffiffiffiffiffiffiffiffiffiffiffiffiffiffiffiffiffiffiffiffiffiffiffiffiffiffiffiffiffiffiffiffiffiffiffiffiforces applied to the particle as
FcenðωiÞFcenðωiþ1Þ
p
, whereFcen(ωi) denotes the force at the maximum rotation speed ωi at which the particle remained on the Petri dish and Fcen(ωi+ 1) denotes the force at the rotation speedωi+ 1at which the particle no longer remained on the dish. Note that if we assume the extreme case of the maximum axis of a particle being along the line of sight when the optical microscope image is acquired, the volume estimate becomes 2pffiffiffi2 times larger than the above. Therefore, adhesive forces may be a few times larger than the current estimates.
The surface roughness (Ra) of the Petri dish was 0.18 μm. We used two optical glass plates with surface roughnesses of 0.032 and 0.046 μm, respectively, to examine the effect of the surface roughness on the cohe-sive force and particle shape.
Granular stream experiments
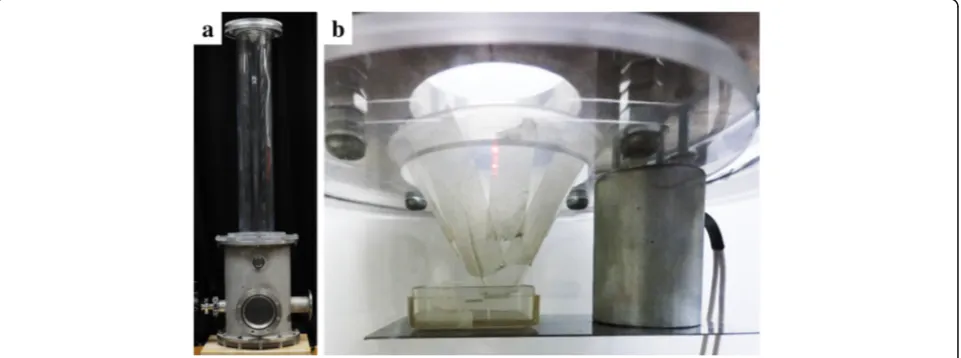
The granular stream experimental setup is shown in
Fig.5a, b. The experiments were performed in a vacuum
chamber with a diameter of 1.5 m and a height of 2.0 m in ISAS/JAXA and in a chamber with a diameter of 0.15 m and a height of 1.5 m at Kobe University. We changed the ambient pressure in the vacuum chamber to examine the effect on agglomeration. The ambient pressure was set to between 3 and 105Pa for the ISAS experiments, and between 10 and 105Pa for Kobe Uni-versity experiments. A plastic funnel containing the sam-ple particles was placed at a height of 1.8 m and 1.5 m from the bottom of the chambers for the ISAS and Kobe
University experiments, respectively. The particles exited the bottom of the funnel through an aperture (diameter 8 mm). Following the opening of an electromagnetically sealed shutter at the bottom of the funnel, the particles fell freely from the aperture as a granular stream.
We used a digital camera (Casio EXILIM PRO EX-F1) to take images (432 × 192 pixels) of granular streams in the ISAS chamber at 600 fps in air and at a reduced am-bient pressure. An additional 6400 fps high-speed cam-era (Photron FASTCAM Mini AX) was used to acquire more detailed images (1024 × 1024 pixels) in air for the ISAS experiments. The cameras were initially held at the height of the aperture with an electromagnet. After the shutter of the funnel aperture was opened, the electro-magnet for the camera was deactivated, and the camera was allowed to slide along two perpendicular shafts to-gether with the stream. The granular stream was illumi-nated over its entire length using taped light-emitting diodes (LEDs). We used a high-speed camera (Photron FASTCAM SA1.1) fixed at vertical distances of 0 m and 0.9 m from the aperture to obtain high-resolution im-ages (1024 × 1024 pixels) in the experiments conducted at Kobe University. The camera did not move along the granular stream. The spatial resolution was 0.02 mm/ pixel, and the frame rate was 5400 fps.
Results and discussion
Adhesive force
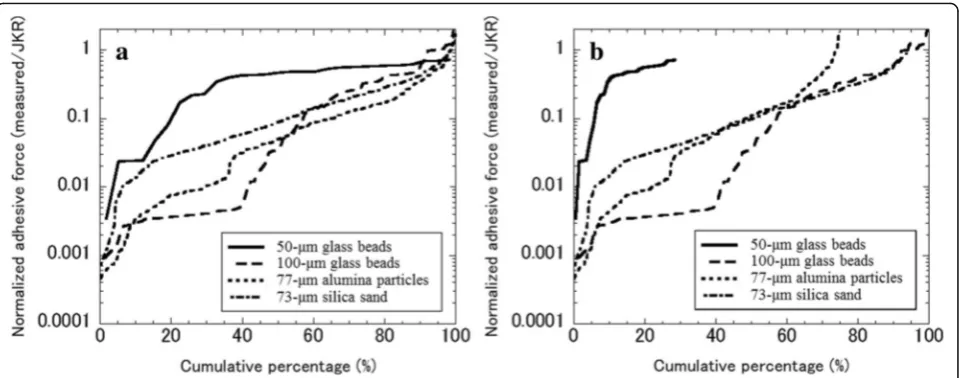
In Fig.6, the ratio of the experimentally measured value of the adhesive force to the calculated theoretical refer-ence value, described below, is shown as a function of the cumulative percentage of particles for which we de-termined the adhesive force. The range of the measured adhesive force is shown in Table2. As mentioned previ-ously, the centrifugal force generated at 5000 rpm in this study was not sufficient to separate all of the particles
from the Petri dish for the 50μm glass beads, while all of the 100 μm glass beads were separated successfully from the Petri dish before the maximum centrifugal force was achieved. The percentage of the residual 50μm glass beads on the Petri dish was 71%; hence, the curve in Fig. 6afor 50 μm glass beads shows the lower limit of the adhesive force distribution. The percentage of the residual alumina particles and silica sand grains were 26 and 5%, respectively. Most of the residual parti-cles and grains had small diameters of approximately 30μm; thus, the curves for the alumina particles and sil-ica sand in Fig.6a can be regarded as representative for alumina particles and silica sand (approximately 75 μm particles).
We refer to the theoretical value of the adhesive force
based on Johnson–Kendall–Roberts (JKR) theory
(Johnson et al.1971), although the capillary force is sig-nificant at atmospheric pressure, as discussed later. The force required to separate two spheres in contact, Fc, is given by
Fc¼3πγR; ð4Þ
whereγis the surface energy of the particle, andRis the reduced radius of two spheres with radii of R1 and R2,
respectively:
1=R¼1=R1þ1=R2: ð5Þ
In this case, the contact is between a glass plate and a particle. Thus,Ris simply equal to the radius of the par-ticle. We calculated the force for perfect spheres of ra-dius R for glass beads, alumina, and silica sand grains according to Eq. (4) as reference values. In the calcula-tion, we used the radius R for each particle determined from the 2D projected area by
S¼πR2: ð6Þ
We assumed a value of γ= 0.025 J/m2 of SiO2 parti-cles (Heim et al. 1999) for the glass beads, silica sand, and the glass plate;γ= 0.041 J/m2was used for alumina particles (Burnham et al.1990). We adopted the formula for the adhesive force,γ¼pffiffiffiffiffiffiffiffiffiffiγ1γ2, between different ma-terials with surface energies ofγ1andγ2(Burnham et al. 1990). The adhesive forces between the Petri dish and the 50μm glass beads, 100 μm glass beads, 77μm alu-mina spheres, and 73μm silica spheres were 5.9, 12, 12, and 8.6μN, respectively.
Figure6ashows that approximately 80% of the 50 μm glass beads that detached from the Petri dish had an ad-hesive force that exceeded 10% of the theoretical refer-ence value. If we take the percentage of residual glass beads on the Petri dish, the distribution of adhesive forces of the 50 μm glass beads had a higher median value than that shown in Fig.6a (shown in Fig.6b). On the other hand, more than half of the 100 μm glass
Fig. 6Measurement results of the adhesive force. The ratio of the measurement value of the adhesive force using a Petri dish to the theoretical reference value against the cumulative percentage. Solid, dashed, dotted, and dashed and dotted lines show the 50μm glass beads, 100μm glass beads, alumina particles, and silica sand, respectively.aThe percentage reflects the number of detached particles/total number of detached particles ratio.bThe percentage reflects the number of detached particles/total number of observed particles ratio
Table 2Range of measured adhesive force between each particle and a Petri dish
Particle type Diameter rangea(
μm) Adhesive forceb(
μN)
Glass bead 50μm 44–66 0.16–5.6
Glass bead 100μm 74–112 0.027–13
Alumina particle 77μm 62–92 0.0062–13
Silica sand 73μm 58–88 0.0069–8.0
a
80–120% of the median diameter (see Fig.1)
b
beads had values less than 5% of the theoretical refer-ence values of perfect spheres. From the different shapes of the curves of irregular particles compared with those of the glass beads in Fig.6, it can be said that the adhe-sive force is likely influenced by the macroscopic shape of the particle. On the other hand, the data for the 100μm glass beads were much smaller than the theoret-ical reference values compared with those for the 50μm glass beads; this is likely due to the high roughness (Ra) of the 100μm glass beads in comparison with the 50μm beads. The compression length of a sphere (delta in JKR
theory) is 0.54 nm for the 50 μm glass beads and
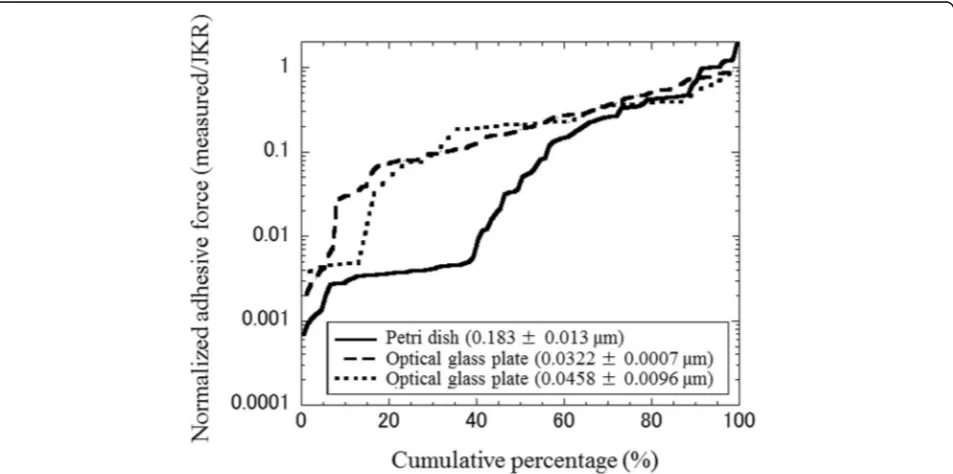
0.69 nm for the 100μm glass beads. Compared with the one order of magnitude larger surface roughness, which is approximately 1 μm for the 50 μm beads and 4 μm for the 100μm beads, it can be said that perfect contact was not achieved. Figure7 shows that the spread in the measurement values of the 100μm glass beads with the optical glass plates was smaller than the case in which the Petri dish was used, implying that the microscopic surface roughness has a significant effect on adhesive forces.
We calculated the effective surface energy of particles, γeff, which reproduces the measurement value. Table 3 summarizes the range of the γeff values of the particles corresponding to 10–90% of the total number of parti-cles; note that the percentage of the residual particles on the Petri dish is not taken into account. The measured values in this study were considerably smaller than the
reference values, based on the previous measurements of surface energy (Heim et al. 1999; Burnham et al. 1990). As mentioned above, this is probably because the contact between the particles and the Petri dish was less than perfect due to the high surface roughness. The root mean square deviation from the ideal sphere of a micron-sized SiO2 particle used in the previous study was 0.13 nm (Heim et al.1999).
Horizontal particle velocity just below the aperture
We analyzed the motion of the particles just below the aperture via particle image velocimetry (PIV), using the fixed high-speed camera images shown in Fig. 8. The analysis was only applied to particles at the outer section of the stream because the optical depth of the central part of the stream was too large for the motion of the particles to be tracked. Fig.9shows the cumulative per-centage of the horizontal particle velocities of the 50μm
and 100 μm glass beads within 20.4 mm from the
Fig. 7Effect of surface roughness. The ratios of the measurement values of the adhesive force of the 100μm glass beads obtained using a Petri dish and two optical glass plates having different surface roughnesses to the theoretical values plotted against the cumulative percentage. Solid line, dashed, and dotted lines correspond to the results of the Petri dish, smoother optical glass plate, and another optical glass plate, respectively. The numbers in parentheses show the roughness (Ra)
Table 3Range of effective surface energy
Particle type γeff
a
(J m−2) vcr
a (cm s−1)
Glass bead 50μm 0.00061–0.017 0.20–2.8
Glass bead 100μm 0.000071–0.017 0.025–2.1
Alumina particle 77μm 0.00012–0.011 0.022–0.98
Silica sand 73μm 0.00034–0.010 0.099–1.7
a
The range of theγeffandvcrvalues of the particles corresponding to 10–90%
aperture in the vertical direction, and those for the alu-mina particles and silica sand within 19.4 mm and 17.9 mm from the aperture, respectively. The four types of particles had similar horizontal velocity distributions, typically about 1 cm s−1.
According to Chokshi et al. (1993), the critical colli-sion velocity between the monomers of radiusRis
vcr≅3:86 γ
5 6
1−v2 ð Þ=ε
½ −1 3R56ρ12
; ð7Þ
whereνis the Poisson ratio,εis Young’s modulus, andρ is density. On the other hand, we assume that agglomer-ates, not monomers, collide with each other in a granu-lar stream, based on the fact that tiny agglomerates consisting of a small number of monomers are recog-nized in the images of Fig. 8. The critical collision vel-ocity for equal-size agglomerates was shown to be
vcr≅15
ffiffiffiffiffiffiffiffiffiffiffiffiffiffiffiffiffiffi Ebreak=m
p
; ð8Þ
Fig. 8Granular streams at the funnel aperture in air.a50μm glass beads,b100μm glass beads,c77μm alumina particles, andd73μm silica sand
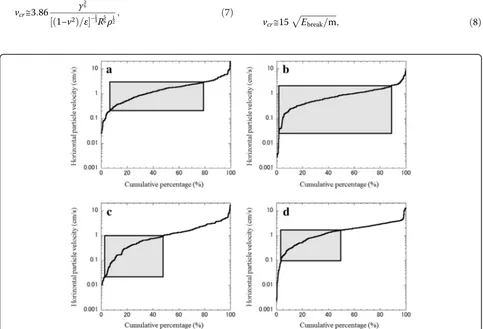
Fig. 9Horizontal particle velocity distribution just below the funnel aperture plotted against cumulative percentage fora50μm glass beads,b
Ebreak≅23 γ5R4 1−ν2
2
=ε2
h i1=3
; ð9Þ
vcr≅35 γ
5 6
1−v2 ð Þ=ε
½ −1 3R56ρ12
; ð10Þ
where Ebreak is the energy of breaking a single contact
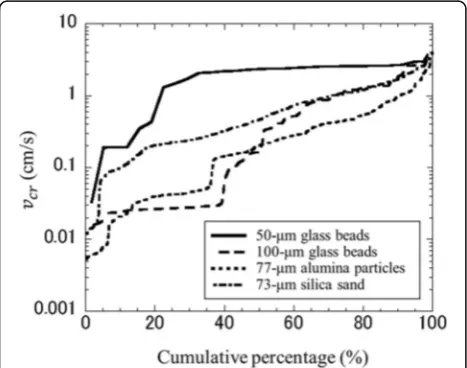
between two (identical) particles and m is the mass of the constituent monomer (Wada et al. 2018). Thus, the critical collision velocity between agglomerates is about nine times higher than the critical velocity between monomers. If we substitute the value of the effective sur-face energy, γeff, obtained in the previous section into γ in Eq. (10), we obtain the critical velocities for the virtual agglomerates consisting of identical monomers with values of Randγeff. Figure10shows the calculated crit-ical collision velocity for equal-size agglomerates versus the cumulative percentage. The critical collision velocity is a few centimeter per second. The maximum critical collision velocity between agglomerates exceeds the typ-ical horizontal velocity of the particles in the stream (ap-proximately 1 cm s−1). Although we did not measure the typical horizontal velocity of the agglomerates, it would be similar to or lower than the individual particle horizontal velocity and therefore even lower than the maximum critical collision velocity between agglomer-ates. Consequently, agglomerates in a stream may grow via agglomerate-agglomerate collisions. The range of the critical velocity for agglomerates of each type of particle, based on Fig. 10, is shown in Table 3. The range of the critical collision velocity for agglomerates is indicated by the quadrangles in Fig. 9. We adopted the values of ν
andεshown in Table1. A relatively large number of the 50 μm glass beads had horizontal particle velocities lower than the critical collision velocity, indicating favor-able conditions for agglomerate growth. On the other hand, most but not all of the 100 μm glass beads, alu-mina particles, and silica sand grains had higher hori-zontal velocities than the critical collision velocity. Agglomeration of these particles is expected to be more difficult.
Observation of granular streams
The state of granular streams at 0.9 m of vertical dis-tance from the funnel aperture at each ambient pressure is summarized in Fig. 11. Because the transparent part of the vacuum chamber at Kobe University is 1.0 m high, the maximum drop height of the particles for tak-ing images from outside of the chamber is approximately 0.9 m. In air, all particles except for the 100 μm glass beads formed millimeter-size agglomerates at 0.9 m. Al-though the 100 μm glass beads did not form agglomer-ates at 0.9 m from the funnel aperture, agglomeration was initiated at approximately 1.2 m from the aperture. Based on Fig.9a, b, the 50 μm glass beads can form ag-glomerates more easily than the 100 μm glass beads. The observational results of the granular streams were in accordance with predictions based on the critical col-lisional velocity. Contrary to the prediction from the critical collision velocity, although the prediction was for spherical particles, alumina particles and silica sand grains were able to form agglomerates in air. A previous study showed that irregularly shaped particles have a higher probability of sticking and a higher capture vel-ocity than spherical particles (Poppe et al. 2000). The reason was thought to be due to multiple opportunities of hitting and the resultant energy dissipation allowed by the irregular shape. Royer et al. (2009) also conducted laboratory experiments with irregularly shaped particles and found less agglomeration of irregular particles, a tendency opposite to that observed in the current study. The irregularly shaped particles used in Royer et al. (2009) were quite rounded, that is, not angular, while those used in this study were elongated and angular. This difference in irregularity would result in the differ-ent degrees of agglomeration. In fact, the irregularity of diamond particles of 1.3–1.9 μm in diameter (average diameter 1.5 μm) used by Poppe et al. (2000) exhibiting higher sticking velocity than the spherical particles is similar to those used in our study, although the collision velocity in the current study was lower than that of Poppe et al. (2000) and the energy dissipation mechan-ism may have been different. Further study is required to reveal the formation process of the agglomerates in a granular stream.
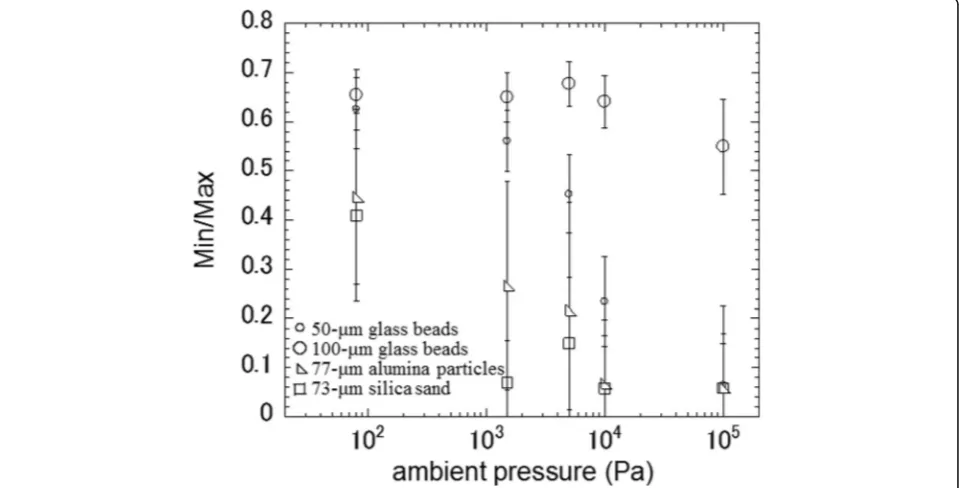
Figure12shows the ratio of the local minimum to the local maximum widths of granular streams, determined using ImageJ software versus the ambient pressure. When agglomerates form perfectly, the ratio becomes zero. As shown in Fig.11, the formation of agglomerates
becomes more difficult as the ambient pressure de-creases. This is likely due to a decrease in the adhesive force, i.e., capillary forces, at lower pressures. Because the capillary force relates to the surface energy of water, which is 0.072 J/m2(Butt and Kappl2009), it contributes
Fig. 11State of granular streams at 0.9 m from the funnel aperture at each level of ambient pressure
significantly to adhesive forces in air. However, there was no influence of the atmosphere in the previous study (Royer et al. 2009). The reason why the ambient gas pressure dependence in our study is different from that in the previous one remains unclear; however, it may be due to differences in the experimental condi-tions, such as the funnel aperture and humidity.
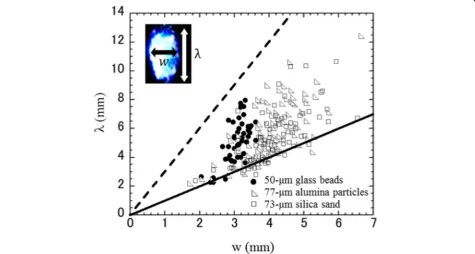
Figure 13 shows the length (λ) and width (w) of ag-glomerates at 0.90 ± 0.01 m from the aperture in air. We used ImageJ software for the measurement. The length to width ratio was between approximately 1 and 2.5, which roughly agrees with the ratio (between 1 and 3) shown in the previous study (Royer et al.2009); however, the absolute size of the agglomerates formed was larger. This does, however, agree with the correlation observed in the previous study (Royer et al.2009): specifically, that a larger aperture leads to a larger agglomerate size. Ag-glomerates of irregular particles had a larger overall size than agglomerates of spherical particles.
Application to planetary surfaces
Crater rays have bright albedo features that extend from fresh craters, forming radially oriented filaments and dif-fuse patches (Melosh 1989). Rays have been observed on airless bodies, i.e., the Moon, Mercury (Allen 1977), and icy satellites (Wagner et al. 2011). Various processes, in-cluding deposition of ejecta from primary craters, have been proposed as the production mechanism of rays (Allen1977). Kadono et al. (2015) showed experimentally
and numerically that clear mesh patterns form in impact-generated ejecta during flight. They also demon-strated in the laboratory that the characteristic angle of spaces between radial patterns was a few degrees, which is similar to that of the rays around two craters on the Moon. If crater rays are formed via ejecta from primary craters, the morphology of the rays can be discussed in terms of the agglomerating process of ejecta particles. The pattern of rays may be compared directly with the undula-tion of the granular streams shown in Fig.11, although a dedicated study of the formation of discrete patterns in the ejecta curtain is required.
A study of agglomeration in a granular stream would also provide new insights into the origin of grooves on Phobos. The grooves, or striations, are often parallel de-pressions, and many have a pitted appearance (Veverka and Duxbury 1977). Hypotheses regarding their origin include secondary impacts from the Stickney Crater, sec-ondary impacts from primary impact events on Mars, impact crater chains from debris in Mars’s orbit, tracks formed by boulders from the Stickney Crater, and frac-tures caused by impacts or tidal forces into which rego-lith has drained (Murchie et al. 2015). According to the hypothesis of secondary impacts from primary impact events on Mars, an ejecta melt jet derived from a large impact on Mars breaks up into droplets and causes a chain of impact craters on the surface of Phobos (Mur-ray and Heggie2014). Even if melt droplets do not form, the ejecta particles may gather together, as seen in the
perimental impact fragments. Such information on the shape of ejecta particles may be obtained from ejecta curtains and crater rays originating from natural colli-sions or artificial collicolli-sions like the SCI experiment of Hayabusa2 (Arakawa et al. 2017; Ogawa et al.2017) by applying the results of our study. The grain size of the surface of asteroid Ryugu, the target of Hayabusa2, is es-timated to be 3–30 mm (Wada et al, 2018); however, there may be particles of smaller size, and even a depth-dependence of size and shape of regolith particles due to, for example, vibrational size sorting (Miyamoto et al.2007) or thermal fatigue (Delbo et al.2014) and al-teration, caused by either solar radiation heating (Michel and Delbo 2010) or space weathering (Le Corre et al. 2018). The macroscopic pattern of ejecta from the sur-face to subsursur-face may show a microscopic property of the constituent particles.
Finally, apart from its significance for planetary sur-faces, understanding the agglomeration phenomenon in the granular stream may be useful for understand-ing particle shape effects of the agglomeration process of solid particles in protoplanetary disks and debris disks.
Conclusions
We conducted laboratory experiments of granular streams using poly-dispersed glass beads with median
di-ameters of 55 μm (50 μm glass beads) and 93 μm
(100 μm glass beads), alumina particles, and silica sand grains to investigate the formation conditions of agglom-erates in granular streams. The glass beads were spher-ical, whereas the alumina particles and silica sand grains had irregular, non-spherical shapes. We measured the adhesion of the particles using a centrifugal separation method. The 50 μm glass beads had a relatively smaller range of adhesion, which was closer to theoretical expec-tations than the other particles. The other particles showed discrepancies of orders of magnitude from the theoretical values of perfect spheres, as well as a large spread in the values, which was likely due to the micro-scopic roughness of the particle surfaces, in addition to the macroscopic irregularity in their shape. Based on the
energy dissipation occurs during the collisions among ir-regularly shaped particles. The sizes of the agglomerates were larger than in the previous study (Royer et al. 2009), likely due to the larger aperture of the funnel used in this study. The length and width ratios of the ag-glomerates were approximately between 1 and 2.5, which roughly agrees with the previous study (Royer et al.2009), although it is notable that the agglomerates of irregular particles had a larger size than those of spher-ical particles.
The granular stream allows constituents to collide at velocities low enough for clusters or agglomerates to grow and therefore can be used to study the agglomer-ation of solid particles. Our study showed that both the adhesive force of particles and the particle shape greatly influence agglomerate formation. Therefore, information on the shape or adhesive force of ejecta particles may be obtained from ejecta curtains and crater rays originating from natural collisions or artificial collisions, like that of the SCI experiment of Hayabusa2. Further study of the agglomeration of solid particles in a granular stream would allow new insights into cratering ejecta patterns, rays on planetary bodies, and grooves on Phobos. La-boratory granular stream experiments may also be useful for examining the effects of the particle shape on other agglomeration processes, such as those in protoplanetary disks and debris disks.
Abbreviations
ISAS:Institute of Space and Astronautical Science; JAXA: Japan Aerospace eXploration Agency; PIV: Particle image velocimetry; SEM: Scanning electron microscope
Acknowledgements
We would like to thank K. Ogawa and A. Suzuki for their support with the laboratory experiments. We are also grateful to the Hypervelocity Impact Facility (former facility name, The Space Plasma Laboratory), ISAS, and JAXA for their support.
Funding
This research was supported by the Hosokawa Powder Technology Foundation and grants-in-aid for scientific research from the Japanese Society for the Promotion of Science (nos. 25400453 and 18K03723) of the Japanese Ministry of Education, Culture, Sports, Science, and Technology (MEXT).
Availability of data and materials
Authors’contributions
YN conducted the measurements and experiments, analyzed the data, and constructed the manuscript. TO prepared the regolith analogues and helped measure the cohesive force of the particles. MK helped with the granular stream experiments. AMN proposed the topic, conceived the study, and helped in the interpretation of the results. KW provided the theoretical background of the study. SH supported the granular stream experiments conducted in the vacuum chamber in ISAS. All authors read and approved the final manuscript.
Competing interests
The authors declare that they have no competing interests.
Publisher’s Note
Springer Nature remains neutral with regard to jurisdictional claims in published maps and institutional affiliations.
Author details
1Graduate School of Science, Kobe University, 1-1 Rokkodaicho, Nada-ku, Kobe 657-8501, Japan.2Planetary Exploration Research Center, Chiba Institute of Technology, 2-17-1 Tsudanuma, Narashino, Chiba 275-0016, Japan. 3Institute of Space and Astronautical Science, Japan Aerospace Exploration Agency, 3-1-1 Yoshinodai, Chuo-ku, Sagamihara, Kanagawa 252-5210, Japan.
Received: 30 November 2017 Accepted: 17 August 2018
References
Allen CC (1977) Rayed craters on the Moon and Mercury. Phys Earth Planet Inter 15:179–188.https://doi.org/10.1016/0031-9201(77)90030-9
Arakawa M, Wada K, Saiki T, Kadono T, Takagi Y, Shirai K, Okamoto C, Yano H, Hayakawa M, Nakazawa S, Hirata N, Kobayashi M, Michel P, Jutzi M, Imamura H, Ogawa K, Sakatani N, Iijima Y, Honda R, Ishibashi K, Hayakawa H, Sawada H (2017) Scientific objectives of small carry-on impactor (SCI) and deployable camera 3 digital (DCAM3-D): observation of an ejecta curtain and a crater formed on the surface of Ryugu by an artificial high-velocity impact. Space Sci Rev 208:187–212.https://doi.org/10.1007/s11214-016-0290-z
Burnham NA, Dominguez DD, Mowery RL, Colton RJ (1990) Probing the surface forces of monolayer films with an atomic-force microscope. Phys Rev Lett 64: 1931–1934.https://doi.org/10.1103/PhysRevLett.64.1931
Butt H-J, Kappl M (2009) Normal capillary forces. Adv Colloid Interf Sci 146:48–60.
https://doi.org/10.1016/j.cis.2008.10.002
Chokshi A, Tielens AGGM, Hollenbach D (1993) Dust coagulation. Astrophys J 407:806–819.https://doi.org/10.1086/172562
Delbo M, Libourel G, Wilkerson J, Murdoch N, Michel P, Ramesh KT, Ganino C, Verati C, Marchi S (2014) Thermal fatigue as the origin of regolith on small asteroids. Nature 508:233–236.https://doi.org/10.1038/nature13153
Fujiwara A (1978) Expected shape distribution of asteroids obtained from laboratory impact experiments. Nature 272:602–603.https://doi.org/10.1038/ 272602a0
Gadelmawla ES, Koura MM, Maksoud TMA, Elewa IM, Soliman HH (2002) Roughness parameters. J Mater Process Technol 123:133–145.https://doi.org/ 10.1016/S0924-0136(02)00060-2
Heim L-O, Blum J, Preuss M, Butt H-J (1999) Adhesion and friction forces between spherical micrometer-sized particles. Phys Rev Lett 83:3328–3331.
https://doi.org/10.1103/PhysRevLett.83.3328
Higa M, Arakawa M, Maeno N (1996) Measurements of restitution coefficients of ice at low temperatures. Planet Space Sci 44:917–925.https://doi.org/10. 1016/0032-0633(95)00133-6
Johnson KL, Kendall K, Roberts AD (1971) Surface energy and the contact of elastic solids. Proc R Soc Lond A 324:301–313.https://doi.org/10.1098/rspa. 1971.0141
Kadono T, Suzuki AI, Wada K, Mitani NK, Yamamoto S, Arakawa M, Sugita S, Haruyama J, Nakamura AM (2015) Crater-ray formation by impact-induced ejecta particles. Icarus 250:215–221.https://doi.org/10.1016/j. icarus.2014.11.030
Krupp H (1967) Particle adhesion theory and experiment. Adv Colloid Interf Sci 1: 111–239.https://doi.org/10.1016/0001-8686(67)80004-6
Le Corre L, Sanchez JA, Reddy V, Takir D, Cloutis EA, Thirouin A, Becker KJ, Li J, Sugita S, Tatsumi E (2018) Ground-based characterization of Hayabusa2 mission target asteroid 162173 Ryugu: constraining mineralogical
composition in preparation for spacecraft operations. Mon Not R Astron Soc 475:614–623.https://doi.org/10.1093/mnras/stx3236
Melosh HJ (1989) Impact cratering: a geologic process. Oxford Univ. Press, New York Michel P, Delbo M (2010) Orbital and thermal evolutions of four potential targets for a sample return space mission to a primitive near-earth asteroid. Icarus 209:520–534.https://doi.org/10.1016/j.icarus.2010.05.013
Miyamoto H, Yano H, Scheeres DJ, Abe S, Barnouin-Jha O, Cheng AF, Demura H, Gaskell RW, Hirata N, Ishiguro M, Michikami T, Nakamura AM, Nakamura R, Saito J, Sasaki S (2007) Regolith migration and sorting on asteroid Itokawa. Science 316:1011–1014.https://doi.org/10.1126/science.1134390
Murchie SL, Thomas PC, Rivkin AS, Chabot NL (2015) Phobos and Deimos. In: Michel P, DeMeo FE, Bottke WF (eds) Asteroids IV. University of Arizona Press, Tucson, pp 451–467
Murray JB, Heggie DC (2014) Character and origin of Phobos’grooves. Planet Space Sci 102:119–143.https://doi.org/10.1016/j.pss.2014.03.001
Ogawa K, Shirai K, Sawada H, Arakawa M, Honda R, Wada K, Ishibashi K, Iijima Y, Sakatani N, Nakazawa S, Hayakawa H (2017) System configuration and operation plan of Hayabusa2 DCAM3-D camera system for scientific observation during SCI impact experiment. Space Sci Rev 208:125–142.
https://doi.org/10.1007/s11214-017-0347-7
Omura T, Kiuchi M, Guettler C, Nakamura AM (2016) Centrifugal experiments with simulated regolith: effects of gravity, size distribution, and particle shape on porosity. Trans JSASS Aerosp Tech Jpn 14(ists30):PK_17–Pk_21.https://doi. org/10.2322/tastj.14.Pk_17
Omura T, Nakamura A (2017) Experimental study on compression property of regolith analogues. Planet Space Sci 149:14–22.https://doi.org/10.1016/j.pss. 2017.08.003
Poppe T, Blum J, Henning T (2000) Analogous experiments on the stickiness of Micron-sized Preplanetary dust. Astrophys J 533:454–471.https://doi.org/10. 1086/308626
Royer JR, Evans DJ, Oyarte L, Guo Q, Kapit E, Möbius ME, Waitukaitis SR, Jaeger HM (2009) High-speed tracking of rupture and clustering in freely falling granular streams. Nature 459:1110–1113.https://doi.org/10.1038/nature08115
Spinner S (1962) Temperature dependence of elastic constants of vitreous silica. J Am Ceram Soc 45:394–397.https://doi.org/10.1111/j.1151-2916.1962.tb11177.x
Tsuchiyama A, Uesugi M, Matsushima T, Michikami T, Kadono T, Nakamura T, Uesugi K, Nakano T, Sandford SA, Noguchi R, Matsumoto T, Matsuno J, Nagano T, Imai Y, Takeuchi A, Suzuki Y, Ogami T, Katagiri J, Ebihara M, Ireland TR, Kitajima F, Nagao K, Naraoka H, Noguchi T, Okazaki R, Yurimoto H, Zolensky ME, Mukai T, Abe M, Yada T, Fujimura A, Yoshikawa M, Kawaguchi J (2011) Three-dimensional structure of Hayabusa samples: origin and evolution of Itokawa regolith. Science 333:1125–1128.https://doi.org/10. 1126/science.1207807
Veverka J, Duxbury TC (1977) Viking observations of Phobos and Deimos: preliminary results. J Geophys Res 82:4213–4223.https://doi.org/10.1029/ JS082i028p04213
Wada K, Grott M, Michel P, Walsh K J, Barucci A M, Biele J, Blum J, Ernst C M, Grundmann J T, Gundlach B, Hagermann A, Hamm M, Jutzi M, Kim M, Kührt E, Le Corre L, Libourel G, Lichtenheldt R, Maturilli A, Messenger S R, Michikami T, Miyamoto H, Mottola S, Nakamura A M, Müller T, Nittler L R, Ogawa K, Okada T, Palomba E, Sakatani N, Schröder S, Senshu H, Takir D, Zolensky M E, International Regolith Science Group (IRSG) in Hayabusa2 project (2018) Asteroid Ryugu Before the Hayabusa2 Encounter. arXiv:1804. 03734.https://arxiv.org/abs/1804.03734. Accessed 10 June 2018 Wagner R J, Stephan K, Neukum G, Schmedemann N, Hartmann O, Roatsch T,
Wolf U (2011) Ray craters on the satellites of Jupiter and Saturn. Abstract 1335 presented at the EPSC-DPS Joint Meeting 2011, Nantes, France, October 2-7, 2011.https://meetingorganizer.copernicus.org/EPSC-DPS2011/ EPSC-DPS2011-1335.pdf. Accessed 10 June 2018.
Waitukaitis SR, Grütjen HF, Royer JR, Jaeger HM (2011) Droplet and cluster formation in freely falling granular streams. Phys Rev E 83.https://doi.org/10. 1103/PhysRevE.83.051302