O R I G I N A L A R T I C L E
Open Access
Does aid induce brain drain? A panel
data analysis
Darwin Ugarte Ontiveros
1*and Vincenzo Verardi
2* Correspondence:dugarteo@ fundp.ac.be
1University of Namur (CRED), Namur, Belgium
Full list of author information is available at the end of the article
Abstract:Recent evidence suggests that aid induces migration. This result is nevertheless not very informative from a policy perspective since what counts in terms of welfare consequences is the composition of migration. In this paper we focus on education and study which of skilled or unskilled migration is more sensitive to aid. More specifically we investigate the possible channels through which aid might affect self-selection among international emigrants and find that aid induces positive selection by easing the movement of highly qualified workers. Interestingly, we find that technical cooperation and bilateral aid have a significant influence on skilled migration but do not seem to affect unskilled migration significantly. On the other hand, aid targeted to development enhancement affects both categories but seems to have a larger effect on the former.
JEL codes:F35, F22, C23
Keywords:Foreign aid, International migration, Self-selection, Brain drain
1 Introduction
The international mobility of workers is perceived by several authors as a key issue in economic development. South to north migration has increased substantially over time and reached very high levels. To give a broad idea of the situation, estimates from the Organization for Economic Co-operation and Development (OECD, 2008), reveal that more than one half of OECD countries have a stock of immigrants that exceeds 10% of their total population. Many of these immigrants come from developing countries (LDCs). As stated by Docquier et al. (2007), in 2000 developing countries accounted for 64.5% of total immigrants and 61.6% of skilled immigrants in the OECD (15% points higher than in 1990).
The selection of international emigrants by education level is a central issue for both research and policy analysis since its extents explains the migration’s positive and nega-tive consequences for both sending and receiving countries. To caricature, we could summarize the debate by asserting that migration hosting countries are interested in managing low-skilled (and illegal) immigration while migration sending countries are interested in retaining human capital by reducing the outflow of the highly skilled. The desire of reducing low-skilled migration in OECD countries rests on the fact that low skilled immigration lowers the low-skilled wage in hosting countries (Borjas, 2003), and reduces the working possibilities for lowly qualified native workers (Borjas, 2006). Furthermore, it increases the net tax burden on the natives (Lee and Miller, 2000). From the perspective of LDCs, they are concerned by the emigration of the highly
© 2012 Ugarte Ontiveros and Verardi; licensee Springer. This is an Open Access article distributed under the terms of the Creative Commons Attribution License (http://creativecommons.org/licenses/by/2.0), which permits unrestricted use, distribution, and reproduction in any medium, provided the original work is properly cited.
skilled. Even if the debate is ongoing (brain gain), see Beine et al. (2011), most authors view brain drain as a threat mainly because it reduces human capital formation and consequently long-term growth (Bhagwati and Hamada, 1974, and Wong and Yip, 1999). Beine et al. (2008) estimated that countries that are small, relatively poor and have high emigration rates suffer substantial net losses of human capital.
In order to deal with these disequilibria, it has been suggested that, to reduce both skilled and unskilled migration, it could be necessary for OECD countries to target some of their development aid specifically to migration (see for example Böhning and Schloeter-Paredes, 1994, IOM and UNCTAD, 1996, Stalker, 2002, Lowell and Findlay, 2006, UNCTAD, 2007, and OECD, 2008). The underlying idea being that aid would act against the alleged root causes of migration.
Rotte and Vogler (2000) and recently Berthélemy et al. (2009), contradict this vision showing that aid and migration are complements rather than substitutes. However, from a policy perspective, a more detailed analysis of emigration selection is needed to understand the welfare consequences of migration for both sending and receiving countries.
In this paper we assess the effectiveness of foreign aid to reach its migration objec-tives, and investigate the impact of aid on the schooling gap between emigrants and non emigrants (migration selection), and on the skill composition of emigrants (i.e. skilled, and unskilled migration). Using a recent panel database on international migra-tion constructed by Defoort and Rogers (2008) and linking it to the internamigra-tional aid database (available from the OECD) we find evidence that, on average, aid is associated with the migration of the more educated. Our finding is that 1% of GDP increase in aid induces a 7% increase in skilled migration, and an increase in the selection rate of around 3% (i.e. the ratio high to low skilled among emigrants and non emigrants). The effect on the unskilled migration rate is small (2.5% in case of a 1% of GDP increase in aid). These results are robust to different identification strategies and specifications.
We also test some specific mechanisms to improve our understanding of the influ-ence of aid on the selection path of emigrants. Relying on the seminal papers of Roy (1951) and Borjas (1987), several authors have studied the determinants of the compos-ition of international migration focusing in particular on the education level of migrants. Chiquiar and Hanson (2005), Fernández-Huertas (2008), (forthcoming) and Grogger and Hanson (2010), for example, find that the major determinants of self se-lection among emigrants (by skill levels) is the distribution of income in host and home country, and the pecuniary and non-pecuniary moving costs. In this framework, it is likely that international cooperation may influence self-selection of emigrants, by help-ing reducing transaction costs (e.g. by providing opportunities for the highly skilled to migrate thanks to the attribution of scholarship grants), or even informational costs (e.g. by providing information on the donor countries to both skilled and unskilled natives). The clear identification of the latter is however difficult as project aid might induce screening of high level professionals (e.g. by creating opportunities for highly qualified native professionals in LDCs). Moreover, aid could help softening the budget constraint of potential migrants by increasing incomes in LDCs. We test for these specific mechanisms in section 5.
migrants are more sensitive to bilateral aid (attraction effect), while unskilled migrants are more influenced by the effect of total aid on the budget constraint softening. Our finding is however slightly different. Indeed, we find that skilled migrants are highly re-active to both the attraction effect of aid and its budget constraint softening properties. The outcome is particularly important when aid is bilateral or when it is technical co-operation. On the other hand, we only find weak evidence that unskilled migrants react to aid through the budget constraint mechanism. We hope that by using panel data (and dealing with unobserved heterogeneity) we will bring new evidence on the mechanisms of the influence of aid on migration and complement the findings of Berthélemy et al. (2009).
The remainder of the paper is organized as follows: in section 2 we provide a descrip-tion of the data as well as some stylized facts. Secdescrip-tion 3 presents the empirical method-ology designed. Section 4 displays the results. Some mechanisms are sketched out and tested in section 5, whereas in section 6 we conclude.
2 Data and stylized facts
To measure migration we rely on Docquier and Marfouk (2006), and define the migra-tion rate for countryi, as the ratio of the total number of working age individuals (older than 25) with education level k, who were born in country i but live abroad: (Mik,t), divided by the total number of individuals (older than 25) of country iwith education levelk: (Mik,t+Nik,t), where Nstands for the total number of nationals remaining in the home country. We consider that k is high (h) for tertiary education attainment, and low (l) for less than tertiary level attainment. Note that in this definition, migration is considered as percentage of the total labor force born in sending countries. This ratio mik,t=Mik,t/(Mik,t+Nik,t) has been estimated by Docquier and Marfouk (2006) for a large panel of countries for the years 1990 and 2000 for different education levels. In order to overcome the limitations of cross section analysis, Defoort and Rogers (2008) has extended this dataset to a broader period ranging from 1975 to 2000 for a set of 195 countries (with 5 years intervals). However, given the complications associated with identifying foreigners in receiving countries (information on the origin and skill of immigrants comes from national population censuses), they calculate migration rates considering only the six major receivers (Australia, Canada, France, Germany, the United Kingdom and the United States). These countries account for approximately 77% of the OECD skilled migration stock in 2000; see Defoort and Rogers (2008), Docquier and Marfouk (2006) and Beine et al. (2011) for major details about the char-acteristics of the data. Interestingly, these countries are also among the major aid donors, and account for approximately 60% of the total aid from the Development Assistance Committee (DAC) countries.
Thus, the skilled migration rate (mih,t), from Defoort and Rogers (2008), is our first variable of interest. Moreover, we calculate the unskilled migration rate (mil,t), which is the ratio of the proportion of migrants (Mil,t) from countryiat timetwith training level l over the total number of nationals with low level education (Mil,t+Nil,t). Following Docquier et al. (2007), a rise in the migration rate by education level kcould be due to a rise in the level of migration among all education level or to a specific rise in the ratio of the proportion of k level educated emigrants by the same proportion among
non-Ugarte Ontiveros and VerardiIZA Journal of Migration2012,1:13 Page 3 of 19
emigrants (represented by the selection rate). Thus to consider these global migration effects we also consider as dependent variable the total migration rate (mik,t, for all k education level), also available from Defoort and Rogers (2008).1In this way, the size of migration flows by education level is measured by the skilled migration rate, unskilled migration rate, and total migration rate.
Another measure we use is the selection rate. This variable can be seen as a measure of the difference in the skill ratio between emigrants and non migrants. It is defined by si,t= ln[(Mih,t/Mil,t)/(Nih,t/Nil,t)]; where si,t is the selection rate of sending country i to the six major receivers, at time t. The numerator (Mih,t/Mil,t) represents the skill ratio for emigrants, i.e. the share of skilled and unskilled emigrants in re-ceiving countries. The denominator (Nih,t/Nil,t) represents the skill ratio for non migrants, i.e. the share of skilled and unskilled non migrants. Positive values of the selection rate means that emigrants are more educated than their non-migrant counterparts.
As far as foreign aid is concerned, we consider the Official Development Assist-ance (ODA) from the OECD. ODA is defined as the flow of grants and loans from donors and multilateral institutions, provided by official or executive agencies, to countries of the DAC list. As it is commonly done in the literature, we quantify the ODA by considering the net disbursements as a percentage of the Gross Do-mestic Product. Our key variable of interest is bilateral ODA from the six donors for which migration rates are available, which is defined as the flows given directly by the government of one country to another. In section 5 we also consider other categories of aid
Note that, since we are working with aggregate bilateral aid from the six major receivers of migrants, we are assuming the presence of externalities of aid in the process of emigration. This is more realistic since there is no reason to expect aid coming from a donor influencing migration exclusively to that donor coun-try. In fact, additional regressions using aid from each donor country as explana-tory variable show that aid from United States, Australia, Germany and Canada, increase the skilled migration rate corresponding to the six countries of our sample (mih,t).
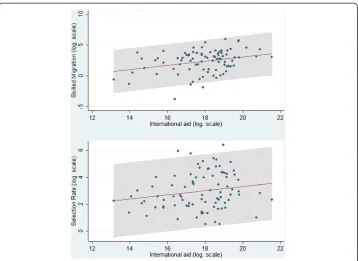
Before moving to the econometric analysis, it is interesting to look at the link between international aid and migration using some raw data. For this purpose, we plot, in Figure 1, the averaged over time skilled and selection rate (towards the 6 major migrant receivers) of all LDCs against the international aid they re-ceive (from the same 6 major countries). The scale of both axes is logarithmic and 95% confidence intervals are shaded. The upper panel of Figure 1 presents the relation between aid and skilled migration. It turns out to be, as we expected, upward sloping. The lower panel of Figure 1 presents the selection rate. Here again the slope of the regression line is, as anticipated, positive. From this very preliminary analysis, it seems hence that aid and the migration of workers belonging to the upper tail of the education distribution are positively linked. We therefore expect that the more international aid, the more educated are more likely to emigrate.
3 Empirical analysis 3.1 General specification
In our empirical analysis we adopt the empirical specification of Docquier et al. (2007) about the determinants of the brain drain. Then, we test for the link between inter-national aid and our variables of interest by estimating parameterγin the relation
Yit¼γAiditþXitβþδiþτtþεit with i¼1. . .n and t¼1. . .T ð1Þ Subscript iandtdenote country and year respectively,Yitare the migration variables of interest (i.e. skilled migration mih,t, unskilled migration mli,t, total migration mik,t, and selection rate si,t), Aidit is the ratio of international aid on Gross Domestic Product (GDP), Xit is a matrix of control variables and δi and τt are the individual and time fixed effects respectively. The variables included onXitare: i) the lag of countryi’s total number of nationals living in the hosting countries, in order to control for a potential network or diaspora effect, note that by controlling for fixed effects, this variable turns out to be a good proxy for the change in migration policies of donor countries with re-spect to countryisince it conveys information on the gap between the total number of migrants of country i(in yeart) with respect to the time invariant number of migrants from country i; ii) total population in the country of origin to capture the country i’s size and potential migration; iii) the relative level of development and its squared value (proxied by the Real GDP per capita) to capture a potential “inverted-U” relationship between development and migration; iv) the percentage of individuals (over 25) with tertiary level education living in countryito control for the level of education in send-ing countries and (v) the Freedom House index as an aggregate indicator of social sta-bility that measure the degree of freedom, political rights and civil liberties.2 The
Figure 1International Aid and Migration.
Ugarte Ontiveros and VerardiIZA Journal of Migration2012,1:13 Page 5 of 19
description and the source of these variables are presented in Additional file 1: Table S1A in appendix.
Empirical studies on migration generally try to identify the causes of resettlements by calling on gravity models to separate pull effects (i.e. migration outcomes associated with the characteristics of the receiving countries) from push effects (i.e. migration outcomes associated with the characteristics of sending countries). Here, our objective is to test whether international aid, coming from a given set of OECD countries (which is the same for all aid receivers), modifies the skill composition of emigrants (towards them). There-fore any“gap measures" such as the difference in the income level (in the migration equa-tions), and in the distribution of income between sending and hosting countries (in the selection equation), are controlled by the time dummies. Any policy change from the donors towards international aid and migration in general (independently of countries), and fixed determinants of migration like transportation costs (geographic distance or land border), and cultural ties (past colonies and common language) are controlled by the country and time fixed effect. The within estimator permit us also to control for illegal migrants by assuming that the proportion of legal migrants is a normally distributed frac-tion of the total number of migrants. So, deviafrac-tions with respect to the mean (which is absorbed by the fixed effects) will feed in the error term.
However simple two-way (country and time) fixed effects estimation is probably not well suited here since the estimated parameter associated to aid might suffer from an endogeneity bias. This bias is likely to exist since aid is considered, as stated in the intro-duction, as a policy tool to reduce migration. The causality could hence be reversed. Several case studies give evidence showing that this bias is likely to be important. Lacomba and Boni (2008), for example, show how Spain uses ODA to curb Morocco’s im-migration. Similarly Dayton-Johnson and Katseli (2006), show how the UK channels aid to Malawi with the purpose of reducing inflows of skilled migrants to Britain. Given this endogeneity bias we need to call on instrumental variables estimation (IV).
It could also be argued that by controlling for the level of education and income in period t, we could be biasing the results in favor of a positive effect of aid on migration by removing an eventual indirect channel through which aid could influence migration. To cope with this, we considered all control variables one (and five) year lagged; we also considered aid in t−1 to grasp an eventual lag in the effect and the generality of the results remain unaffected. Nevertheless, in section 3.3 we consider a more complete dynamic model to deal for a series of possible leads and lags. It is also worth to men-tion that there might be particular cases in which some countries send a small propor-tion of their migrants to the six major destinapropor-tions of our sample. Therefore, we follow Beine et al. (2011) and construct for each origin country, a reliability rate equal to the 2000 share of the six host countries in the skilled emigration stock in the OECD, and we use this reliability rate to reweight our regressions. Here, again the generality of the results does not change.
3.2 Coping with endogeneity
not independent of the error term. Furthermore, most of these are constant over time and are consequently not appropriate in a fixed effect framework. Neverthe-less, we have identified a set of variables that could be helpful in this context.
The instruments we consider are related to “good policy". The idea that aid is more effective if a country has better economic policies, as suggested by Burnside and Dollar (2000), has influenced the assignment requirements in donor countries and has been considered as a criterion in aid allocation policies. Evidence in favor of good policy and performance requirements in aid assignment is presented by Berthélemy and Tichit (2004) and Birdsall et al. (2003).
Thus, the first instrument we consider is the ratio of the external debt over GDP. This variable proxies the quality of macroeconomic policies implemented. The second we use is inflation. This variable proxies both good monetary policy and good eco-nomic performance. We believe both instruments to be exogenous since, though in-creasing the future burden of debt and the annual percentage change in the consumer price index, they do not induce any contemporaneous migration. They should further-more not be weak since donors are reluctant to provide aid to countries with poor macroeconomic policies.
To test for the quality of our instruments, we use standard tests for underidentifica-tion, weak instruments and overidentification (all the test considered are robust to het-eroskedasticity). Moreover, an additional objection that could be raised is that migration persistence might influence the results and that some of the explanatory vari-ables might not be strictly exogenous as they could be related to lags of the dependent variable. We therefore also consider a dynamic panel data model using the system GMM methodology developed by Blundell and Bond (1998).3
3.3 Coping with persistence
In the previous subsection we only considered the possible endogeneity of aid. How-ever, it could be argued that other biases could arise due to the correlation of other ex-planatory variables with the contemporaneous or the lagged error. An omitted variable bias could hence arise from failing to control for the persistence of migration. There are many channels through which past migration might impact current migration incentives. For example, following Munshi (2003), past migration may induce additional migration by increasing the probability of getting a job upon arrival at the destination country thanks to diasporas. Past migration flows can also influence migration rates through family-reunification policies. Similarly, as explained by Goldin (1994), the vot-ing power of naturalized immigrants might affect immigration-policy outcomes of re-ceiving countries and consequently determine the structure of migration. Thus, neglecting persistence might bias the results in migration’s specifications.
Taking into account dynamics in the modelling also allows to control for changes in some of the explanatory variables that might otherwise be difficult to measure (such as screening policy changes with respect to each country, income differentials and un-employment rates). Dynamic models have the additional advantage of coping with a po-tential lack of strict exogeneity of some of the control variables that might be correlated with past errors (i.e. predetermined) or correlated with current errors (i.e. endogenous). And permit us also to cope the endogeneity in aid calling on alternative
Ugarte Ontiveros and VerardiIZA Journal of Migration2012,1:13 Page 7 of 19
set of instruments. To control for persistence, we consider a dynamic panel model of the type4:
mit¼ρmit1þγAiditþXitβþδiþτtþεit with i¼1. . .n and t¼1. . .T ð2Þ As usual in dynamic panel data, this equation cannot be estimated by calling on a within estimator since the demeaned lagged migration rate ðmit1miÞ is not inde-pendent of the demeaned error term ðεit1εiÞ, wheremi andεi are the time average of respectively the migration rate and the error term. To address this issue, we use the “system GMM”estimator proposed by Blundell and Bond (1998).
Originally, to deal with dynamic panel fixed effects, Arellano and Bond (1991) pro-posed a “difference GMM" estimator that consists in taking the first difference of all variables and regressing differences on differences to remove the country fixed effects. To cope with endogeneity, they suggest to instrument all differenced variables that are not strictly exogenous with all their available lags in levels. One problem with this esti-mator is that if the variables are close to a random walk, lagged levels are weak instru-ments for first differences. Arellano and Bover (1995) and Blundell and Bond (1998) hence suggest extending this estimator to a “system GMM” by adding a series of or-thogonality conditions to the“difference GMM” estimator. More precisely, variables in levels are instrumented with suitable lags of their own first differences. The idea is that instead of taking the difference of the regressors to remove the fixed effects and then instrumenting the transformed variable, it is possible to transform (difference) the instruments (to make them exogenous to the fixed effects) and subsequently use this transformed instrument to cope with endogeneity. In our setup, we consider the lag of the migration rate and foreign aid as potentially endogenous and the number (stock) of migrants, the level of education and income as predetermined.5For obvious reasons of availability of data and time length between periods (i.e. 5 years), we only consider one and two period lagged differences as instruments. The standard errors (robust to het-eroskedasticity and arbitrary patterns of autocorrelation within individuals) are reported in parentheses using the Windmeijer (2005) finite-sample correction. We only present the results associated with the two-step GMM. However the results of the one step system-GMM are broadly identical.
4 Results
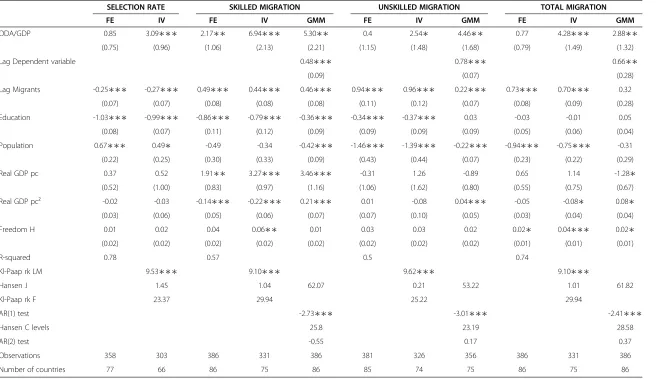
We present our results in Table 1. The structure of the table is the following: there are four blocks of three columns. Each block corresponds to one of the dependent variables described above (i.e. selection rate, skilled migration rate, unskilled migration rate and total migration rate). In each block the estimated coefficients associated with each of the estimators considered, Fixed Effects (FE), two stages least squares (IV) and System GMM (GMM), are reported in separate columns. The standard errors of the coeffi-cients (that are robust to heteroskedasticity and clustered by country) are presented just below the estimated parameters between brackets. To simplify the reading, we identify significant parameters at level 1%, 5% and 10% with respectively three, two and one star.
Table 1 Foreign aid and migration selection
SELECTION RATE SKILLED MIGRATION UNSKILLED MIGRATION TOTAL MIGRATION
FE IV FE IV GMM FE IV GMM FE IV GMM
ODA/GDP 0.85 3.09∗∗∗ 2.17∗∗ 6.94∗∗∗ 5.30∗∗ 0.4 2.54∗ 4.46∗∗ 0.77 4.28∗∗∗ 2.88∗∗
(0.75) (0.96) (1.06) (2.13) (2.21) (1.15) (1.48) (1.68) (0.79) (1.49) (1.32)
Lag Dependent variable 0.48∗∗∗ 0.78∗∗∗ 0.66∗∗
(0.09) (0.07) (0.28)
Lag Migrants -0.25∗∗∗ -0.27∗∗∗ 0.49∗∗∗ 0.44∗∗∗ 0.46∗∗∗ 0.94∗∗∗ 0.96∗∗∗ 0.22∗∗∗ 0.73∗∗∗ 0.70∗∗∗ 0.32
(0.07) (0.07) (0.08) (0.08) (0.08) (0.11) (0.12) (0.07) (0.08) (0.09) (0.28)
Education -1.03∗∗∗ -0.99∗∗∗ -0.86∗∗∗ -0.79∗∗∗ -0.36∗∗∗ -0.34∗∗∗ -0.37∗∗∗ 0.03 -0.03 -0.01 0.05
(0.08) (0.07) (0.11) (0.12) (0.09) (0.09) (0.09) (0.09) (0.05) (0.06) (0.04)
Population 0.67∗∗∗ 0.49∗ -0.49 -0.34 -0.42∗∗∗ -1.46∗∗∗ -1.39∗∗∗ -0.22∗∗∗ -0.94∗∗∗ -0.75∗∗∗ -0.31
(0.22) (0.25) (0.30) (0.33) (0.09) (0.43) (0.44) (0.07) (0.23) (0.22) (0.29)
Real GDP pc 0.37 0.52 1.91∗∗ 3.27∗∗∗ 3.46∗∗∗ -0.31 1.26 -0.89 0.65 1.14 -1.28∗
(0.52) (1.00) (0.83) (0.97) (1.16) (1.06) (1.62) (0.80) (0.55) (0.75) (0.67)
Real GDP pc² -0.02 -0.03 -0.14∗∗∗ -0.22∗∗∗ 0.21∗∗∗ 0.01 -0.08 0.04∗∗∗ -0.05 -0.08∗ 0.08∗
(0.03) (0.06) (0.05) (0.06) (0.07) (0.07) (0.10) (0.05) (0.03) (0.04) (0.04)
Freedom H 0.01 0.02 0.04 0.06∗∗ 0.01 0.03 0.03 0.02 0.02∗ 0.04∗∗∗ 0.02∗
(0.02) (0.02) (0.02) (0.02) (0.02) (0.02) (0.02) (0.02) (0.01) (0.01) (0.01)
R-squared 0.78 0.57 0.5 0.74
Kl-Paap rk LM 9.53∗∗∗ 9.10∗∗∗ 9.62∗∗∗ 9.10∗∗∗
Hansen J 1.45 1.04 62.07 0.21 53.22 1.01 61.82
Kl-Paap rk F 23.37 29.94 25.22 29.94
AR(1) test -2.73∗∗∗ -3.01∗∗∗ -2.41∗∗∗
Hansen C levels 25.8 23.19 28.58
AR(2) test -0.55 0.17 0.37
Observations 358 303 386 331 386 381 326 356 386 331 386
Number of countries 77 66 86 75 86 85 74 75 86 75 86
Robust standard errors in parentheses.
* significant at 10%; ** significant at 5%; *** significant at 1%.
Weak Identification F statistics corresponding to an IV relative bias <5% and an IV bias size <10%.
Ugarte
Ontiveros
and
Verardi
IZA
Journal
of
Migratio
n
2012,
1
:13
Page
9
o
f
1
9
http://ww
w.izajom.c
om/content
The null hypothesis is that there is underidentification and instrumenting is ineffi-cient. iii) The weak instrument Kleibergen-Paap rank Wald F-statistic to assess if instruments are sufficiently correlated with the right hand side endogenous variable. The critical values are non standard but available from Stock and Yogo (2005). Two null hypotheses can be tested using this statistic. The first is that the relative bias of instrumental variables with respect to that of OLS is smaller than 5% (which is quite demanding since, as a rule of thumb, instruments are generally not considered as weak if the relative bias is smaller than 20%). Second, that the relative size of the Wald test based on the IV statistic is smaller than 10% (as before, instruments are generally not considered as weak if the size is smaller than 20%). iv) We also report the Hansen J test statistic for overidentifying restrictions in IV. The joint null hypoth-esis is that the instruments are orthogonal to the errors. v) The Arellano-Bond z test statistic for autocorrelation to check if a dynamic panel estimator is well suited and, vi) the Hansen C test statistic for the validity of the additional instruments used in the “system GMM” estimator with respect to the simple “difference GMM”. Finally, vii) we present a second Arellano-Bond z test for AR(2) in first differences to test for an eventual additional serial correlation that could invalidate the instruments.
From Table 1, it emerges that foreign bilateral aid is positively correlated with skilled migration and the self selection of emigrants in LDCs. An increase in bilateral develop-ment assistance of 1% of GDP of sending countries leads to an increase in skilled mi-gration of about 7%, and to an increase in the selection rate of about 3%, i.e. foreign aid is positively correlated with the self selection of emigrants belonging to the upper tail of the education distribution. The regression related to unskilled migration, reported in the third block, show that higher levels of foreign aid are also associated with less edu-cated emigrants, though the effect is about half of that coming from skilled migration. Fourth block shows that aid is positively associated to total migration, which brings panel data evidence to the complementarity between aid and migration.
As can be seen from the tests at the bottom of the table, our instruments are both strong and exogenous, and IV estimation allows us to significantly reduce the size of the fixed effect endogeneity downward bias. The estimated effects of bilateral aid obtained using “system-GMM” are comparable in sign and in significativity to those obtained with IV. The autoregressive term is significant and of size 0.5 approximately for skilled, and 0.8 for unskilled migration. The remaining tests allow us to conclude that our results are not overidentified and that the use of both lags and difference instruments are correct.
between development and skilled migration but not between development and un-skilled migration. This fact provides evidence that un-skilled are more sensible to improve-ments in income than unskilled. As far as country size is concerned, our findings confirm that it is a key determinant of migration, the sign states that an increase in population generates a less than proportional increase in emigration. See stylized fact 2 in Docquier et al. (2007). Finally, regarding the socio political environment, the esti-mated coefficients associated with the Freedom index suggests that skilled migrants are more sensitive to civil liberties (in a country) than unskilled ones. Similar results are presented by Docquier et al. (2007) by using ethnic and religious tensions.
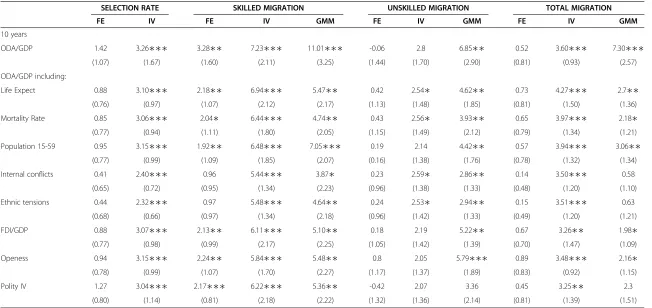
To test the robustness of our results, we first re-estimate our empirical models with ten year horizons. We also add a large number of covariates to our initial model. For the sake of clarity we only present, in Table 2, the coefficients associated to aid. Complete tables are available from the authors upon request. The description and the source of the data for these variables are summarized in Additional file 1: Table S1A in the appendix. The additional variables considered are: i) life expectancy and mortality rate, as additional measures of economic development in sending countries, ii) poten-tial migratory population, i.e. population between 15 and 59 year old, to control for prospective demographic push effect, iii) internal conflicts and ethnical tensions, to control for the driving effect of insecurity in sending countries, iv) foreign direct in-vestment inflows and trade openness to take into account the fact that economic liberalization is believed to offset migration by generating development, v) and an al-ternative measure of democracy (to the Freedom House index), the well-known Polity IV index of democracy.
As can be seen in Table 2, the results found in Table 1 on the effect of aid on our mi-gration rates and the selection rate are not contradicted by these changes in specifica-tions even if the size of effect varies as is to be expected. However unskilled migration turn to be not significantly different from zero in some IV specifications.
5 Analysis of the mechanisms
In this section we try to identify the link between aid and migration and suggest some mechanisms through which foreign aid might exert an effect on the size and skill com-position of emigrants.
The mechanisms driving the composition of migration with respect to skill level have been studied for a long time. Borjas (1987), stated that different self-selection patterns with respect to education levels may be observed depending on whether the wage skill profile is steeper at origin or destination. By assuming constant migration costs in the skill level of individuals, Borjas (1987) concludes that in countries having relatively high returns to education and earnings inequality, immigrants are drawn primarily from the lower half of the skill distribution of their home country. In addition to income differ-entials, recent work by Chiquiar and Hanson (2005), Fernández-Huertas (2011), high-light that different self-selection patterns with respect to education levels may also be observed depending on migration costs. These authors show that depending on the size and distribution of migration costs with respect to skill, emigrants might come from the lower, intermediate or upper half of the education distribution even if earnings in-equality is high in sending countries.6
Ugarte Ontiveros and VerardiIZA Journal of Migration2012,1:13 Page 11 of 19
Table 2 Aid and migration selection: sensitivity analysis
SELECTION RATE SKILLED MIGRATION UNSKILLED MIGRATION TOTAL MIGRATION
FE IV FE IV GMM FE IV GMM FE IV GMM
10 years
ODA/GDP 1.42 3.26∗∗∗ 3.28∗∗ 7.23∗∗∗ 11.01∗∗∗ -0.06 2.8 6.85∗∗ 0.52 3.60∗∗∗ 7.30∗∗∗
(1.07) (1.67) (1.60) (2.11) (3.25) (1.44) (1.70) (2.90) (0.81) (0.93) (2.57)
ODA/GDP including:
Life Expect 0.88 3.10∗∗∗ 2.18∗∗ 6.94∗∗∗ 5.47∗∗ 0.42 2.54∗ 4.62∗∗ 0.73 4.27∗∗∗ 2.7∗∗
(0.76) (0.97) (1.07) (2.12) (2.17) (1.13) (1.48) (1.85) (0.81) (1.50) (1.36)
Mortality Rate 0.85 3.06∗∗∗ 2.04∗ 6.44∗∗∗ 4.74∗∗ 0.43 2.56∗ 3.93∗∗ 0.65 3.97∗∗∗ 2.18∗
(0.77) (0.94) (1.11) (1.80) (2.05) (1.15) (1.49) (2.12) (0.79) (1.34) (1.21)
Population 15-59 0.95 3.15∗∗∗ 1.92∗∗ 6.48∗∗∗ 7.05∗∗∗ 0.19 2.14 4.42∗∗ 0.57 3.94∗∗∗ 3.06∗∗
(0.77) (0.99) (1.09) (1.85) (2.07) (0.16) (1.38) (1.76) (0.78) (1.32) (1.34)
Internal conflicts 0.41 2.40∗∗∗ 0.96 5.44∗∗∗ 3.87∗ 0.23 2.59∗ 2.86∗∗ 0.14 3.50∗∗∗ 0.58
(0.65) (0.72) (0.95) (1.34) (2.23) (0.96) (1.38) (1.33) (0.48) (1.20) (1.10)
Ethnic tensions 0.44 2.32∗∗∗ 0.97 5.48∗∗∗ 4.64∗∗ 0.24 2.53∗ 2.94∗∗ 0.15 3.51∗∗∗ 0.63
(0.68) (0.66) (0.97) (1.34) (2.18) (0.96) (1.42) (1.33) (0.49) (1.20) (1.21)
FDI/GDP 0.88 3.07∗∗∗ 2.13∗∗ 6.11∗∗∗ 5.10∗∗ 0.18 2.19 5.22∗∗ 0.67 3.26∗∗ 1.98∗
(0.77) (0.98) (0.99) (2.17) (2.25) (1.05) (1.42) (1.39) (0.70) (1.47) (1.09)
Openess 0.94 3.15∗∗∗ 2.24∗∗ 5.84∗∗∗ 5.48∗∗ 0.8 2.05 5.79∗∗∗ 0.89 3.48∗∗∗ 2.16∗
(0.78) (0.99) (1.07) (1.70) (2.27) (1.17) (1.37) (1.89) (0.83) (0.92) (1.15)
Polity IV 1.27 3.04∗∗∗ 2.17∗∗∗ 6.22∗∗∗ 5.36∗∗ -0.42 2.07 3.36 0.45 3.25∗∗ 2.3
(0.80) (1.14) (0.81) (2.18) (2.22) (1.32) (1.36) (2.14) (0.81) (1.39) (1.51)
Robust standard errors in parentheses.
* significant at 10%; ** significant at 5%; *** significant at 1%.
Note: All values of the coefficients correspond to bilateral aid. All regressions succeed the tests associated to Instrumental Variables and GMM.
and
Verardi
IZA
Journal
of
Migratio
n
2012,
1
:13
Page
12
of
19
om/content
In this framework, it is unlikely that international cooperation might influence the se-lection of emigrants by affecting the distribution of rewards to skill in LDCs. However, aid might help to ease migration costs in several ways: i) Aid might reduce transaction costs by providing opportunities for the highly skilled to migrate thanks to the attribu-tion of scholarship grants, and ii) reduce informational costs by providing information on donor countries, as aid creates bridges between the receiving and the donor coun-tries. iii) Aid might alsocreate networks and screen high level professionalsby providing direct contacts and opportunities for top workers to get a job abroad. iv) Finally, although international cooperation might not influence the wage-skill profile, aid might allow migration costs to be affordable by supporting growth, contributing to finance national incomes and thus increase wages (via income). There is evidence showing that if aid does foster development, it induces migration, see Rotte and Vogler (2000). How-ever, the aggregate effect on self-selection is unknown, an increase in LDCs’wages may help willing unskilled or skilled emigrants to bear the costs of migration (overcome budget constraints), but it might also incentivate them to stay at home. Whether the skilled or the unskilled are more sensitive to changes in income is unclear. Orrenius and Zavodny (2005), for example, find that better economic conditions in Mexico pro-vide a higher disincentive to migrate among undocumented skilled Mexicans than among the undocumented unskilled. Moreover, if the migration costs are decreasing in skill level as in Chiquiar and Hanson (2005), an improvement of the economic condi-tions would alleviate mainly the liquidity constraints faced by the skilled.
In this section, hereafter we present some results supporting each of these possible mechanisms that might explain the effect of aid on migration selection. The approach adopted follows that of the aid effectiveness literature. Aid pursues multiple objectives when granted to developing countries, and different types of aid are likely to have different economic outcomes, some of them associated to migration. Therefore, we disaggregate aid into specific-purpose categories that are more likely affecting the mechanisms described previously and test the direct effect of aid categories on migration.7
We start by testing the effect of aid on migration seeing it as a tool to overcome liquidity constraints and reduce transaction costs, mainly for the highly skilled, through the attribution of scholarship grants, tuition fees, flight tickets, etc., by donor countries. This brings an undeniable opportunity and incentives for many students and profes-sionals to go abroad. Recently, the IOM (2008) stated that international students repre-sent around 20% of the skilled migration. To test this mechanism we check for the direct effect of technical cooperation from the six countries on the selection rate and on the skill composition of emigrants. During the period 1990-2006 technical cooper-ation represented annually in average 24% of ODA net disbursements, OECD (2007). We assume that overstaying is rather high.8
We also test the effect of aid on migration by considering the bilateral relation be-tween donor and recipient countries either by projects or by diplomatic ties, which cre-ates opportunities for contacts between both countries, easing access to information about requirements and labor market conditions in donor countries, and reducing pro-cedure costs to the attainment of legal permissions. Hence, we expect that the better the relations between donor and recipient countries, the higher the reduction in these transaction and information costs (specially for educated workers) and the easier the
Ugarte Ontiveros and VerardiIZA Journal of Migration2012,1:13 Page 13 of 19
ways to migrate. We use as an indicator of the closeness between donor and recipient countries, theproportion of bilateral aid from the six donors to total aid received from all DAC donors. Higher values of this ratio may be understood as better links for the recipients with these countries, compared to all remaining donors. Furthermore, we test the effect of aid considering it as mechanism to provide information, create net-works and screen high level native professionals. We use for that project aid (under-stood as the funds used to implement specific projects in which allocation, financing and management are controlled by the donors). More project interventions might be related to better information for natives on donor countries, more contacts and net-works, and more opportunities for the top educated workers to be employed abroad.
Finally, another specific mechanism through which aid might influence self-selection is by modifying incentives to migrate via income. It is however still not clear what is the efficiency of aggregate aid in sustaining growth (see Rajan and Subramanian, 2008). Some authors have presented evidence showing that categories of aid related to the support of development exert a positive effect on growth, see Clemens et al. (2004), Gomanee et al. (2005), Minoiu and Reddy (2010). As a consequence assuming that aid targeted exclusively to promote development is supporting growth, contributing to financing the gross national income in recipient countries and thus increasing wages, aid might (dis)incentive new emigrants. For testing the effect of developmental aid on migration selection we use many proxies.
To begin with, i) we considerNet aidfrom the six donors which, following Gomanee et al. (2005), is defined as ODA disbursements minus food aid and humanitarian non food aid.9We also consider ii) Developmental aidwhich, following Minoiu and Reddy (2010), is defined as the part of ODA disbursements highly associated with develop-ment enhancedevelop-ment. This variable is not readily available but is generally proxied by the aid donated by Scandinavian countries, see Minoiu and Reddy (2010). And, iii) Early impact aid which, according to Clemens et al. (2004), is defined as the part of aid that has short-term effects. Broadly speaking, early-impact aid is budgetary support while long-run aid is related to infrastructure investments and social aid. iv) We also focus on Chang et al. (1999) and their criticism on the potential overstating in the level of as-sistance by ODA. We hence examine the effect of aid measured by the Effective Devel-opment Assistance (EDA) from DAC donors, i.e. the sum of grants and the grant equivalents of official loans. v) Finally, we also consider inflows of aid (ODA) from overall DAC donors. A description of all these proxies is presented in Additional file 1: Table S1A in Appendix.
misrepresenting the size of tests and the range of confidence intervals. To address this we opt to use in addition to IV, the Fuller’s modified limited information maximum-likelihood estimator (Fliml), Fuller (1977). As shown by Hahn et al. (2004), Flores-Lagunes (2007), these estimators perform better overall with weak instruments. The Fliml estimator belongs to the so called k-class estimators and setsk¼λα=ðNLÞ, where λ is the liml eigenvalue, L= number of instruments, and α corresponds to the Fuller parameter constant. The Fuller estimator withα=1 yields the best unbiased esti-mator and is recommended when one wants to test hypotheses; the Fuller with α =4 estimator minimizes the mean squared error of the estimator. We report estimations based on both Fuller constants 1 and 4. Panel A of Table 3 shows that using either of these Fuller estimators produces estimates that are quite similar to the IV estimates.
The structure of Table 3 is as follows: there are three blocks corresponding to our three dependent variables of interest. In each block the coefficients of aid associated with each of the estimators considered are reported in separate columns. There are two sections, panel A contains the variables estimated by the Fuller’s limited information maximum-likelihood and IV estimators. Whereas inside panel B we find estimates based on FE, IV and GMM, respectively. Below the estimated parameters, between brackets, robust standard errors are presented, followed by either the Kleibergen-Paap rk Wald F statistic for weak instruments in case IV is implemented, or the Hansen C statistic in case GMM is implemented.
As can be seen in the first row of Table 3, technical cooperation tends to increase the education gap between emigrants and non emigrants in LDCs since it presents a sig-nificant and positive effect on the selection rate and it is positively associated to skilled migration, but not to unskilled migration. In the second row, the proxy for bilateral relations does not have any effect on the selection rate, and its effect on skilled migra-tion is significantly positive (though small). In the first row of Panel B, the “network and screening” mechanism does not influence either skilled or unskilled migration as project aid is non-significant in all cases. Indeed highly skilled workers could be hired to work for projects in their home country and therefore do not necessarily migrate as a consequence of “project” aid. To summarize, we conclude that foreign aid through technical cooperation, likewise major formal links between donors and recipient coun-tries, may help in reducing transaction and information costs for highly educated work-ers and in this way ease skilled migration.
Finally, the coefficients associated to aid targeted to development (rows 2 to 5 of Panel B) show that skilled workers are more responsive to better economic conditions enhanced by aid than unskilled workers, i.e. the effect of an increase in developmental aid contri-butes to the overcoming of the budget constraints of skilled emigrants. This might suggest that migration costs are decreasing in skill level as in Chiquiar and Hanson (2005). These results are somehow different to the findings in Berthélemy et al. (2009), who suggest that unskilled people are more sensitive to changes in income (the effect of total aid on unskilled migration is larger compared to the effect on skilled migration). In row 6 of Panel B we use aid (ODA) coming from all DAC donors as explanatory variable, and the results are similar to that obtained using bilateral proxies, that is a larger and more signifi-cant effect of aid on skilled migration than on unskilled migration. Based in our results, we believe that the effect of foreign aid is to increase the flow of skilled emigrants and to widen the education gap between emigrants and natives (brain drain).
Ugarte Ontiveros and VerardiIZA Journal of Migration2012,1:13 Page 15 of 19
Table 3 Mechanisms
PANEL A
SELECTION RATE SKILLED MIGRATION UNSKILLED MIGRATION
IV Fliml 1 Fliml 4 IV Fliml 1 Fliml 4 IV Fliml 1 Fliml 4
TechCoop/GDP 1.47∗∗ 1.60∗∗ 1.23∗∗ 3.62∗∗ 4.07∗∗ 2.94∗∗ 1.77 1.59 1.22
(0.72)[9.1] (0.80)[9.1] (0.59)[9.1] (1.81)[9.7] (2.11)[9.7] (1.41)[9.7] (1.10)[9.3] (0.98)[9.3] (0.75)[9.3]
Bilat aid/Total aid 0.09 0.09 0.08 0.85∗∗∗ 0.82∗∗∗ 0.75∗∗∗ 0.08 0.08 0.07
(0.20)[11.9] (0.20)[11.9] (0.17)[11.9] (0.33)[10.3] (0.31)[10.3] (0.27)[10.3] (0.27)[10.6] (0.26)[10.6] (0.24)[10.6]
Project aid/GDP 5.63 9.77 3.8 4.12 5.8 2.9 12.11 8.86 4.54
(7.76)[9.1] (10.74)[9.1] (4.13)[9.1] (11.14)[12.2] (21.30)[12.2] (4.68)[12.2] (9.75)[11.7] (6.60)[11.7] (3.17)[11.7]
PANEL B
SELECTION RATE SKILLED MIGRATION UNSKILLED MIGRATION
FE IV FE IV GMM FE IV GMM
Net aid/GDP 1.93∗∗ 4.14∗∗∗ 3.18∗∗ 9.12∗∗∗ 7.44∗∗∗ -0.53 3.30∗ 4.39
(1.01) (1.32)[39.2] (1.34) (2.92)[58.4] (3.08)[64.6] (1.27) (1.96)[44.2] (3.03)[52.3]
Dev aid/GDP 0.94 3.94∗ 5.57∗∗∗ 8.12∗∗ 8.98∗∗ 3.02 2.62 4.09
(0.97) (2.18)[31.2] (1.88) (4.08)[20.5] (4.20)[64.5] (3.03) (1.84)[29.1] (2.67)[55.7]
Early-imp aid/GDP 0.25 1.62∗∗ 0.38 3.50∗∗∗ 1.12 0.5 1.75∗ 2.28
(0.64) (0.82)[49.9] (0.94) (1.30)[37.5] (1.95)[60.1] (1.07) (1.05)[39.9] (1.76)[63.2]
EDA/GDP -0.09 0.99∗∗ 0.97∗∗∗ 2.99∗∗ -0.24 0.28 -0.89 1.36
(0.24) (0.47)[36.7] (0.36) (1.38)[60.8] (0.96)[52.1] (0.57) (0.90)[32.6] (0.89)[37.2]
TODA/GDP -0.06 1.58∗∗∗ 0.70∗ 3.62∗∗∗ 0.87 0.31 1.28∗ 1.43∗
(0.21) (0.58)[38.6] (0.37) (1.33)[24.8] (0.73)[64.7] (0.48) (0.78)[37.8] (0.81)[47.4]
Robust standard errors in parentheses.
Weak Identification F statistics or Hansen C statistics in brackets [ ], in case either IV or GMM is implemented, respectively. * significant at 10%; ** significant at 5%; *** significant at 1%.
Note: All regressions succeed the tests associated to Instrumental Variables and GMM.
and
Verardi
IZA
Journal
of
Migratio
n
2012,
1
:13
Page
16
of
19
om/content
6 Conclusions
In this paper, using recently compiled panel data on international migration by education attainment (from Defoort and Rogers, 2008), we analyze the impact of aid on the skill bias of migration (self-selection), and on the skill composition of emigrants (skilled and unskilled migration). The empirical results point towards a significant relation between aid and positive self-selection among international emi-grants. The effect on skilled migration is larger and more significant than the effect on unskilled migration.
We then test the possible mechanisms through which foreign aid can exert an effect on the skill composition of migration. We find that technical cooperation reduces migration costs for educated people, and therefore induces a positive selection of migrants. We also find that better recipient-donor bilateral relations favor skilled mi-gration. Finally, aid targeted (exclusively) to development softness the budget con-straints of skilled migrants (this result suggests that skilled migrants are more sensitive to changes in economic conditions than unskilled migrants).
As a consequence, given the result of this analysis, we remain skeptical on the idea supported by international agencies that retention of skilled workers can be achieved via aid. However, data availability issues only allow us to study a reduced form. We therefore consider this paper a starting point for much needed further research on this topic.
Endnotes 1
Total, skilled and unskilled migration rates are monotonically transformed by ln [m/1-m], following Docquier et al. (2007). It expands the range of the variable from (0,1) to (−inf,+inf).
2 The differences with Docquier et al. (2007)’s specification are: i) variables that do
not change over time are replaced by the country fixed effects, ii) we include as regres-sor the lag of the number of immigrants to account for diaspora effects. And, iii) we use Freedom House as a measure of sociopolitical environment at origin, instead of governance and fractionalization indicators, since it changes over time and it is avail-able for our period of analysis.
3
Note that we also generated instruments relying on heteroskedasticity as suggested by Lewbel (2012). These additional instruments did not modify our findings and actu-ally allowed to better test for the exogeneity of our instruments. We indeed run a test of overindentifying restrictions of our instruments with respect to the generated ones and endogeneity was rejected. Results are available from the authors upon request.
4
The selection equation it is not estimated by a dynamic model since there is not enough evidence for persistence as the selection rate failed to pass the Arellano-Bond test for autoregressive correlation in time, AR(1). Consequently, a dynamic estimator is not suited for this variable.
5
However the results are not sensitive to changes between predetermined and endogenous.
6
Similarly, McKenzie and Rapoport (2007) enhance the role of migration costs and suggest that high (low) migration networks, by reducing (increasing) costs, induce negative (positive) selection. At cross country level, Grogger and Hanson (2010)
Ugarte Ontiveros and VerardiIZA Journal of Migration2012,1:13 Page 17 of 19
highlight the role of absolute wages differences and fixed costs in influencing selectivity of international migration flows.
7
Since we cannot consider aid as exogenous, testing indirect mechanisms while taking care of the endogeneity between aid and migration, turned highly demanding in terms of excluded restrictions, either by estimating two stage least squares with two endogenous variables (aid and the mechanism, e.g. income) or a system of three equa-tions. Thus we leave open this endeavor for future research.
8
The OECD (2008) states that at best 15-20% of granted graduates might be staying on in OECD countries.
9
Note that Gomanee et al. (2005) also excludes Technical Cooperation, but we still include it because it might be correlated with skilled migration.
10
Although these values succeed the rule of thumb criterion of around 10, we are aware of our results since these values do not pass the critical values of the Stock-Yogo weak identification test critical values.
Additional file
Additional file 1: Table S1A.Appendix.
Competing interests
The IZA Journal of Migration is committed to the IZA Guiding Principles of Research Integrity. The authors declare that they have observed these principles.
Vincenzo Verardi is Associated Researcher of the FNRS and gratefully acknowledges their financial support.
Acknowledgements
We would like to thank Jean-Philippe Platteau, Jean-Marie Baland, Frédéric Docquier, Ruxanda Berlinschi, Alice McCathie and the referees for insightful comments that improved this paper as well as our colleagues at CRED and ECARES. The usual disclaimer applies.
Responsible editor: Amelie Constant.
Funding
Vincenzo Verardi is Associated Researcher of the FNRS and gratefully acknowledges their financial support.
Author details
1University of Namur (CRED), Namur, Belgium.2University of Namur (CRED) and Université Libre de Bruxelles (ECARES and i-cite), Namur, Belgium.
Received: 1 October 2012 Accepted: 20 December 2012 Published: 31 December 2012
References
Arellano M, Bond S (1991) Some tests of specification for panel data: Monte Carlo evidence and an application to employment equations. Rev Econ Stud 58:277–297
Arellano M, Bover O (1995) Another look at the instrumental variables estimation of error components models. J Econometrics 68:29–51
Barro R, Lee J (2001) International data on educational attainment: updates and implications. Oxford Econ Pap 53:541–563
Beine M, Docquier F, Rapoport H (2008) Brain drain and human capital formation in developing countries: winners and losers. Econ J 118:631–652
Beine M, Docquier F, Defoort C (2011) A panel data analysis of the Brain Gain. Worl Dev 39:523–532
Berthélemy JC, Tichit A (2004) Bilateral donors’aid allocation decisions: a three-dimensional panel analysis. Int Rev Econ Fin 13:253–274
Berthélemy JC, Beuran M, Maurel M (2009) Aid and Migration: Substitutes or Complements? World Dev 37:1589–1599 Bhagwati JN, Hamada K (1974) The Brain drain, international integration of markets for professionals and
unemployment: A theoretical analysis. J Dev Econ 1:19–42
Birdsall N, Claessens S, Diwan I (2003) Policy selectivity foregone: debt and donor behavior in Africa. World Bank Econ Rev 17:409–435
Blundell R, Bond S (1998) Initial conditions and moment restrictions in dynamic panel data models. J Econometrics 87:115–143
Borjas GJ (2003) The labour demand curve is downward sloping: Reexamining the impact of immigration on the labour market. Q J Econ 118:1335–1374
Borjas GJ (2006) Native internal migration and the labour market impact of immigration. J Hum Resour 41:221–258 Burnside C, Dollar D (2000) Aid, policies and growth. Am Econ Rev 90:847–868
Chang CC, Fernandez-Arias E, Serven L (1999) Measuring aid flows: a new approach. In:Policy Research Working Paper
2050. World Bank, Development Economics Research Group
Chiquiar D, Hanson GH (2005) International migration, self-selection, and the distribution of wages: Evidence from Mexico and the United States. J Polit Econ 113:239–281
Clemens MA, Radelet S, Bhavnani R (2004) Counting chickens when they hatch: The short term effect of aid on growth. In:Center for Global Development Working Paper44
Cohen D, Soto M (2007) Growth and human capital: good data, good results. J Econ Growth 12:51–76
Dayton-Johnson J, Katseli L (2006) Migration, aid and trade: Policy coherence for Development. In:OECD Development Centre Policy Brief28
Defoort C, Rogers G (2008) Long trends in international migration: An analysis of the 6 main receiving countries. Population 63:285–317
Docquier F, Marfouk A (2006) International migration by educational attainment, 1990-2000 (Release 1.1). In: Ozden C, Schiff M (eds) International Migration, Remittances and Development, 5th edn. McMillan and Palgrave, N.Y Docquier F, Lohest O, Marfouk A (2007) Brain drain in developing countries. World Bank Econ Rev 21:193–218 Fernández-Huertas J (2011) New Evidence on Emigration Selection. In: Review of Economics and Statistics 93:72–96 Flores-Lagunes A (2007) Finite sample evidence of IV estimators under weak instruments. J Appl Econom 22:677–694 Fuller W (1977) Some properties of a modification of the limited information estimator. Econometrica 45:939–954 Goldin C (1994) The political economy if immigration restriction in the U.S., 1890 to 1921. In: Goldin C, Lebecap G (eds)
The Regulated Economy: A Historical Approach to Political Economy. University of Chicago Press Gomanee K, Girma S, Morrissey O (2005) Aid and growth in Sub-saharan Africa: Accounting for transmission
mechanisms. UNU-WIDER Research Paper 60
Grogger J, Hanson G (2010) Income Maximization and the Sorting of Emigrants across Destination Countries. J Dev Econ 95:42–57
Hahn J, Hausman J, Kuersteiner G (2004) Estimation with weak instruments: accuracy of higher-order bias and MSE approximations. Economet J 7:272–306
Heston A, Summers R, Aten B (2006)Penn World Table Version 6.2, Center for International Comparisons of Production. Income and Prices at the University of Pennsylvania
IOM (2008) World Migration, Managing labour mobility in the evolving economy. International Organization for Migration World Migration Report Series Vol 4
IOM., UNCTAD (1996) Foreign Direct Investment, Trade and Aid: An alternative to Migration. International Organization for Migration and United Nations Conference on Trade and Development
Lacomba J, Boni A (2008) The role of emigration in foreign aid policies: The case of Spain and Morocco. Int Migr 46:123–150
Lee R, Miller T (2000) Immigration, social security, and broader fiscal impacts. Am Econ Rev 90:350–354
Lewbel A (2012) Using Heteroscedasticity to Identify and Estimate Mismeasured and Endogenous Regressor Models. J Bus and Econ Stat 30:67–80
Lowell L, Findlay AM (2006) Migration of highly skilled persons from developing countries: impact and policy responses. Synthesis report for the International Labour Office ILO
McKenzie D, Rapoport H (2007) Network effects and the dynamics of migration and inequality: Theory and evidence from Mexico. J Dev Econ 84:1–24
Minoiu C, Reddy S (2010) Development aid and economic growth: A positive long-run relation. Q Rev Econ Finance 50:27–39
Munshi K (2003) Networks in the modern economy: Mexican migrants in the U.S. labour market. Q J Econ 118:549–599 OECD (2007) International Migration Outlook. OECD, Paris
OECD (2008) International Migration Outlook. OECD, Paris
Orrenius PM, Zavodny M (2005) Self-selection among undocumented immigrants from Mexico. J Dev Econ 78:215–240 Rajan RG, Subramanian A (2008) Aid and growth: What does the cross-country evidence really show? Rev Econ Stat
90:643–665
Rotte R, Vogler M (2000) The effects of development on migration: Theoretical issues and new empirical evidence. J Popul Econ 13:485–508
Roy AD (1951) Some Thoughts on the Distribution of Earnings. Oxford Econ Pap 3:135–146 Stalker P (2002) Migration Trends and Migration Policy in Europe. Int Migr 40:151–179
Stock JH, Yogo M (2005) Testing for weak instruments in linear IV regression. In: Stock JH, Andrews DWK (eds) Identification and Inference for Econometric Models: A Festschrift in Honor of Thomas Rothenberg, 5th edn. Cambridge University Press, Cambridge, pp 80–108
UNCTAD (2007) Least Developed Countries Report 2007: Knowledge, technological learning and innovation for Development. United Nations Conference on Trade and Development
Windmeijer F (2005) A finite sample correction for the variance of linear efficient two-step GMM estimators. J Econometrics 126:25–51
Wong K, Yip CK (1999) Education, economic growth and brain drain. J Econ Dynam Contr 23:699–796
doi:10.1186/2193-9039-1-13
Cite this article as:Ugarte Ontiveros and Verardi:Does aid induce brain drain? A panel data analysis.IZA Journal of Migration20121:13.
Ugarte Ontiveros and VerardiIZA Journal of Migration2012,1:13 Page 19 of 19