Volume 2, Issue 3, March 2013
Page 230
ABSTRACT
The objective of this research is to study Epoxy (EP)/nano and micro titanium dioxide (TiO2)composites were prepared with different weight percentage of nano and micro TiO2 powder (1,2,3,and 5wt% ). Atomic force microscopy techniques was used to measure the grain size of nano TiO2 powder (average diameter 26.4nm)of micro and nano TiO2 as (1, 2, 3 and 5 wt.%) composites with respect to wear and hardness properties. Three types of applied load of wear resistance were performed with constant sliding velocity and hardness (shore D) were study. In general the wear rate was increased with the load applied (20N) and decreased with increasing weight percentage of titanium dioxide in epoxy matrix. The sample having the lowest wear rate = 1.1E-07 gm/cm for 20N, contained nano 5wt% Titanium dioxide. Nano composites of epoxy /TiO2 have many advantages over micro composites from the view point of wear and hardness tests.
Key wards: EP/nano TiO2 composites, wear rate, shore hardness , atomic force microscopy (AFM).
1.
INTRODUCTION
Epoxy alone has a high friction coefficient in most applications, as well as poor wear resistance compared to epoxy containing composites. In this research, we review the wear/hardness processes to increase the wear resistance of epoxy. As a result of scientific progress there is a need to polymeric materials. Less useful certain specifications obtained from the neat polymer alone of one kind without any reinforcement with adding material, inorganic mineral fillers or fibers to improvement their performance properties[1],[2].
The desired specifications of industrial polymer as to obtain a mixture or a composite. Recently it was appeared an attention to the study of friction, lubrication, wear and tear that shows clearly its role in the operation processes of mechanical systems, which include in its work a friction and wear. Study Ears of wear and tear of the polymeric materials metal complexes in general and in particular, is provided because of a large, light weight and ease of manufacture and good durability and low coefficient of contact with him and carry high loads[3],[4].
The properties of particulate filled polymer composites depend on the particles size, shape, loading, dispersion, interfacial bonding, and surface treatment of the fillers. The dispersion of fillers in polymer matrix has influence on the physical, mechanical, and thermal properties of polymers. Among the various mineral fillers, calcium carbonate (CaCO3) , zinc oxide (ZnO) and titanium dioxide (TiO2) have been the most utilized materials. TiO2 is mainly used as white pigment due to its brightness. The wear is the process of wear and tear on the material surface erosion solid surface as a result affected by another solid body. Wear is the direct result of the same processes that causes friction – the movement of the asperities on the surfaces over one another. If the frictional block and plate model is considered, then it is easy to see that the constant if the frictional block and plate model is considered, then it is easy to see that the constant movement of the asperities over one another, with the repeated elastic and plastic deformation, will lead to material removal and a grinding down of the asperities [5],[6].
Experimental procedure:
Atomic Force Microscopic (AFM)
The grain size of Titanium dioxide is( 26.4 nm) was examined with an atomic force microscopy , a powerful tool for surface imaging at the nanometer to sub micrometer instrument: CSPM-AA3000.Diamrter is found for nano TiO2 with average (AFM)as shown in Fig(1a,and b )
Sample preparation method
Epoxy (EP10) and hardener type (HY-956) were used in this study in ratio of 3:1 for with nanoTiO2 (26.4nm) and
micro TiO2(1.5μm) to form nano and micro composites with three different weight percentage of TiO2 (1, 2, 3, and 5
%wt). Careful mixing of EP with TiO2 and composites were then further mixed in an ultrasonic generator (Struers type
3570380), processor at 20 kHz for typically 20 minutes, was needed to minimize voids and clustering and to reduce the
Comparison study of wear and hardness of EP/
nano and micro TiO
2
composites
Farah.T. Mohammed Noori 1, Nadia Abbas Ali2 and Ekram A. Al ajaj3
1,2,3
Volume 2, Issue 3, March 2013
Page 231
size of the TiO2 particle agglomerates and finally keep it in vacuum. The sample were cast in moulds were cut in
dimensions (250mm*250mm*3mm). The samples in this study was completed normal load (10, 15, 20) and a 50.8 mm/s sliding speed.
Fig.(1 a, and b )AFM of titanium dioxide.
Adhesive Wear Test
Wear tests are carried out in a pin-on-disc type friction and wear monitoring test rig (supplied by DUCOM) as per ASTM G 99. The experimental set up is shown in Figure 1. The counter body is a disc made of hardened ground steel hardness (269HB) and with speed 500 rpm and track radius 6 cm. The specimen is held stationary and the disc is rotated while a normal load is applied through a lever mechanism. Series of test are conducted with three sliding velocities of 6, 9 and 12 cm/sec under three different normal loading of 10N, 15N and20N. The material loss from the composite surface is measured using a precision electronic [6] is given as
Wear rate (WR) =
D
S
W
………(1)
And the sliding distance is given as:
SD=2 π r n t ………..(2)
WR: Wear rate (gm/cm)
ΔW: Weight difference(gm)
t: is the test time (sec) r: radius of center rotating
n: number of cycle (500 rpm)
Hardness test
Shore hardness is tested with an instrument called Durometer utilizes an indenter loaded by a calibrated spring (Shore D Hardness tester TH210). The measured hardness is determined by the penetration depth of the indenter under the load.
Results and Dissections
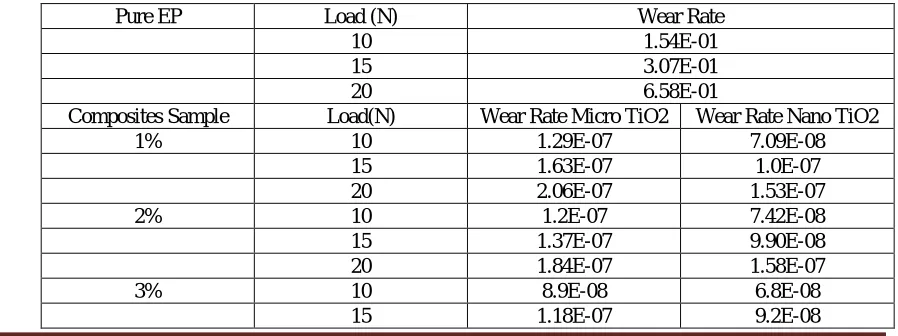
Wear rate results for EP/microTiO2 and EP/nano TiO2 composites for different applied loads presented in Table (1)
Table (1): wear rate of pure epoxy and EP/microTiO2 and EP/nano TiO2 composites
Wear Rate Load (N)
Pure EP
1.54E-01 10
3.07E-01 15
6.58E-01 20
Wear Rate Nano TiO2 Wear Rate Micro TiO2
Load(N) Composites Sample
7.09E-08 1.29E-07
10 1%
1.0E-07 1.63E-07
15
1.53E-07 2.06E-07
20
7.42E-08 1.2E-07
10 2%
9.90E-08 1.37E-07
15
1.58E-07 1.84E-07
20
6.8E-08 8.9E-08
10 3%
9.2E-08 1.18E-07
Volume 2, Issue 3, March 2013
Page 232
1.44E-07 1.69E-07
20
6.0E-08 9.87E-08
10 5%
7.0E-08 1.16E-07
15
1.1E-07 1.7E-07
20
For this study, the epoxy matrix was originally filled with small weight percents of Titanium dioxide to increase the wear resistance; the wear rate increased by more than 10 with the addition of 1 wt%. Fig.( 2-6) and Table (1) give all of the samples created for the study and the corresponding wear rates versus applied load (10, 15, and 20) N for all the Wt% of each nano and microTiO2 filler it is observed increasing of wear rate with increase of applied load for all
samples and also observed decreasing the wear rate for nano composites than of micro composites . The sample having the lowest wear rate = 1.1E-07 gm/cm for 20N, contained nano 5wt% Titanium dioxide and 95wt% EP.
EP
0.00E+00 1.00E-01 2.00E-01 3.00E-01 4.00E-01 5.00E-01 6.00E-01 7.00E-01
5 10 15 20 25
Load(N )
W
e
a
r
R
a
te
(g
m
/c
m
)
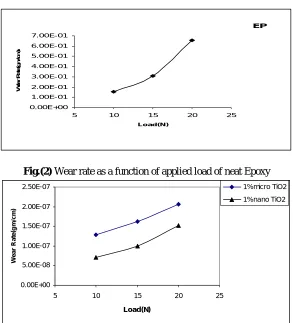
Fig.(2) Wear rate as a function of applied load of neat Epoxy
0.00E+00 5.00E-08 1.00E-07 1.50E-07 2.00E-07 2.50E-07
5 10 15 20 25
Load(N)
W
e
a
r
R
a
te
(g
m
/c
m
)
1%micro TiO2
1%nano TiO2
Fig.(3) Wear rate as a function of applied load of 1wt%micro and nanoTiO2composite
0.00E+00 2.00E-08 4.00E-08 6.00E-08 8.00E-08 1.00E-07 1.20E-07 1.40E-07 1.60E-07 1.80E-07 2.00E-07
5 10 Load (N)15 20 25
W
e
a
r
R
a
te
(
g
m
\c
m
)
2%microTiO2
2%nanoTiO2
Volume 2, Issue 3, March 2013
Page 233
0.00E+00 2.00E-08 4.00E-08 6.00E-08 8.00E-08 1.00E-07 1.20E-07 1.40E-07 1.60E-07 1.80E-075 10 15 20 25
Load(N) W e a r R a te (g m /c m ) 3%microTiO2 3%nano TiO2
Fig. (5) Wear rate as a function of applied load of 3wt%micro and nanoTiO2composite
0.00E+00 2.00E-08 4.00E-08 6.00E-08 8.00E-08 1.00E-07 1.20E-07 1.40E-07 1.60E-07 1.80E-07
5 10 Load( N)15 20 25
W e a r R a te (g m /c m ) 5% microTiO2 5%nanoTiO2
Fig.(6) Wear rate as a function of applied load of 5wt%micro and nanoTiO2composite
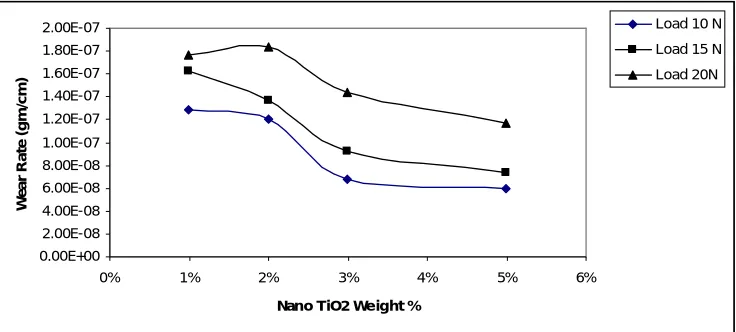
Tow Fig (7-8) for both Epoxy micro and nano TiO2 was observed that decreased of wear rate with increasing weight
percentage of dioxide Titanium powder.
0.00E+00 2.00E-08 4.00E-08 6.00E-08 8.00E-08 1.00E-07 1.20E-07 1.40E-07 1.60E-07 1.80E-07
0% 1% 2% 3% 4% 5% 6%
M icro TiO2 w e ight %
W e a r R a te ( g m /c )
Load 10 N Load 15 N Load 20 N
Fig.(7) Wear rate with Epoxy/ microTiO2 composites for different applied loads
0.00E+00 2.00E-08 4.00E-08 6.00E-08 8.00E-08 1.00E-07 1.20E-07 1.40E-07 1.60E-07 1.80E-07 2.00E-07
0% 1% 2% 3% 4% 5% 6%
Nano TiO2 We ight %
W e ar R at e ( g m /c m )
Load 10 N
Load 15 N
Load 20N
Volume 2, Issue 3, March 2013
Page 234
The increase of wear rate by increase load due to increase the friction strength of friction force,
F
is theaverage normal load (N) and μ is friction strength coefficient. When two bodies slide/rub against each other under the
influence of a force commonly, the surface of the softer body loses mechanical cohesion and debris is formed that is dislodged from the contact zone resulting in scratch/wear damage. Polymer materials when reinforced with high modulus fibers yieldhigher strength, higher stiffness, better toughness, and good dimensional stability[7],[8].Fiber reinforcementsare effective in reducing wear in adhesive situations in additionto increasing the strength and stiffness. Nano scale Fillers such as, TiO2, SiO2, and Al2O3 have also been shown to reduce friction and wear in epoxy matrix
composites[9],[10]. For hardness resistance are achieved at the larger of nano composites than micro composites hardness tests were run on the EP/nano TiO2 composites with filler content of (1, 2, 3 and 5 wt%) are recorded as 62
Hv ,78.2 Hv, 82 Hv and 85 respectively. For hardened of unfilled composite, is found to be 58.75 Hv. It is thus seen that the hardness is improved, though marginally, by the incorporation of TiO2 as shown in Fig.9.
20 30 40 50 60 70 80 90
0% 1% 2% 3% 4% 5% 6%
TiO2%
H
a
rd
n
e
s
s
Micro TiO2 Nano TiO2
Fig.(9) Hardness effect of Epoxy/ micro and nano TiO2 composite as a function of TiO2 wt%
Polymer nano composites have many advantages over micro composites from the viewpoint of wear and hardness test, so, to overcome these backs from macro- and micro scale reinforcements, nano scale fillers were introduced – where the filler is<50 nm in at least one dimension. Generally, three major characteristics define and form the basis of performance of polymer nano composites: (i) nano confined matrix polymer chains, (ii) nano scale inorganic constituents, and (iii) nano scale arrangement of these constituents [11].
2.
C
ONCLUSION1- It is observed increasing of wear rate with increase of applied load for all samples and observed decreasing the wear rate for nano composites than of micro composites. The sample having the lowest wear rate =1.1E-07gm/cm for 20N, contained 5wt% nano Titanium dioxide and 95wt% EP.
2- Epoxy/TiO2 nano composite hardness increase with weight percentage of TiO2 and for all concentration larger than
micro composites.
3- Hardness resistance are achieved at the larger of nano composites than micro composites hardness tests were run on the EP/TiO2composites with filler.
4-polymer nanocomposites have many advantages over Micro composites from the viewpoint of wear rate and hardness test.
R
EFERENCES[1] Sirirat Wacharawichanant,Supakanok Thongyai2, Tanakorn Siripattanasak, and Tunya Tipsri,” Effect of Mixing Conditions and Particle Sizes of Titanium Dioxide on Mechanical and Morphological Properties of Polypropylene/Titanium Dioxide Composites” journal of Iranien Polymèr 18 (8),pp. 607-616, 2009.
[2] Misra RDK, Nerikar P, Bertrand K, Murphy D, “Some aspects of surface deformation and fracture of 5-20% calcium carbonate-reinforced polyethylene composites”, journal of Mater Sci Eng A, 325 ,pp. 284-298, 2004 [3] Chae DW, Kim BC, “Characterization on polystyrene. /zinc oxide nanocomposites prepared from solution mixing”,
journal of Polymer Adv Technol, 16(6),pp. 846-850, 2005.
[4] G.Lee, R.O.Ritchie, C.K.Hdharan, "fraction and wear of materials", Journal Wear 252, pp.322-331,2005
[5] C Kaddick” Wear Testing of Implants – State of the Art” journal of European Cells and Materials , 17(1) , pp. 1473-2262,2009.
Volume 2, Issue 3, March 2013
Page 235
[7] L.Chang, Z.Zhang, C.Breidt, K.Friedrich ‘Tribological properties of epoxy nanocomposites: I. Enhancement of the wear resistance by nano-TiO2 particles” Second International Conference on Erosive and Abrasive Wear,258,Issues1-4,pp.141-148,2005.
[8]Victor M.F. Evora, Arun Shukla” Fabrication, characterization, and dynamic behavior of polyester/TiO2 nanocomposites” journal of Mater. Sci. Eng A,361 ,pp.358–366,2008.
[9] B. Shivamurthy, Siddaramaiah and M.S. Prabhuswamy” Influence of SiO2 Fillers on Sliding Wear Resistance and Mechanical Properties of Compression Moulded Glass Epoxy Composites” Journal of Minerals & Materials Characterization & Engineering, 8(7), pp. 513-530, 2009.
[10] N.L. McCook, B. Boesl, D.L. Burris and W.G. Sawyer,” Epoxy, ZnO, and PTFE nanocomposite: friction and wear optimization” Tribology Letters Media, Inc,2006 .