The Thirty-Third AAAI Conference on Artificial Intelligence (AAAI-19)
Exploiting Synthetically Generated Data with
Semi-Supervised Learning for Small and Imbalanced Datasets
M. P´erez-Ortiz
Department of Computer Science and Technology, University of Cambridge (UK)15 JJ Thomson Avenue Cambridge CB3 0FD
P. Ti ˇno
School of Computer Science University of Birmingham (UK)
Edgbaston Birmingham B15 2TT [email protected]
R. Mantiuk
Department of Computer Science and Technology, University of Cambridge (UK)15 JJ Thomson Avenue Cambridge CB3 0FD
C. Herv´as-Mart´ınez
Department of Computer Scienceand Numerical Analysis, University of C´ordoba (Spain)
Rabanales Campus C2 building 14071 [email protected]
Abstract
Data augmentation is rapidly gaining attention in machine learning. Synthetic data can be generated by simple transfor-mations or through the data distribution. In the latter case, the main challenge is to estimate the label associated to new synthetic patterns. This paper studies the effect of generat-ing synthetic data by convex combination of patterns and the use of these as unsupervised information in a semi-supervised learning framework with support vector machines, avoiding thus the need to label synthetic examples. We perform ex-periments on a total of 53 binary classification datasets. Our results show that this type of data over-sampling supports the well-known cluster assumption in semi-supervised learn-ing, showing outstanding results for small high-dimensional datasets and imbalanced learning problems.
1
Introduction
One of the current challenges in machine learning is the lack of sufficient data (Forman and Cohen 2004). In this scenario, over-fitting becomes hard to avoid, outliers and noise repre-sent an important issue and the model generally has high variance. Several approaches have been proposed to deal with small datasets, although the work in this matter is still scarce. From all the proposed approaches, synthetic sam-ple generation or data augmentation techniques (Li and Wen 2014; Wong et al. 2016; Yang et al. 2011) have shown com-petitive performance, acting as a regulariser (Hongyi Zhang 2018), preventing over-fiting and improving the robustness of both classifiers and regressors.
The generation of virtual examples is highly nontrivial and has been studied from different perspectives. Proposed methods use prior information (Niyogi, Girosi, and Pog-gio 2002), add noise (Hongyi Zhang 2018), apply simple transformations (Cires¸an et al. 2010; Simard, Steinkraus, and Platt 2003; Krizhevsky, Sutskever, and Hinton 2012; Szegedy et al. 2015) or use data over-sampling approaches (Chawla et al. 2002; P´erez-Ortiz et al. 2016).
Copyright c2019, Association for the Advancement of Artificial Intelligence (www.aaai.org). All rights reserved.
The most straightforward over-sampling approach is to randomly replicate data. However, this can lead to over-fitting (Galar et al. 2012). Another common approach is to do over-sampling taking into account the data distribution. A convex combination of patterns close in the input space has been successfully used for that purpose (Chawla et al. 2002; Hongyi Zhang 2018; P´erez-Ortiz et al. 2016).
In this paper we investigate the benefits and limitations of this simple data augmentation technique coupled with SSL support vector machines. The motivations for such an ap-proach are: i) when performing over-sampling one of the biggest challenges is how to label synthetic examples (po-tentially alleviated when using SSL as no label is assumed) and ii) the hypothesis that over-sampling by convex com-bination of patterns can support the cluster assumption in SSL and help to simplify the classification task. The clus-ter assumption states that high density regions with differ-ent class labels must be separated by a low density region. Given this, two patterns are likely to have the same class la-bel if they can be connected by a path passing through high density regions. The method proposed here is based on the synthetic generation of high density regions as an inductive bias for the classifier. We perform a thorough set of experi-ments over27synthetic and26benchmark binary datasets, showing how this approach helps to mitigate the effect of small, high-dimensional and imbalanced datasets.
2
Methodology
2.1
Data over-sampling by convex combination
Assume that data forms a finite sample X =
{x1, . . . ,xn} ∼ i.i.d. from a distribution F and that
our aim is to construct a finite-sample function of X. Resampling approximates the finite-sample distribution of the function computed over X by the exact distribution of the function overX∗:
X∗={x∗1, . . . ,x∗m} ∼F∗(x1, . . . ,xn), (1)
commonly used in machine learning for data augmentation. In the case of binary classification we also have access to a labellingY = (y1, . . . , yn) ∈ {−1,1}n. When
deal-ing with small or imbalanced datasets, appropriately captur-ing the joint probability function P(X, Y)might be unre-alistic. Because of this, most over-sampling approaches are rather simple. Usually, synthetic patterns are generated by convex combination of two seed patterns belonging to the same class and labelled directly using the same class label (Chawla et al. 2002). The first seed patternxiis chosen
ran-domly, and the second one is chosen as one of itsk-nearest neighbours.kis responsible for avoiding label inconsisten-cies and exploiting the local information of the data, but it can also significantly limit the diversity of synthetic patterns.
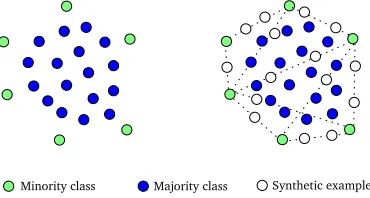
Limitations Figure 1 shows a toy imbalanced dataset where the classes are not convex (left) and some examples of synthetic data patterns that could be created for the minor-ity class in order to balance the class distributions (right). This shows a representation of the main problem encoun-tered when using this over-sampling approach, especially when the parameter ofk-nearest neighbour is not properly optimised: synthetic patterns are created in the region of the majority class and if we naively label these patterns as mi-nority class patterns, we introduce what we denote as a label inconsistency.
Figure 1: Example of an over-sampled imbalanced dataset, in which naively labelling synthetic data as minority class patterns might not be suitable.
Effect on the data distribution We study now the effect of over-sampling by means of a convex combination of pat-terns. At every stepj = 1, . . . , mwe create a synthetic in-stancex∗j by selecting at random two patternsxi,xh:
x∗j =xi+ (xh−xi)·δj= (2)
=δjxh+ (1−δj)xi, δj∈U[0,1], x∗j ∼F∗,
we restrictxh ∈ k-nn(xi), wherek-nnrepresents a
func-tion that returns thek-nearest neighbours of xi. Note that
when over-sampling within a classification frameworkxhis
usually also restricted so thatyh=yi.
For simplicity, let us first assume X ⊆ R and xi and
xh come from the same Normal distribution xi, xh ∼
N(µ, σ2). The definition of the characteristic function of the Normal distribution is:
ϕX(it) =E[eitX] =eiµt−
σ2t2
2 . (3)
The new random variablex∗ = δjxh+ (1−δj)xi will
have the characteristic function:
ϕδjxh+(1−δj)xi(it) =E[e
it(δjxh+(1−δj)xi)] =
=E(eitδjxh)E(eit(1−δj)xi) =
=eiµδjt− σ2δ2jt2
2 eiµ(1−δj)t−
σ2 (1−δj)2t2
2 =
=eiµt−
σ2 (1−2δj+2δ2j)t2
2 , (4)
meaning that the convex combination of these two patterns will follow the distribution: x∗j ∼ N(µ, σ2 ·(1−2δ
j +
2δ2
j)), which for δj ∼ U[0,1] translates into (1−2δj +
2δj2)being within [0.5,1]. This means that the resampled distributionF∗ will most probably have a lower variance, yielding synthetic data more concentrated around the mean. If seed patterns do not come from the same distribution, i.e. xi ∼ N(µi, σi2) and xh ∼ N(µj, σj2), then x∗j ∼
N(δjµh + (1−δj)µi, δj2σ2h+ (1−δj)2σi2). We assume,
however, that given that these patterns are neighbours, they do come from the same distribution.
The density function ofX∗assumingδ∼U[0,1]is:
˜
p(x∗) =R1
0 p(δ)·f(x
∗|µ, σ2(1−2δ+ 2δ2))dδ=
=R01f(x∗|µ, σ2(1−2δ+ 2δ2))dδ=
=√1
2π
R1
0
1
√
σ2(1−2δ+2δ2)·e
−2σ2 (1(x∗ −−2µδ+2)2δ2 )
dδ, (5)
f being the density function of the Normal distribution and the density functionp(δ) = 1. The variance ofX∗can thus be evaluated as:
V[X∗] =R−∞∞ (x∗−µ)2·p(x˜ ∗)·dx∗= (6) =R−∞+∞R01(x∗−µ)2f(x∗|µ, σ2(1−2δ+ 2δ2))dδdx∗ This integral can be numerically evaluated. When doing so we see that the original variance is always reduced by 0.333. Given that over-sampling is applied independently per di-mension, we have:p˜(x∗) =Qd
i=1p˜i(x∗(i)),wherex(i)is the i-th dimension ofx.
Let us now analyse the multivariate case whereX ⊆Rd,
d > 1 andx ∼ N(µ,Σx). For that let us first assume a matrixPfor changing the basis such that z = Px. If we choosePto be a basis formed by the unit eigenvectors ofΣx then it is easy to show thatΣz(i.e. the covariance matrix of
z) is a diagonal matrix formed by the eigenvalues associated to Σx, i.e. the i-th diagonal value λi is the variance of x
along the i-the eigenvectorpiofP. In the rotated axis Eq. 2
can be rewritten as:
z∗j ≡Px∗j =δjPxh+ (1−δj)Pxi, (7)
since P is a linear operator. Convex combinations of pat-terns are thus invariant to rotations of the co-ordinate axis. In this axis, the data coming from our transformed resam-pling distributionz∗ ∼ N(µ,Σ˜z∗)will have the diagonal
covariance matrix:
˜ Σz∗ =
λ1(1−2δj+ 2δj2) . . . 0
0 . . . 0
0 . . . λd(1−2δj+ 2δ2j)
It follows that when over-sampling through convex combi-nations of patterns using the uniform distribution the mean of the data will remain unchanged and so will the eigenvec-tors of the covariance matrix, but the eigenvalues will shrink.
−4 −2 0 2 4 6 8
0 0.01 0.02 0.03 0.04 0.05 0.06 0.07
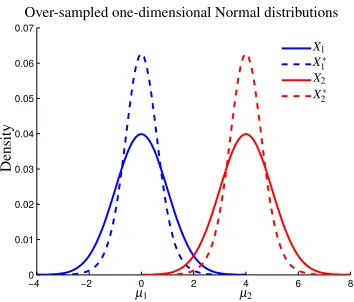
Figure 2: Normal distributions and class dependent over-sampled distributions (dotted line).
Figure 2 shows the result of over-sampling two Normal distributions, where Xi represents the data associated to
classCiin our classification problem. It can be seen that by
performing convex combinations of patterns we change the data distribution. We use this to induce high-density regions that are later used by the SSL algorithm.
2.2
Semi-supervised learning (SSL)
In semi-supervised learning (SSL), we not only have access ton labelled data L = (xi, yi)ni=1 drawn i.i.d. according toP(X, Y), but also tomadditional unlabelled dataU =
{xui}m
i=1drawn i.i.d. according toP(X).
Up to this date, theoretical analysis of SSL fails to pro-vide solid epro-vidence for the benefits of using unlabelled pat-terns in a supervised learning task (Ben-David, Lu, and P´al 2008). Generally, the consensus reached in the literature is that unlabelled data: (i) should be used with care because it has been seen to degrade classifier performance in some cases (e.g. when we assume incorrect data models (Cozman, Cohen, and Cirelo 2003) or there are outliers or samples of unknown classes (Shahshahani and Landgrebe 1994); (ii) is mostly beneficial in the presence of a few labelled samples (Singh, Nowak, and Zhu 2008; Shahshahani and Landgrebe 1994; Cozman, Cohen, and Cirelo 2003); (iii) can help to mitigate the effect of the Hughes phenomenon (i.e. the curse of dimensionality) (Shahshahani and Landgrebe 1994); (iv) can help only if there exists a link between the marginal data distribution and the target function to be learnt and both la-belled and unlala-belled data are generated from the same data distribution (Huang et al. 2006); and finally (v) can improve on the performance of supervised learning when density sets are discernable from unlabelled but not from labelled data (Singh, Nowak, and Zhu 2008).
SSL algorithms can be classified using the following tax-onomy (Chapelle, Sch¨olkopf, and Zien 2010): i) Generative
Figure 3: Over-sampling in the banana dataset. Left figure shows the original dataset, where colours indicate the class. The figures in the middle show the dataset where data is missing at random (MCAR) for one of the classes with per-centages of missing patterns of 50% and 90%. The figures on the right show the over-sampled datasets.
models which estimate the conditional densityP(X|Y); ii) low density separators that maximise the class margin; iii) graph-based models which propagate information through a graph; and finally, iv) algorithms based on a change of representation. The most widely used SSL algorithms be-long to the low density separators or the graph-based mod-els groups. Generative approaches are said to solve a more complex problem than discriminative ones and require more data and the algorithms based on a change of representation do not use all the potential of unlabelled data. Because of this, we focus on low density separators.
2.3
Exploiting the cluster assumption
Labelling synthetically generated patterns without knowl-edge aboutP(X, Y)is a highly nontrivial problem. Instead, we approach this by using SSL, assuming that every syn-thetic pattern belongs to the set of unlabelled data,x∗j ∈ U.
We exploit the cluster assumption by artificially connect-ing labelled patternsxiandxhbelonging to the same class
(yi =yj) through unlabelled samples. Two patternsxiand
xhare said to be connected if there exist a sequence of
rel-atively dense patterns such that the marginal densityP(X) varies smoothly along the sequence of patterns betweenxi
andxh(Singh, Nowak, and Zhu 2008). We have shown in
Section 2.1 that over-sampling two patterns xh and xi by
convex combination makes the density function more com-pact in the region that connects them. This property is main-tained for all random variables that are a linear combination of two patternsxh andxi that come from the same
classifier. An example of over-sampling can be found in Fig-ure 3 where over-sampled patterns are plotted in black.
Our objective is thus to seek a classifiergand a labelling y∗={y∗1, . . . , y∗m} ∈ {−1,+1}mby minimising:
arg min
g,y∗
λ n
n
X
i=1
L(yi·g(xi)) +
λ∗ m
m
X
j=1
L∗(yj∗·g(x∗j)). (9)
where L, L∗ : R → R are loss functions and λ andλ∗ are real-valued parameters which reflect confidence in labels and the cluster assumption respectively. The labels of syn-thetic data are treated as additional optimisation variables, as it is common in SSL (Sindhwani, Keerthi, and Chapelle 2006; Sindhwani and Keerthi 2006). An effective loss func-tion L∗ over an unlabelled pattern x∗j is L∗(g(x∗j)) = min{L(g(x∗j)), L(−g(x∗j))}, which corresponds to making the optimal choice for unknown labely∗j and promotes deci-sion boundaries that pass through low-density regions.
Choice of low density separator The most common ap-proach for constructing a SSL low density separator is to use a maximum margin approach (e.g. using Support Vector Machines, SVMs). However, the formulation in Eq. 9 re-sults in a hard optimisation problem when unlabelled data is abundant. In the semi-supervised SVM classification setting (S3VM), this minimisation problem is solved over both the hyperplane parameters(w, b)and the label vectory∗,
arg min
(w,b),y∗
1 2||w||
2+λ
n
X
i=1
V(yi, oi) +λ∗ m
X
j=1
V(yi∗, o∗j),
(10) whereoi=wTxi+band V is a loss function. This problem
is solved under the class balancing constraint:
1
m
m
X
i=1
max(yi∗,0) =r, (11)
whereris a user-specified ratio of unlabelled data to be as-signed to the positive class. Unlike SVMs, this S3VM for-mulation leads to a non-convex optimization problem, which is solved either by combinatorial or continuous optimisation (Chapelle, Sindhwani, and Keerthi 2008).
The method chosen in this paper is S3VMlight, which has shown promising performance and is robust to changes in the hyperparameters (Chapelle, Sindhwani, and Keerthi 2008). This technique is based on a local combinatorial search guided by a label switching procedure. The vectory∗ is initialised as the labelling given by a SVM trained only on the labelled set. This labelling is restricted to maintain the class ratios previously defined byr. Subsequent steps of the algorithm comprise of switching the labels of two unlabelled patternsx∗j andx∗z(in order to maintain class proportions) that satisfy the following condition:
y∗j = 1, y∗z=−1
V(1, o∗j) +V(−1, o∗z)> V(−1, o∗j) +V(1, o∗z), (12) i.e. the loss after switching these labels is lower.
Concerning the computational complexity of our pro-posal, the main bottleneck is the SSL part as the complexity
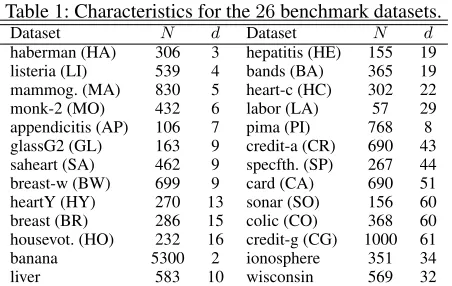
Table 1: Characteristics for the26benchmark datasets. Dataset N d Dataset N d haberman (HA) 306 3 hepatitis (HE) 155 19 listeria (LI) 539 4 bands (BA) 365 19 mammog. (MA) 830 5 heart-c (HC) 302 22 monk-2 (MO) 432 6 labor (LA) 57 29 appendicitis (AP) 106 7 pima (PI) 768 8 glassG2 (GL) 163 9 credit-a (CR) 690 43 saheart (SA) 462 9 specfth. (SP) 267 44 breast-w (BW) 699 9 card (CA) 690 51 heartY (HY) 270 13 sonar (SO) 156 60 breast (BR) 286 15 colic (CO) 368 60 housevot. (HO) 232 16 credit-g (CG) 1000 61 banana 5300 2 ionosphere 351 34 liver 583 10 wisconsin 569 32 All nominal variables are transformed into binary ones
of over-sampling is linear. The complexity of S3VMlightis of the same order as that of a standard SVM. However, it will be trained with more data (i.e. real plus synthetic).
Ensemble of synthetic hypotheses Since the estimation of the resampling distributionF∗is a stochastic process, we also consider the use of different resampling distributions in an ensemble framework. The application is straightforward: each member of the ensemble is formed by a resampling distributionF∗ and a S3VM model(w, b). Final labels are computed by majority voting.
3
Experimental results
In our experiments we try to answer the following questions:
1. What are the largest contributing factors to the degrada-tion in performance when dealing with small datasets?
2. Does over-sampling prevent the need for collecting fur-ther data in small and imbalanced scenarios?
3. How does our approach of using SSL and not labelling data compares to other approaches in the literature?
4. In the context of classification, is it class dependent over-sampling better than class-independent?
Because of space restrictions, we only show mean test re-sults and rankings, but all rere-sults can be accessed online1.
3.1
Methodologies tested
In order to address the difference between using real vs. syn-thetic data, we compare standard supervised SVMs (with no over-sampling or data missing) to different approaches with data Missing Completely At Random (MCAR). Note that this comparison is not strictly fair, but it provides a useful baseline performance to evaluate our over-sampling approaches. Thus, our objective is not to surpass the per-formance achieved with real data by the use of synthetic one, but rather to reach a similar performance. We also com-pare our proposed approach to: 1) previous over-sampling approaches that use naive labelling (Chawla et al. 2002; P´erez-Ortiz et al. 2016) and 2) transductive graph-based SSL, as another alternative for labelling synthetic data. Within our proposed methods we have different approaches: class-dependent and independent sampling (i.e. over-sampling classes separately or not) and an ensemble of51 S3VM models using unlabelled synthetically generated pat-terns. Note that the optimisation procedure of SVM and S3VM is different, which may influence the results (S3VM is said to be more prone to reach local optima). Because of this, we include another approach as a baseline: S3VM model that reintroduces the real data removed at random in the unsupervised set. The main purpose here is to compare over-sampled vs. real data within the S3VM framework.
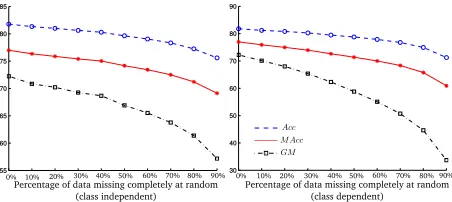
Figure 4: Mean test performance across all benchmark datasets for S-MCAR. In the left plot patterns are removed from both classes, whereas in the right plot patterns are re-moved only for the minority class.
3.2
Experimental setup
A stratified10-fold technique has been performed to divide all datasets. Each experiment is repeated 3 times in order to obtain robust results (except for deterministic methods). The results are taken as mean and standard deviation of the selected measures. The same seed is used for random num-ber generation, meaning that the same patterns are removed from the dataset and created by over-sampling. The cost pa-rameter of SVM-based methods was selected within the val-ues{10−1,100,101} by means of a nested 3-fold method with the training set. The kernel parameter has been cross-validated within the values {10−1,100,101} for the SVM
1
https://doi.org/10.17863/CAM.32312
Figure 5: Examples of synthetic datasets generated. For the plot on the right only the first three dimensions are shown.
based methods. For all the methods using large-scale semi-supervised SVMs (Sindhwani and Keerthi 2006), the reg-ularisation parameters wanduwere optimised within the values{10−1,100,101} (also by means of a nested3-fold cross-validation). For easing the comparisons, the number of synthetically generated patterns is set to the same removed initially from the dataset.k = 5nearest neighbours were evaluated to generate synthetic samples. The Euclidean dis-tance has been used for all the disdis-tance computations.
The parameter used for the over-sampling method in (P´erez-Ortiz et al. 2016) to control the dimensionality of the feature space has been cross-validated within the values
{0.25, 0.5, 0.75}. The kernel width parameter associated to transductive methods (to construct the graph) has been set to the same value of the SVM kernel used. The rest of parame-ters have been set to default values.
There are several minor modifications of these algorithms when using them for either small or imbalanced datasets. As stated before, in the case of imbalanced data, we introduce a new parameter for S3VM methods, which controls the ratio of patterns assigned to the minority class. This class balanc-ing parameter has been fixed to the initial class distribution (in the first and second experiments where the data is bal-anced) and cross-validated within the values {0.5,0.7,0.9}
for the imbalanced datasets (where all the synthetically gen-erated patterns are supposed to belong to the minority class, but where we need to allow a certain amount of errors, to fix label inconsistencies). Moreover, for the case of graph-based algorithms, several issues have been noticed in imbalanced domains (Zheng and Skillicorn 2016). To prevent this, we also use a class mass normalisation procedure to adjust the class distribution so that it matches the priors (Zhu, Ghahra-mani, and Lafferty 2003).
3.3
Evaluation metrics
The results have been reported in terms of two metrics:
1. Accuracy (Acc). However, given that for imbalanced cases this metric is not be the best option, we use the mean of the sensitivities per class (referred to asM Acc).
2. The Geometric Mean of the sensitivities (GM =
p
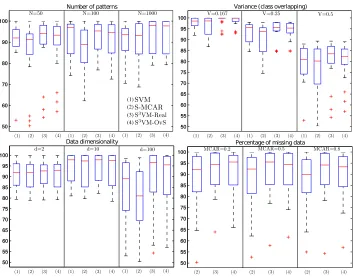
Figure 6: Box-plot of the mean test accuracy performance across different factors for the synthetic datasets (first experiment).
The measure for the parameter selection wasGM given its robustness (Kubat and Matwin 1997).
3.4
Results
Firstly, we test the influence of the number of patterns re-moved at random. Figure 4 shows the mean degradation in test performance for S-MCAR when changing the number of patterns removed from the benchmark datasets. As can be seen, all metrics experience a relatively large degradation.
First experiment: Synthetically generated datasets 27 synthetic datasets generated with (S´anchez-Monedero et al. 2013) are used. All of these datasets represent binary and perfectly balanced classification tasks, in which the data has been generated using a Normal distribution changing dif-ferent parameters: 1) dimensionality of the input space (d, which is set to 2, 10 and 100 dimensions), 2) the number of patterns (N, set to 50, 100 and 1000) and 3) the variance of the data (V, controlling the overlapping between the classes and set to 0.167, 0.25 and 0.5). All combinations of these parameters have been explored. All the classes have been designed to be bi-modal. Figure 5 shows two examples of the synthetic datasets generated. We test three ratios of pat-terns removed at random (MCAR):0.2,0.5and0.8.
For this experiment, we use four approaches: SVM (with the original dataset), S-MCAR (MCAR, no over-sampling), S3VM with real unlabelled data (S3VM-Real, for which the data that we remove is included again as unlabelled in the model) and our proposal using class-dependent over-sampling (S3VM-OvS). Note that the comparison against SVM and S3VM-Real is only for comparison purposes and
not strictly fair, since the classifier has access to all the real data, which is not the case for S-MCAR and S3VM-OvS.
Table 2: Mean ranking results for all the methods considered in the small sample size experiment (second experiment). MCAR (0.2) MCAR (0.5) MCAR (0.8)
Ranking M Acc GM M Acc GM M Acc GM
SVM 4.62 4.46 4.12 4.12 2.96 3.31
S-MCAR 8.00 8.04 6.81 6.77 6.81 6.62
SVM+OvS 6.27 6.62 5.85 5.92 5.85 5.69
SVM+kOvS 7.06 7.02 7.19 7.08 6.54 6.73
Transductive graph-based approaches
Real unlab. data 9.52 9.61 10.04 10.00 9.98 9.94
Class dep. OvS 8.67 8.85 9.27 9.35 9.60 9.60
Class indep. OvS 8.37 8.35 9.35 9.69 9.69 9.88
S3VM approaches (proposed)
Real unlab. data 3.47 3.35 3.15 3.15 3.23 3.04
Class dep. OvS 3.21 3.27 3.54 3.42 4.19 4.27
Class indep. OvS 3.58 3.38 4.00 3.81 3.88 3.77
Ensemble 3.15 3.06 2.69 2.69 3.27 3.15
high dimensional datasets independently of their size and class overlapping, and that its performance is stable with re-spect to the percentage of data that we removed (last factor).
Second experiment: Small sample size For this exper-iment, we artificially reduce the size of the benchmark datasets (again testing a proportion of0.2,0.5 and0.8 re-duction). Because of the amount of results we only pro-vide the test mean ranking (the lower the better) in Table 2. It can be seen that the test rejects the null-hypothesis that all of the algorithms perform similarly in mean ranking for all cases. As mentioned before, here, we also include two over-sampling approaches from the literature: SVM+OvS (Chawla et al. 2002) and SVM+kOvS (P´erez-Ortiz et al. 2016) and test transductive approaches to label synthetic data. Again, we compare several strategies: class-dependent and independent over-sampling, the introduction of real un-labelled data in the S3VM model for comparison purposes and an ensemble. Note that both SVM and methods based on real unlab. data are unrealistic and only used as a base-line. Several conclusions can be drawn: Comparing all over-sampling approaches and S-MCAR it can be seen that a con-vex combination of patterns can be successfully used to gen-erate synthetic data. The use of part of the real data as un-labelled also improves the result to a reasonable extent: it is better than standard data over-sampling and if the number of data is not extremely low even better than use the original dataset, which may indicate that there might be some noise in the labels. The combination of over-sampling and semi-supervised learning approaches is promising and can be ap-plied within each class or using all data independently of their labels, reaching in most cases the baseline performance of the use of the entire dataset. Observing individual results we noticed that for the smallest datasets it is better to use all patterns for over-sampling, while for bigger datasets the best approach is to do over-sampling dependent on the class. In general, transductive graph-based approaches do not re-port acceptable results, maybe because they highly depend on the design of a graph or because these techniques precise a larger amount of data. Finally, the introduction of diversity in an ensemble by the use of a stochastic convex
combina-tion of patterns is very promising, improving in most cases the results achieved with the original complete dataset.
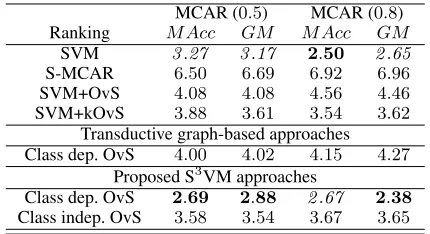
Table 3: Mean test ranking results for all the methods con-sidered in the imbalanced experiment (third experiment).
MCAR (0.5) MCAR (0.8) Ranking M Acc GM M Acc GM
SVM 3.27 3.17 2.50 2.65 S-MCAR 6.50 6.69 6.92 6.96
SVM+OvS 4.08 4.08 4.56 4.46
SVM+kOvS 3.88 3.61 3.54 3.62
Transductive graph-based approaches Class dep. OvS 4.00 4.02 4.15 4.27
Proposed S3VM approaches
Class dep. OvS 2.69 2.88 2.67 2.38
Class indep. OvS 3.58 3.54 3.67 3.65
Third experiment: Imbalanced samples We also study the effect of our proposal in imbalanced classification se-tups. For this, we artificially induce this imbalance in our data by removing a percentage of patterns for the minor-ity class. In this case, we test a subset of the methods that we used in the previous experiment (results shown in Ta-ble 3). Again, we can see that SMOTE (SVM+OvS) can be improved, either by optimising the patterns to generate (SVM+kOvS) or the labels of the synthetic patterns (pro-posed approaches). It can also be seen that it is better to over-sample only the minority class (i.e. class dependent).
4
Conclusions
to be necessarily labelled; and 3) the introduction of syn-thetic data as unsupervised knowledge can help to improve the classification in small, high-dimensional or imbalanced scenarios by acting as an inductive bias for the classifier.
Future work comprises testing such approach in a re-gression setting and with other semi-supervised learning ap-proaches (e.g. the use of synthetic imaging data with autoen-coders or deep belief networks).
5
Acknowledgments
This work was supported by the project TIN2017-85887-C2-1-P of the Spanish Ministry of Economy and Competi-tiveness (MINECO) and FEDER funds (EU). PT was sup-ported by the European Commission Horizon 2020 Inno-vative Training Network SUNDIAL (SUrvey Network for Deep Imaging Analysis and Learning), Project ID: 721463.
References
Ben-David, S.; Lu, T.; and P´al, D. 2008. D.: Does unlabeled data provably help? worst-case analysis of the sample complex-ity of semi-supervised learning. InIn: 21st Annual Conference on Learning Theory.
Chapelle, O.; Sch¨olkopf, B.; and Zien, A. 2010. Semi-Supervised Learning. The MIT Press, 1st edition.
Chapelle, O.; Sindhwani, V.; and Keerthi, S. S. 2008. Optimization techniques for semi-supervised support vector machines. Journal of Machine Learning Research9:203–233.
Chawla, N. V.; Bowyer, K. W.; Hall, L. O.; and Kegelmeyer, W. P. 2002. Smote: Synthetic minority over-sampling technique.Journal of Artificial Intelligence Research16:321–357.
Cires¸an, D. C.; Meier, U.; Gambardella, L. M.; and Schmidhuber, J. 2010. Deep, big, simple neural nets for handwritten digit recog-nition.Neural Comput.22(12):3207–3220.
Cortes, C., and Vapnik, V. 1995. Support-vector networks. Ma-chine Learning20(3):273–297.
Cozman, F. G.; Cohen, I.; and Cirelo, M. C. 2003. Semi-supervised learning of mixture models. InProceedings of the Twentieth In-ternational Conference on InIn-ternational Conference on Machine Learning, 99–106.
Forman, G., and Cohen, I. 2004.Learning from Little: Comparison of Classifiers Given Little Training. Berlin, Heidelberg: Springer Berlin Heidelberg. 161–172.
Galar, M.; Fern´andez, A.; Barrenechea, E.; Bustince, H.; and Her-rera, F. 2012. A review on ensembles for the class imbalance problem: Bagging-, boosting-, and hybrid-based approaches.IEEE Transactions on Systems, Man, and Cybernetics, Part C: Applica-tions and Reviews42(4):463–484.
Zhang, H.; Cisse, M.; Dauphin, Y. N.; and Lopez-Paz, D. 2018. mixup: Beyond empirical risk minimization.International Confer-ence on Learning Representations.
Huang, J.; Smola, A. J.; Gretton, A.; Borgwardt, K. M.; and Scholkopf, B. 2006. Correcting sample selection bias by unla-beled data. InProceedings of the 19th International Conference on Neural Information Processing Systems, 601–608. Cambridge, MA, USA: MIT Press.
Krizhevsky, A.; Sutskever, I.; and Hinton, G. E. 2012. Imagenet classification with deep convolutional neural networks. In Pereira, F.; Burges, C. J. C.; Bottou, L.; and Weinberger, K. Q., eds., Ad-vances in Neural Information Processing Systems 25. Curran As-sociates, Inc. 1097–1105.
Kubat, M., and Matwin, S. 1997. Addressing the curse of im-balanced training sets: One-sided selection. InProceedings of the International Conference on Machine Learning, 179–186. Li, D.-C., and Wen, I.-H. 2014. A genetic algorithm-based virtual sample generation technique to improve small data set learning.
Neurocomputing143:222–230.
Lichman, M. 2013. UCI machine learning repository.
Niyogi, P.; Girosi, F.; and Poggio, T. 2002. Incorporating prior information in machine learning by creating virtual examples. Pro-ceedings of the IEEE86(11):2196–2209.
P´erez-Ortiz, M.; Guti´errez, P. A.; Tino, P.; and Herv´as-Mart´ınez, C. 2016. Oversampling the minority class in the feature space.
IEEE Transactions on Neural Networks and Learning Systems
27(9):1947–1961.
S´anchez-Monedero, J.; Guti´errez, P. A.; P´erez-Ortiz, M.; and Herv´as-Mart´ınez, C. 2013. An n-spheres based synthetic data gen-erator for supervised classification. InAdvances in Computational Intelligence, 613–621. Berlin, Heidelberg: Springer Berlin Heidel-berg.
Shahshahani, B. M., and Landgrebe, D. A. 1994. The effect of unlabeled samples in reducing the small sample size problem and mitigating the hughes phenomenon. IEEE Transactions on Geo-science and Remote Sensing32(5):1087–1095.
Simard, P. Y.; Steinkraus, D.; and Platt, J. C. 2003. Best prac-tices for convolutional neural networks applied to visual document analysis. InProceedings of the Seventh International Conference on Document Analysis and Recognition - Volume 2, ICDAR ’03, 958–. Washington, DC, USA: IEEE Computer Society.
Sindhwani, V., and Keerthi, S. S. 2006. Large scale semi-supervised linear svms. InProceedings of the 29th annual inter-national ACM SIGIR conference on Research and development in information retrieval, 477–484. ACM.
Sindhwani, V.; Keerthi, S. S.; and Chapelle, O. 2006. Deterministic annealing for semi-supervised kernel machines. InProceedings of the 23rd international conference on Machine learning, 841–848. ACM.
Singh, A.; Nowak, R. D.; and Zhu, X. 2008. Unlabeled data: Now it helps, now it doesn’t. In Koller, D.; Schuurmans, D.; Bengio, Y.; and Bottou, L., eds.,NIPS, 1513–1520. Curran Associates, Inc. Szegedy, C.; Liu, W.; Jia, Y.; Sermanet, P.; Reed, S.; Anguelov, D.; Erhan, D.; Vanhoucke, V.; and Rabinovich, A. 2015. Going deeper with convolutions. In2015 IEEE Conference on Computer Vision and Pattern Recognition (CVPR), 1–9.
Wong, S. C.; Gatt, A.; Stamatescu, V.; and McDonnell, M. D. 2016. Understanding data augmentation for classification: when to warp?
CoRRabs/1609.08764.
Yang, J.; Yu, X.; Xie, Z.-Q.; and Zhang, J.-P. 2011. A novel virtual sample generation method based on gaussian distribution.
Knowledge-Based Systems24(6):740 – 748.
Zheng, Q., and Skillicorn, D. 2016. Spectral graph-based semi-supervised learning for imbalanced classes. 2016 IEEE/ACM In-ternational Conference on Advances in Social Networks Analysis and Mining (ASONAM)960–967.