Resource-allocation by histogram and time
scale method with PERT and CPM
1
Sujata Bala,
2Dr. Sahdeo Mahto
1Research scholar, department of mathematic Ranchi university, Ranchi 2Asso. prof. University department of mathematics Ranchi university, Ranchi
Abstract: Several construction activities can be managed to achieve the profit within limited resources and time. A resource such men power, material, machines, shopping facilities, finance etc. That is required for completing various activities in a project. Thus project management techniques are useful in scheduling and co-ordinating the various resources by project management can be used to resolve to resource conflicts and also useful in minimising the project duration with in limited availability of resources to make the project profitable. The aim of this paper has to analyze the available resources, then allocating them with levelling and smoothing of the resources by histogram and time scale activity table within certain duration in project.
Key-word:Resource-allocation, resource scheduling, resource levelling, histogram, time-scale.
Introduction : Resource allocations is the assignment of available resources to various uses in the context of an entire economy, resources can be allocated by various means such as market or central planning , i,e resource allocation is the process of assigning and scheduling available resources in the most effective and economical manner.
Project will always need resources and resources are scarce, the task then lies with the project manager to determine the proper timing of resources with in project schedule.
While developing the PERT and CPM networks, we have generally assumed that sufficient resources are available to perform the various activities. In every production , resources are always limited and the management always want to assign these various activities in such a manner, that there best possible utilization of available resources . At a certain time the demand on a particular resources is the cumulative demand of that resources on all the activities being performed at that time. Proceeding according to the develop plan, the demand on a certain type of resources may fluctuate from very high at one time to a very low at the other . If it is a material or unskilled labour which has to be procured from time to time, fluctuation in demand will not much affect the cost of project , but if it is some personal who cannot be hired and fixed during the project or machines which are to be hired for the entire duration of the project, the fluctuation in their demand will affect the cost of total project due to high idle times. In order to reduce the idle time, the activities on non-critical paths are shifted by making use of the floats and an alternative schedule is generated comparing the more important resources with the objects of smoothing the demand on resources. PERT and CPM techniques provide us valuable guidelines for most systematic and economic allocation of resources.
History; project management has been practiced for the thousand of years since the Egyptian era, however it has been about half a century ago that organisation start applying system project management tools to complex projects. The origin of the modern project technique concept between 1900s and 1950s.
Before 1958 the technologies telegraph, telephone’ telescope, the first computer, automobiles the first database was discovered by using parametric cost estimation, PERT/CPM, Gantt chart, montocarlo simulation systematic application etc .this tools were used the complete the project during this period like; Intercontinental railroad, Hoover dam, Polari’s, Manhattan project, panama canal, etc.
In 1980-1994 the invention of PC wireless in building network, first internet browser(MOSAIC) which was based on manufacturing resource planning, risk management ,Matrix organization, PM software for PC. The project of this duration are being777, space shuttle challenger, the English France channel project etc.
From 1995 to current we use the technology of Internet, Wi-Fi ,Bluetooth, 2G. 3G 4G,( 5G is upcoming). the management science is critical chain enterprise resource planning, the technology PMBOK (PMI)project being Indium, Y2K,( digital India is processing)[2]
Resource levelling and resource smoothing
A short coming of most scheduling procedure is that they (any projects) don’t address the issue of resources availability and utilization. The scheduling procedure tends to focus on time and physical resources. In project scheduling the relationship between time use and resources use are following;
Limited time [3]: The project must be finished by a certain time, using as few resources as possible.
Limited resources [3]: the project must be finished as soon as possible but without exceeding some specific level of resources usage.
The solution of such type of complex problem is known a resource scheduling which aims at bringing down the costs and at the same time reduces pressure on the limited resources in conflicting demand.
Resources scheduling situation may be of two types of constraints[1]:
(a) The constraints may be the total project duration which calls for the demand on resources in uniform as possible this is known as resource smoothing, it aims at maintaining the total project duration at the minimum level by shifting resources from the activities having floats so that a uniform demand on resource is achieved.
The criterion for smoothing is, minimum of the schedule Where is total requirement.(man power)
And is average of
(b) The second type of constraints may be on the availability of certain resources. Here the project duration is not treated as an invariant but demand on certain specific resources should not go beyond the possible limit. This is called resource levelling and which aims at sequencing the activities criticality subject to the constraint of availability of resources and also minimum period of the project is predetermine accordingly [1].
Step for resource smoothing:
Resource levelling aims to minimize the period by period variations in resource loading by shifting task within their slack allowance. The step of resource smoothing are[3]:
(1) Draw the network diagram for project activity.
(2) Calculate the Est. (earliest starting time) and Fst.(finish starting time) and determine the critical path. (3) Create a table showing the resources required for each activity, duration and total float available. (4) For resource smoothing is to determine the maximum requirement.
(5) Then draw the time schedule version of the network, and assign the resource requirements to activities. (6) Below the time scaled network the cumulative resource requirements for each time unit are plotted. (7) Plotting the resource histogram on the basis of early start times of the activities. This resource histogram
An illustrative example
Q. Activity times in days and the man power required for each activity is given in table as follows:
Activity Time(Days) No. Of men
1-2 2 3
1-3 4 2
1-4 5 4
2-5 6 5
3-5 6 3
4-6 7 4
5-6 5 2
Determine the critical path and the maximum duration of completing the project. If any man can work on any job, schedule for the project length to be minimised with in resource and technological constraints.
Solution:
Step 1 draw the network diagram from the given above problem, and find critical path.
The earliest and lastest completion time of each activity are indicated along the node in the Fig.
Network diagram of given problem
Critical path is 1
Time scale activity table
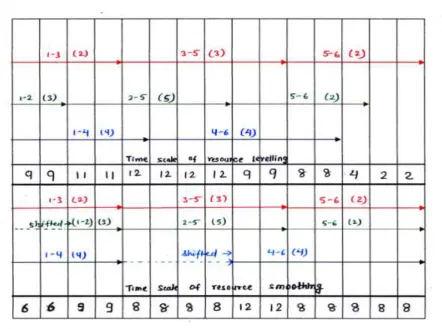
Fig:2 Time scale activity table for resource levelling and smoothing
The time scale variation of the network showing the critical path along the straight line (red line)is shown in fig. of table. The critical path is 1
To determine the minimum number of worker required to complete the project, the critical activities are shedule first. Next we draw non critical activity 1 (using green line in the fig.) and 1 (using blue line in the fig.). then we find the summing of critical path and required person and project duration. From the table the data of resource levelling shows that first two days required 9 persons, then 11 men for 2 days after then 12 men for 4 days, 9 men for 2 days, 8 person for 2 days, 4 men for 1 day and 2 men for 2 days for completing the total project.
Hence we observe that the required maximum men power is 12 for 4 days. From this data we draw the Histogram for resource levelling.
To smoothen the load ,the activities depending upon the floats . now since the path 1 has a float of 2 days. This demand has to be smoothed for this we shifted the activity 1 for two days from origin to right as show in the above table (green line and shiftted line be shown as dotted line). Next for the non-critical path 1 . We start from the origin ,activity goes 1 in 4 days after then we shift the activity for 4 days in right side and complete the activity in 1 in 15 days.
Step:3 draw histogram for resource levelling from above time scale table
Fig:3 Histogram for resource levelling from the time scale activity table
No. of above arrow indicate the crew size (the resource requirement) and the numbers below the arrow
indicate the total project duration in Days.
From the histogram we conclude that, the total work duration is 15 Days.
The maximum manpower is 12 for 4 days.
Step4: calculate the value of for available resource levelling.
Refer to fig.-3
Days (i) 1-2 2-4 4-8 8-10 10-12 12-13 13-15
Total no. Of days (2) (2) (4) (2) (2) (1) (2)
Total no. Of men reqd. (di) 9 11 12 9 8 4 2
Here =2*9+2*11+4*12+2*9+2*8+1*4+2*2=130
=2* +4* +2* +2* +1* +2* =1294
- ) where .and n=15
=1294
=167.3333 0 2 4 6 8 10 12 14 Series 1 Series 2 Series 3 Series 4 Series 5 Series 6 Series 7 Series 8 Series 9 Series 10 Series 11 Series 12 Series 13 Series 14 Series 15 to tal m e n p o we r total Days
Step 5:after calculating the value of , and shifting the activities next we draw the histogram for the resource smoothing.
Fig 4 Histogram for resource smoothing from the time scale activity table
Hence we observe that after the smoothing the maximum manpower is 12 for 2 Days.
Step 6 : calculate the value of after smoothing of resources.
Days 1-2 2-4 4-8 8-10 10-15
Total no. Of days (2) (2) (4) (2) (5)
Total no. Of men reqd. (di) 6 9 8 12 8
Here =2*6+2*9+4*8+2*12+5*8=126
=2* +2 *+4* +2* +5* =1098
= - ) where .and n=15
=1098 - - =39.6<167.33
Step6: comparing the value of all from levelling and smoothing of the histogram, And if we get the minimum value from smoothing compare to levelling of the resources, then we get the result .
Hence after the resource smoothing the activities we have,
Maximum workforce required =12 men
Minimum work force required =6 men
Total work days= 15 Days. 0 2 4 6 8 10 12 14 Series 1 Series 2 Series 3 Series 4 Series 5 Series 6 Series 7 Series 8 Series 9 Series 10 Series 11 Series 12 Series 13 Series 14 Series 15 to tal p e rson total days
Conclusion: Resource smoothing involves rescheduling of the activities of a project, in such a way us to utilize the resources in a fairly uniform manner, and achieving a minimum project duration time. Hence from this example when we levelling the project the maximum required manpower is 12 for 4 Days. And after scheduling the resources the maximum manpower is12 for only 2 days. i,e Resource smoothing maintaining the total project duration at the minimum level, by shifting resources from the activities having floats so that a
uniform demand on resources is achieved.
References:
[1] https://www.abebooks.com/book-search/title/operations- research/author/verma-p/operation research by A.P. Verma
[2] 1993 Alan stretton- A short history of modern project management. https://www.pmworldtoday.net second edition October 2007(vol. IX, issue X.
[3] teedinguru.com/blog/2014/12/.../operation-research-by-kanti-swarup
[4] "6.6.2.4 Resource Optimization Techniques". A Guide to the Project Management Body of Knowledge (PMBOK® Guide) (5th ed.). Project Management Institute. 2013. p. 179. ISBN 978-1-935589-67-9.
[5] SimulTrain Resource Leveling https://www.youtube.com/watch?v=xcOD_ViGJYg
[6] Triant G. Flouris; Dennis Lock (2009). Managing Aviation Projects from Concept to Completion. Ashgate Publishing, Ltd. pp. 207– . ISBN 978-0-7546-7615-7.
[7] "Availability Planning". CEITON. Retrieved 2014-06-04.
[8] Project management with CPM and PERT,2/e, van Nostrand, new York (1970) [9] https://www.ijsr.net/archive/v4i5/SUB154213.pdf by R. joshi.
[10] https://www.apm.org.uk/resources/...resource/difference-between-resource-smoothing... [11] https://en.wikipedia.org/wiki/Resource_leveling
[12] Samuel90 (2013-01-250 “RESOURCE ALLOCATION”.slideshare.net.
[13] N. B. Rathod and K. K Kanani, k-cordiality of Path and Cycle Related Graphs. Int. J. of Math. and Comp. Appl. Res., 5(3), 81-92(2015).
[14] J. Gross and J. Yellen, Handbook of graph theory, CRC Press(2004).