138
Copyright © 2011-15. Vandana Publications. All Rights Reserved.
Volume-5, Issue-3, June-2015
International Journal of Engineering and Management Research
Page Number: 138-146
Improvement of BRT Network for Visakhapatnam Using Bead Tool
T. Kiran Kumar1, J. Vikranth2, Mkssk Chaitanya3 1
Department of Civil Engineering, INDIA
ABSTRACT
BRT can be defined as “a high-quality bus-based transit system that delivers fast, comfortable, and cost-effective urban mobility through the provision of segregated right-of-way infrastructure, rapid and frequent operations, and excellence in customer service”. Bus Rapid Transit (BRT) systems are an increasingly popular public transport option internationally.
The improvement of BRT network is a difficult task which does not lend itself readily to give instant solutions available in traditional techniques. So it gives the importance of devising faster methods to obtain solutions to the network improvement. The aim of this study is to improve the existing BRT network in Visakhapatnam using BEAD Tool, the state-of-the-art planning and simultaneously assessment tool which is a comprehensive, flexible software system for transportation planning, travel demand modelling and GIS-based network data management. It helps the transportation planners to improve the existing bus network of a city.
Keywords---- BRTS Network, Evaluation, BEAD Tool, Network Modelling.
I.
INTRODUCTION
Cities are not only the places where people live, they are the places, where people interact with others, feel a connection and develop their collective goals (economic prosperity, social cohesion, and environmental sustainability). It’s not the technology that develops the prosperity of a city (or country) but the way the technology is being used. The problem of transportation is different from all those experienced by any city. Whenever a city becomes richer, its education, facilities, health etc. will become better except transportation, which becomes worse. The main problems that relate to transportation are congestion and pollution. These can be overcome by enhancing the effective implementation of Public Transportation.
In large urban areas, there has been a growing recognition that public transportation is an important part of solutions to traffic congestion. For a public transit system to be a viable alternative to travellers, it must be able to provide its users with reasonable travel time and convenience. Travel time and convenience are largely determined by the types of services provided and available budget. However, given a budget, the configuration of a transit network (TN), which includes the network layout, service frequencies, and schedules, may also have significant effects on transit service level and quality. The proper design of these network components contributes to both reducing user cost and providing high level of transit services, with a positive impact on the ridership.
From the users’ perspective, any system should meet the demand by providing cheap and direct service to passengers. Criteria for using public transport can also include vehicle and transfer terminal comfort, regularity, and service coverage and frequency level. From the operator’s perspective on the opposite, the objective is for the system to make as much profit as possible. It is the main challenge in transit planning to find equilibrium between these conflicting objectives. The transit network design problem (TNDP) consisting optimizing the main features of a transit network (line routes, frequencies, timetables, etc.) so as to optimize the value of an objective function, taking user behaviour and several constraints into account. Optimizing transit network includes route network design, vehicle headway, and timetable assignment.
139
Copyright © 2011-15. Vandana Publications. All Rights Reserved.
only bus passengers, pedestrians and non-motorizedtraffic users but also personal motor vehicle users have been suffering by this rapid increase in vehicular growth. The typical conclusion to all these set of problems is to develop a set of measures needed to achieve more efficient transportation system which include improvements in public transportation systems, encouragement of non-motorized traffic, and co-ordination of land use with transportation systems. There is an urgent need to study the basic operational and performance characteristics of various public transit systems and strengthen the mass transportation by different systems and to improve their efficiency and utility. Once the importance of Public Transportation is well understood, the best alternatives should be selected for better enhancement of travel conditions for the public. In order to meet the above requirements, it is important to maintain and enhance public transit service that is accessible, reliable, convenient and affordable in Indian cities. One of such public transit systems is Bus Rapid Transit System.
1.1 BUS RAPID TRANSIT SYSTEM (BRTS)
Bus Rapid Transit (BRT) is “a rubber-tired form of rapid transit that combines stations, vehicles, services, running ways and ITS elements into an integrated system with a strong image and identity. BRT is a high-quality bus-based transit system that delivers fast, comfortable, and cost-effective urban mobility through the provision of segregated right-of-way infrastructure, rapid and frequent operations, proving excellent in customer service. BRT is designed to address the sources of delay of traditional bus service and to be an attractive service to passengers. BRT systems can often be implemented quickly and incrementally. BRT systems are an increasingly popular public transport option internationally.
Bus Rapid Transit (BRT) systems are being embraced world-wide as an increasingly popular public transport development option. They provide rail-like quality for bus services for a fraction of the cost of fixed rail. They apply rail-like infrastructure and operations to bus systems with offerings that can include high service levels, segregated right of way, station-like platforms, high quality amenities and intelligent transport systems. For a given distance of dedicated running way, BRT is generally less costly to build than rail transit. Though Light rail Transit (LRT) can also be opted as part of public transportation, as seen by economical and financial view, BRT stands as a much better option for any transport planner. Various studies all over the world have shown that implementation of Light rail costs around 3-4 times that of BRTS. Also, even to develop a light rail transit, an effective bus-feeder system should be well integrated. Bus rapid transit (BRT) has gained popularity as a cost-effective alternative to urban rail investments.
The history of the BRT system started with giving buses separate lanes on highways. In 1966, the first dedicated bus-way was constructed in St. Louis,
United States of America (USA). The first promising city-wide project of BRT system was the in, Brazil, which entered service in 1974, which features 65 km of exclusive bus-ways and 340 km of feeder service buses. This inspired many similar systems around Brazil and the world, such a in November 2013, more than 166 cities have implemented BRT, accounting for 4,336 km (2,694 mi) of BRT lanes. It is estimated that about 27 million passengers use BRT worldwide everyday, of which about 17 million are in Globally, Jakarta (Indonesia) has the longest BRT network in the world with 172 km of exclusive network. More and more cities are turning to bus rapid transit (BRT) as a way of cost-effectively expanding public transit services to relieve traffic congestion, reduce carbon emissions, and increase mobility options for the poor. BRT has gained increasing popularity worldwide. Some of the most advanced and widely heralded BRT services today are found in Latin America, such as Curitiba, Brazil, Bogota and Cali, Columbia, Santiago, Chile, Lima and Peru. The success of BRT in these cities stems, to a large degree, from the presence of dedicated lanes, which offer significant speed advantages relative to more traditional mixed-traffic services.
1.2 COMPONENTS OF BRTS
BRTS has some components which are unique and different from traditional system. They can be described clearly as:
(a) Running ways:
BRT vehicles operate primarily in fast and easily identifiable exclusive at-grade transit ways, grade separated transit ways, managed lanes, tunnels, and in dedicated bus lanes.
(b) Stations:
BRT stations, ranging from enhanced shelters to large transit centres, are attractive and easily accessible. They are also conveniently located and integrated into the city network.
(c) Vehicles:
Stylized and specialized buses can operate along BRT corridors, with emphasis on comfort, aesthetic enhancements, easy access, passenger circulations and environmentally friendly propulsion. (d) Intelligent Transportation Systems:
BRT incorporates ITS technologies such as transit signal priority, real time passenger information and advanced communication, digital display systems for faster and moreconvenient trips.
(e) Fare collection:
140
Copyright © 2011-15. Vandana Publications. All Rights Reserved.
(f) Service and operations plan:The design of the service and operations plan for BRT service affects how a passenger finds value in and perceives the service. BRT service needs to be frequent, direct, reliable, comfortable, operationally efficient and rapid.
1.3 FEATURES OF BRTS
•
Bus Lanes
:
A lane on an urban arterial or city street is reserved for the exclusive or near exclusive use of buses.•
Bus streets and bus ways
:
A bus street or transit mall can be created in an urban center by dedicating all lanes of a city street to the exclusive use of buses.•
Bus signal preference
:
Preferential treatment of buses at intersections can involve the extension of green time or actuation of the green light at signalized intersections upon detection of an approaching bus.•
Traffic management improvements
:
Low-cost infrastructure elements that can increase the speed and reliability of bus service include bus turnouts, bus boarding islands, and curb realignments.
•
Faster boarding
:
Conventional on board collection of fares slows the boarding process, particularly when a variety of fares is collected for different destinations and classes of passengers. Prepaid “smart” cards providing for automated fare collection would speed fare transactions, but would require that boarding remain restricted to the front door of the bus. •Level boarding
:
Changes in bus or platformdesign that could provide for level boarding through the use of low-floor buses, raised platforms or some combination thereof could make boarding both faster and easier for all passengers.
•
Integration of transit development
with land use policy
:
Bus Rapid Transit can be more effective when integrated within a broader planning framework encompassing land use policies, zoning regulations, economic and community development.•
Improved facilities and amenities
:
The operational and travel time benefits resulting from the separation of buses from general-purpose traffic can be augmented with improved amenities such as bus shelters and stations.1.4 PRINCIPLES OF BRT SYSTEM PLANNING The following are the principles to guide BRT planning, design and development:
• BRT should be developed as a permanently integrated system of facilities, services and amenities.
• BRT should be rapid. It should operate on separate rights-of-way wherever possible and on wide, continuous, free-flowing streets where separate right-of-way is unavailable or removed from markets.
• Wide station spacing is desirable.
• BRT systems should be capable of staged development. Subsequent development could include extending a BRT line or upgrading the running way.
• BRT systems should be reasonable in their costs to the community, urban travelers, and the transit agency.
• The system should be designed to increase transportation capacity in heavily traveled corridors, reduce travel times for riders, and minimize total person delay in the corridors served.
• A basic goal should be to maximize person flow with the minimum net total person delay over the long run.
• System design and operations should enhance the presence, permanence, and identity of BRT facilities and services.
• BRT vehicles, stations and marketing materials should convey the image of BRT as a rapid, easy to use service.
1.4 OBJECTIVES
The objectives of this study is to evaluate the existing BRT network by means of bus stop accessibility, travel time, line route network coverage, number of passenger transfers, passenger transfer waiting time, number of service trips and line route evaluation of network in the planning area of Visakhapatnam and to suggest options to improve the existing bus network and measure the impact of options suggested over the existing bus network using strategic transportation planning.
In light of the these issues this study has been taken up to equip the BRT network in Visakhapatnam with BEAD Tool, which is used to improve the existing network with regard to future urban transportation development (integration of BRT services with NMT).
II.
METHODOLOGY
2.1 GOALS, OBJECTIVES AND SELECTION OF PLANNING AREA
141
Copyright © 2011-15. Vandana Publications. All Rights Reserved.
2.2 ANALYSIS OF BRT PERFORMANCE USINGBEAD TOOL
BEAD Tool is used to evaluate the performance of BRT corridor with respect to station design aspects. Various scenarios are created with varying inputs and the parameters which affect the score most are studied. Some of the outputs from BEAD Tool can be used as inputs for analysis.
III.
STUDY AREA AND DATA
COLLECTION
Figure 2: Proposed BRT Corridors for Visakhapatnam
At present, for all the proposed 8 corridors, only 2 corridors are in operation. Remaining corridors are likely to be completed after the successful operation of present corridors. They are:
a) Pendurthi Transit Corridor (PTC) and b) Simhachalam Transit Corridor (STC)
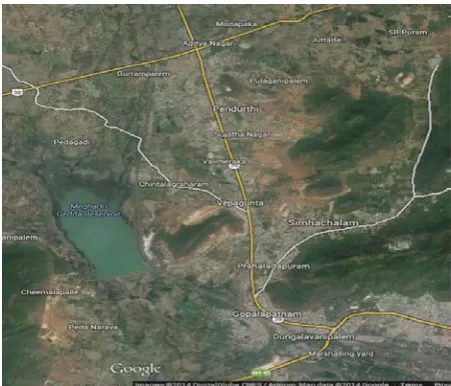
We considered (PTC) as our study area. The corridors is having a corridor length of 9.9km, with average Right-of-way of 40m and 60m. Fig.3 shows the Google earth images of the (PTC) BRT corridors.
Figure 3: Google map showing Pendurthi Transit Corridor (PTC)
3.1 DATA COLLECTION
Data required for analysis using BEAD Tool is taken. The data required and collected for both the analysis is presented in the following chapter.
The data collected for the analysis using is as follows:
• Average trip length in the city • Length of BRT Corridors
• Signal Cycle length for the intersections in the corridors
• Average Distance between bus stops • Queue length for the intersections • Right-of-way (Average) for the corridors • Type of BRT (closed or open
3.2 DETAILS OF DATA COLLECTED FROM APSRTC
Bus stop information comprises information regarding location of bus stops, direction, availability of shelter, and type of bus stop which means whether it is modernized or old structure. Here the Google earth is used to locate the stop point location and its exact coordinate within the planning area.
142
Copyright © 2011-15. Vandana Publications. All Rights Reserved.
AC Volvo etc., number of trips, and schedule kilometres.Route information of bus route information and the starting time and ending time of the regular bus services and its frequencies are collected. In the overall Visakhapatnam BRT network, there are 50 official bus routes including all small variations. In practical terms, the number of routes could be considered to be around 50 in the BRTS network.
Route wise time table information of BRT Network has been used to develop the time tables for all the line routes created within the planning area whose head way is less than one hour. These bus line routes are almost restricted to the services which is starting and ending within and around the planning area. The starting and ending time of the each line route is collected from the above Fig. which containing the whole line route information.
IV.
ANALYSIS USING BEAD TOOL
4.1 DETAILED FEATURES OF BEAD TOOL
For the performance evaluation of bus based public transit systems, a spreadsheet based modeling tool, BEAD (Bus Rapid Transit Evaluation and Design) Tool by S G Architects and Fazio Engineer ware, 2013 has been developed. This tool provides quantitative assessment of bus performance against multiple indicators (Gandhi 2013). BEAD Tool is a *.xls based interactive tool which allows engineers, planners, designers and decision makers to make a comparative evaluation against any proposed changes in the features and their configuration in a BRT system. It has been developed to provide Bus Rapid Transit System (BRTS) planners and designers with the means to predict the performance of a designed/planned system and compare the same against alternate options. Many existing, commercially available modeling software focuses on BRTS vehicle performance such as bus operational speed in the corridor, as a part of the road system, whereas BEAD tool generates average performance values for passenger centric parameters such as passenger speeds and door to door travel times. This allows more appropriate performance evaluation of systems based on its benefits in terms of attracting use and effecting long term modal shift in favour of public transport. The tool provides a comparative evaluation examines alternate planning, operational and design options for Bus Rapid Transit Systems. Performance results for different indicators are generated using a spreadsheet tool.
The BEAD tool presents results or performance values of different indicators of the design in two stages:
Segment Wise Results
Overall Aggregated Results for the Entire Corridor
The results for both the above categories are presented under same heads. However segment wise results are presented after the inputs for each segment have been fed in the tool. These include additional signal
and cross section design information specific to the input segment. The overall (Corridor) performance measures on a scale of 1 to 100. More than 70 is considered the ideal performance, while 60 to 70 is good, 50 to 60 is average while less than 50 is poor.
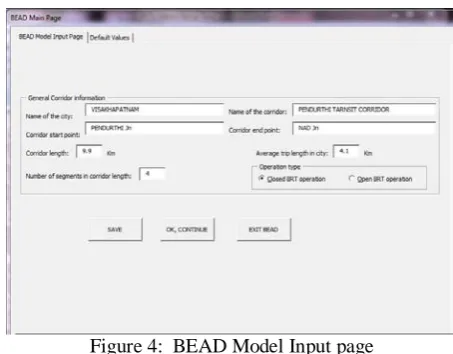
4.2 Inputs given to BEAD TOOL
For the analysis using BEAD Tool, the total corridor length is divided into segments depending on the land use. With the data available, the same is done for the corridors. PTC of length 9.9km is divided into 4 segments. Fig.4 shows the BEAD Model inputs page where some of the inputs like name and length of the corridor, no. of segments in the corridor, average trip length in the city and type of BRT are given.
Figure 4: BEAD Model Input page
4.2.1 Segment details
143
Copyright © 2011-15. Vandana Publications. All Rights Reserved.
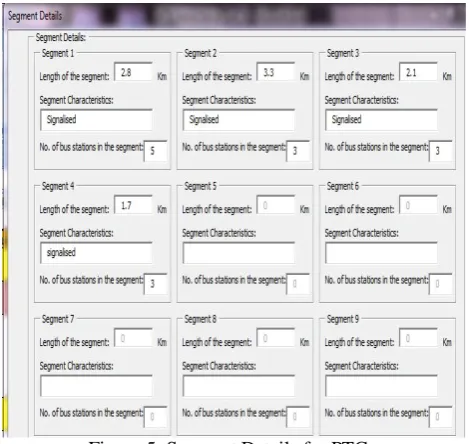
Figure 5: Segment Details for PTC4.2.2 BRTS General Inputs
The segment wise details of station type, bus lane and location type, Right-of-Way width, expected motor vehicle queue length in peak periods, type of land use, number of motor vehicle lanes per direction, average distance between bus stops and the segment default values like BRT Bus speed limit and average speed of motor vehicles in the city are given as inputs. Fig.6 shows the picture showing BRTS general inputs. These values can be edited to create alternate scenarios which are done by varying the average distance between bus stops.
Figure 6: BRTS general inputs for segment-1
4.2.3 Junction model inputs
In the junction model inputs, signal cycle phase length for intersections in the segment, type of grade separated intersection, type of cross road traffic, bus priority signal are entered for analysis. Figure 7 shows the junction model inputs for segment-1.
4.2.4 Station design inputs
Station design aspects like bus station type, station location in bus ways, station configuration, station boarding doors, type of grade separated pedestrian access, platform height of bus at the station, width of bus station platform, no. of simultaneous buses to be catered, type of fare collection etc. can be given as inputs which is clearly shown in Fig.8
After all the inputs are given, the tool is ready for execution. This can be done by clicking “OK,CONTINUE” which displays the results page for the details of corresponding segment
.
Figure 7: Junction model inputs for segment-1
144
Copyright © 2011-15. Vandana Publications. All Rights Reserved.
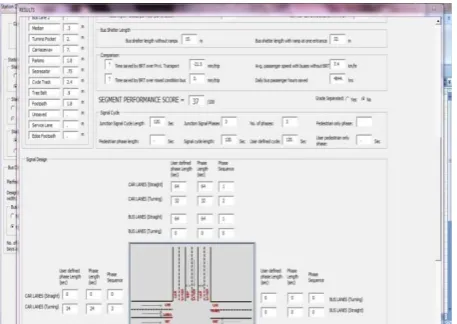
4.2.5 Results for segment-1The results page displays the performance score calculated for the given inputs. For the segment-1 of PTC, the score is 37 out of 100 which is very less as per the standards of BEAD Tool. The inputs are to be changed to check the variations in the performance score of segment-1. Along with the results, some other parameters like time saved by BRT over private transport, time saved by BRT over mixed condition buses etc. are displayed which on changing the inputs either increase or decrease proving the need for improving the BRT corridor. Fig.9 shows results page for segment-1 of PTC
Figure 9: Results page for segment-1 of PTC
The analysis for existing field conditions for segment-1 of PTC can be viewed in detail from Fig.5 to 9. The alternate conditions are created by changing the inputs average distance between bus stops and signal cycle length. Analysis has to be extended for all the 4 segments of PTC. The result values and the parameters getting improved are described in the following articles. 4.3 OVERALL DETAILS FOR SEGMENTS OF PTC:
The overall results for total corridor length of both corridors (segment-wise) are tabulated in tables.1 to 8. Two alternate conditions for every segment have been created by varying the average distance between bus stops and signal cycle length. Table.1 presents the existing and alternate scenario details for segment-1 of PTC and the changes in some parameters are observed. Likewise, all the other tables present the values corresponding to various segments
.
Table1 Input values for segment-1 of PTC
Segment-1 Existing
Alternate-1
Alternate-2
Right-of-Way(m)
40 40 40
Queue Length(m)
30 30 30
AD between stations(m)
560 470 560
Signal Cycle length(s)
120 60 60
Performance score (out of
100)
37 44 45
Table.2 shows the variations in various parameters by creating the alternate scenarios. This table clearly shows the creation of alternate scenarios results in improvement of the performance score of the segment thereby increasing average per passenger in-vehicle time, average passenger speed with BRTS and without BRTS etc. and decreasing average per passenger access time and per trip time saved by BRTS over mixed condition bus.
Table 2 Changes in network parameters for different scenarios for segment-1 of PTC
Segment-1 Existing Alternate-1 Alternate-2
Average per passenger access time (min)
22.4 20.4 20.7
Average per passenger in-vehicle time (min)
7.9 7.8 7.1
Passenger speed with BRTS(km/hr)
8.1 8.7 8.9
Passenger speed without BRTS(km/hr)
7.4 7.4 7.4
Per trip time saved by BRTS over PrT (min)
-21.5 -19.4 -19
Per trip time saved by BRTS over mixed
condition(min)
3 5.3 5.5
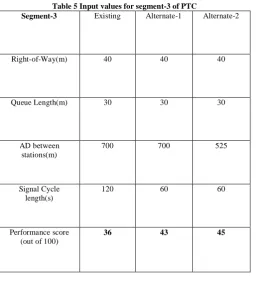
Tables 3, 4 present the input values and changes in parameters for segment-2 of PTC respectively. Similarly, tables 5, 6 present respectively the input values and changes in parameters for segment-3 of PTC and tables.7,8 present respectively the input values and changes in parameters for segment-4 of PTC
.
Table 3 Input values for segment-2 of PTC
Segment-2 Existing Alternate-1 Alternate-2
Right-of-Way(m) 40 40 40
Queue Length(m) 30 30 30
AD between stations(m)
1000 550 550
Signal Cycle length(s)
120 120 60
Performance score (out of 100)
27 30 49
Table 4 Changes in network parameters for different scenarios for segment-2 of PTC
Segment-2 Existing Alternate-1 Alternate-2
Average per passenger access time (min)
25.5 23.5 19.7
Average per passenger in-vehicle time (min)
6.1 8 7.4
Passenger speed with BRTS(km/hr)
7.8 7.8 9.1
Passenger speed without BRTS(km/hr)
6.6 6.8 7.4
Per trip time saved by BRTS over PrT (min)
-22.9 -22.8 -18.3
Per trip time saved by BRTS over mixed
condition(min)
145
Copyright © 2011-15. Vandana Publications. All Rights Reserved.
Table 5 Input values for segment-3 of PTCSegment-3 Existing Alternate-1 Alternate-2
Right-of-Way(m) 40 40 40
Queue Length(m) 30 30 30
AD between stations(m)
700 700 525
Signal Cycle length(s)
120 60 60
Performance score (out of 100)
36 43 45
Table 6 Changes in network parameters for different scenarios for segment-3 of PTC
Segment-3 Existing Alternate-1 Alternate-2
Average per passenger access
time (min)
22.9 21.3 20.5
Average per passenger in-vehicle time (min)
7.1 6.4 7.3
Passenger speed with BRTS(km/hr)
8.2 8.9 8.8
Passenger speed without BRTS(km/hr
7.4 7.4 7.4
Per trip time saved by BRTS over PrT
(min)
-21.2 -18.9 -19.1
Per trip time saved by BRTS over
mixed condition(min)
3.4 5.7 5.5
Table 7 Input values for segment-4 of PTC
Segment-4 Existing Alternate-1 Alternate-2
Right-of-Way(m) 40 40 40
Queue Length(m) 30 30 30
AD between stations(m)
566.7 566.7 425
Signal Cycle length(s) 120 60 60
Performance score (out of 100)
30 49 48
Table 8 Changes in network parameters for different scenarios for segment-4 of PTC
Segment-4 Existing Alternate-1 Alternate-2
Average per passenger access
time (min)
23.5 19.7 19.3
Average per passenger in-vehicle
time (min)
8 7.3 8.5
Passenger speed with BRTS(km/hr)
7.8 9.1 8.8
Passenger speed without BRTS(km/hr)
6.8 7.4 7.3
Per trip time saved by BRTS over PrT
(min)
-22.7 -18.3 -19
Per trip time saved by BRTS over mixed
condition(min)
4.9 6.3 5.8
V. CONCLUSIONS
The performance of BRT corridor has been evaluated using BEAD Tool with existing and alternate scenarios. Alternate scenarios are created by editing the average distance between bus stops and decreasing signal cycle lengths in the inputs given to BEAD Tool, which implies shifting of bus stops. Analysis using BEAD Tool has shown that for PTC, average spacing between bus stations should be kept between 500-600m and signal cycle length should be kept as 60 sec, whereas Right-of-way and queue length are kept constant for every scenario. The performance score depends on many aspects but for the study only some parameters like average distance between bus stops, signal cycle length, Right-of-way width and Queue length are considered.
VI.
LIMITATIONS OF THE STUDY
The following are the limitations of the study: • The line route of bus network within the
planning area has not been modelled for full supply but mostly of 90%.
• Only city ordinary and metro express services have been considered in modelling the network of this present study.
VII.
SCOPE FOR FUTURE WORK
From the past studies, it has been observed that there is a better scope on the carried out research work. Some of the areas which require further study are as follows:
• Overcoming the limitations by modelling the network for full supply in network.
146
Copyright © 2011-15. Vandana Publications. All Rights Reserved.
• Model the network for future proposed MRTSscenario.
• Integration of BRT with NMT facilities.
REFERENCES
[1] Agarwal, A., and Chakravarti, D. (2010). “Planning for Accessible Transit Infrastructure-Case of Delhi BRT.” Journal of Urban Transport, 9(2), 107-113. [2] Badami, G., and Haider, M. (2007). “An analysis of public bus transit performance in Indian cities.” Journal of Transportation Research Part A, 41, 961–981.
[3] “BEAD-User Manual,” SG Architects, www.sgarchitects.in.
[4] Cervero, R., and Kang, C. D. (2011). “Bus rapid transit impacts on land uses and land values in Seoul, Korea.” Journal of Transport Policy, 18, 102–116. [5] Deng, T., Ma, M., and Jing, W. (2013). ” Evaluation of Bus Rapid Transit Implementation in China: Current Performance and Progress.” Journal of Urban Planning and Development, 139, 226-234.
[6] Gahlot, V., Swami, B. L., Parida, M., and Pawan, K. (2010). “Non-Motorized Modes as Feeder for Bus Rapid Transit System.” Journal of Urban Transport, 9(2), 132-140.
[7] Hsu, L. R. (2013).” Cost Estimating Model for Mode Choice between Light Rail and Bus Rapid Transit Systems.” Journal of Transportation Engineering, 139, 20-29.