Pratap et al. World Journal of Pharmaceutical and Life Sciences
HPLC METHOD DEVELOPMENT AND VALIDATION FOR SIMULTANEOUS
ESTIMATION OF TRANEXAMIC ACID AND ETHAMSYLATE PHARMACEUTICAL
DOSAGE FORMS
Dr. G. Pratap Kumar*, D. Manjeera and T. Murali Krishna
Principal and Professor, MRR College of Pharmacy, Near DSP Office, Nandigama-521185, Krishna District, Andhra Pradesh, India.
Article Received on 02/07/2017 Article Revised on 23/07/2017 Article Accepted on 13/08/2017
Drug Profiles 1. Tranexamic Acid
Description: Antifibrinolytic haemostatic used in severe
hemorrhage.
Structure
Appearance: Crystalline powder
Molecula Weight: 157.21
Molecularformula: C8H15NO2
Iupac:
(1r,4r)-4-(aminomethyl)cyclohexane-1-carboxylic acid.
Indication: For use in patients with hemophilia for short
term use (two to eight days) to reduce or prevent hemorrhage and reduce the need for replacement therapy during and following tooth extraction. It can also be used for excessive bleeding in menstruation, surgery, or trauma cases.
Pharmaco Dynamics: Tranexamic acid is an
antifibrinolytic that competitively inhibits the activation of plasminogen to plasmin. Tranexamic acid is a competitive inhibitor of plasminogen activation, and at much higher concentrations, a noncompetitive inhibitor of plasmin, i.e., actions similar to aminocaproic acid. Tranexamic acid is about 10 times more potent in vitro than aminocaproic acid. Tranexamic acid binds more strongly than aminocaproic acid to both the strong and weak receptor sites of the plasminogen molecule in a ratio corresponding to the difference in potency between the compounds. Tranexamic acid in a concentration of 1 mg per mL does not aggregate platelets in vitro. In patients with hereditary angioedema, inhibition of the formation and activity of plasmin by tranexamic acid may prevent attacks of angioedema by decreasing
*Corresponding Author: Dr. G. Pratap Kumar
Principal and Professor, MRR College of Pharmacy, Near DSP Office, Nandigama-521185, Krishna District, Andhra Pradesh, India.
ABSTRACT
A simple, Accurate, precise method was developed for the simultaneous estimation of the Tranexamic acid and Ethamsylate in Tablet dosage form. Chromatogram was run through Kromasil 250 x 4.6 mm, 5. Mobile phase containing Buffer and Acetonitrile in the ratio of 55:45A was pumped through column at a flow rate of 1ml/min. Buffer used in this method was 0.1% OPA buffer with pH 4.8 adjusted by Triethylamine and Temperature was maintained at 30°C. Optimized wavelength for Tranexamic acid and Ethamsylate was 230nm. Retention time of Tranexamic acid and Ethamsylate were found to be 2.527min and 3.142 min. %RSD of the Tranexamic acid and Ethamsylate were and found to be 0.9 and 0.1 respectively. %assay was obtained as 100.54% and 99.98% for Tranexamic acid and Ethamsylate respectively. LOD, LOQ values are obtained from regression equations of Tranexamic acid and Ethamsylate were 0.02ppm, 0.08ppm and 0.07ppm, 0.24ppm respectively. Regression equation of Tranexamic acid & Ethamsylate is y = 18625x + 4734and y = 18614x + 5549.Retention times are decreased and that run time was decreased so the method developed was simple and economical that can be adopted in regular Quality control test in Industries.
KEYWORDS: Tranexamic acid, Ethamsylate, RP-HPLC.
World Journal of Pharmaceutical and Life Sciences
WJPLSplasmin-induced activation of the first complement protein (C1).
Mechanism of Action: Tranexamic acid competitively
inhibits activation of plasminogen (via binding to the kringle domain), thereby reducing conversion of plasminogen to plasmin (fibrinolysin), an enzyme that degrades fibrin clots, fibrinogen, and other plasma proteins, including the procoagulant factors V and VIII. Tranexamic acid also directly inhibits plasmin activity, but higher doses are required than are needed to reduce plasmin formation.
Absorption: Absorption of tranexamic acid after oral administration in humans represents approximately 30 to 50% of the ingested dose and bioavailability is not affected by food intake.
2. Ethamsylate
Description: Ethamsylate Is An Organic Acid Widely
Distributed In Animal Tissues. It is a Major Constituent of Bile and can be found in the Large Intestine,
Structure
Appearance: Solid
Molecular Weight: 263.31
Molecular Formula: C6H6OS5•C4H11N
Indication: Prophylaxis and control of haemorrhages
from small blood vessels, neonatal intraventricular haemorrhage capillary bleeding of different etiology, including: menorrhagia and metrorrhagia without organic pathology, after trans-urethral resection of the prostate, hematemesis, melena, hematuria, epistaxis; secondary bleeding due to thrombocytopenia or thrombocytopathia, hypocoagulation, prevention of periventricular hemorrhages in prematurely born children
Mechanism of Action: Catalyzes the conversion of
Ethamsylate and alpha ketoglutarate to sulfite, aminoacetaldehyde and succinate. Required for the utilization of Ethamsylate (2-aminoethanesulfonic acid) as an alternative sulfur source. Pentane-sulfonic acid, 3- (N-morpholino)propanesulfonic acid and 1,3-dioxo-2- isoindolineethanesulfonic acid are also substrates for this enzyme.
Category: Catalytic activity, oxidoreductase activity.
OBJECTIVE AND PLAN OF STUDY
To develop a new HPLC method for simultaneous estimation of Tranexamic acid and Ethamsylate to
develop a validated method according to ICH guidelines.
To apply validated method for the estimation of Tranexamic acid and Ethamsylate in pharmaceutical formulation.
MATERIALS AND METHODS
Materials
Tranexamic acid and Ethamsylate, Combination Tranexamic acid and Ethamsylate tablets, distilled water, acetonitrile, phosphate buffer, ammonium acetate buffer, glacial acitic acid, methanol, potassium dihydrogen phosphate buffer, tetra hydrofuran, tri ethyl amine, ortho-phosphoric acid etc.
Instrument
HPLC instrument used was of WATERS HPLC 2965 SYSTEM with Auto Injector and PDA Detector.
Software used is Empower 2. UV-VIS
spectrophotometer PG Instruments T60 with special bandwidth of 2mm and 10mm and matched quartz was be used for measuring absorbance for Tranexamic acid and Ethamsylate solutions.
Methods
Preparation of buffer Buffer: (0.1 %OPA)
1 ml of con. OPA is dissolved in 1000 ml volumetric flask diluted with distilled water up to the mark. pH adjusted to 2.8 by using Triethylamine.
Standard Preparation
Accurately Weighed and transferred 20mg&10mg of Tranexamic acid and Ethamsylate working Standards into a 10ml and 10ml clean dry volumetric flask respectively, add 5ml and 5ml of diluent, sonicated for 30 minutes and make up to the final volume with diluents. From the above stock solutions, 1ml was pipette out in to a 10ml volumetric flask and then make up to the final volume with diluent.
Sample Preparation
5 tablets were weighed and calculate the average weight of each tablet then the weight equivalent to 1 tablet was transferred into a 250 ml volumetric flask, 150ml of diluent added and sonicated for 30 min, further the volume made up with diluent and filtered. From the filtered solution 1ml was pipette out into a 10 ml volumetric flask and made up to 10ml with diluent.
Accuracy
Standard Preparation
Accurately Weighed and transferred 20mg&10mg of Tranexamic acid and Ethamsylate working Standards into a 10ml and 10ml clean dry volumetric flask respectively, add 5ml and 5ml of diluent, sonicated for 30 minutes and make up to the final volume with diluents.
Preparation of 50% Spiked Solution: weight
equivalent to 500mg of tablet powder was transferred into a 250 ml volumetric flask, 50ml of diluent added and sonicated for 30 min, further the volume made up with diluent and filtered. 1ml from each standard stock solution was pipette out and taken into a 10ml volumetric flask to that 1ml of filtered Accuracy 100% Sample stock solution was spiked and made up with diluents.
Preparation of 100% Spiked Solution: weight
equivalent to 1000mg of tablet powder was transferred into a 250 ml volumetric flask, 50ml of diluent added and sonicated for 30 min, further the volume made up with diluent and filtered. 1ml from each standard stock solution was pipette out and taken into a 10ml volumetric flask to that 1ml of filtered Accuracy 100% Sample stock solution was spiked and made up with diluents.
Preparation of 150% Spiked Solution: weight
equivalent to 1500 mg of tablet powder was transferred into a 250 ml volumetric flask, 750ml of diluent added and sonicated for 30 min, further the volume made up with diluent and filtered. 1ml from each standard stock solution was pipette out and taken into a 10ml volumetric flask to that 1ml of filtered Accuracy 100% Sample stock solution was spiked and made up with diluents.
Method Development
Method Development: Many trials were done by
changing columns and Mobile phases and were reported below.
Trial: 1
Column Used :Kromasil 250 x 4.6 mm, 5.
Mobile phase : water: methanol (50:50)
Flow rate : 1ml/min
Wavelength : 230nm
Temperature C
Injection Volume : 10µl
Fig 1: Trial chromatogram.
Observation: Tranexamic acid peak was eluted but not eluted Ethamsylate peak so further trail was carried out.
Trial: 2
Column Used :Kromasil 250 x 4.6 mm, 5.
Mobile phase : Buffer: Acetonitrile (30:70A)
Buffer : 0.1% Ortho phosphoric acid
Flow rate : 1ml/min
Wavelength : 230nm
Temperature C
Injection Volume : 10µl
Fig 2: Trial chromatogram.
Observation: Tranexamic acid and Ethamsylate both
peaks eluted but. Peak shape was not good and resolution less So further trial is carried out.
Optimized Method: Drugs were eluted with good
retention time, resolution; all the system suitable parameters like Plate count and Tailing factor were within the limits.
Column Used :Kromasil 250 x 4.6 mm, 5.
Buffer used :OPA
Mobile phase : Buffer: Acetonitrile (55:45A)
Flow rate : 1ml/min
Diluent : Water and Acetonitrile (50:50).
Wavelength : 230
Temperature C
Injection Volume : 10µl
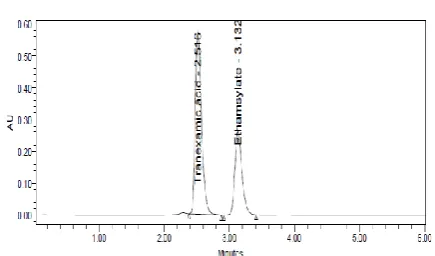
Fig 3: Optimized chromatogram of Tranexamic acid and Ethamsylate.
RESULTS AND DISCUSSIONS
1. System suitability: All the system suitability
parameters are within range and satisfactory as per ICH guidelines.
System suitability studies of Tranexamic acid and Ethamsylate method.
Property Tranexamic
acid
Ethamsylate
Retention time (tR) 2.527min 3.142min Theoretical plates (N) 3341 ± 63.48 4096 ± 63.48 Tailing factor (T) 1.37 ± 0.117 1.29± 0.117
Fig 4: Chromatogram of blank.
Fig 5: Typical chromatogram of Tranexamic acid and Ethamsylate.
2. Linearity: Six Linear concentrations of Tranexamic
acid (50-300ppm) and Ethamsylate (25-150ppm) are prepared and Injected. Regression equation of the Tranexamic acid and Ethamsylate are found to be, y = 18625.x + 4734, and y = 18614.x + 5549. And regression co-efficient was 0.999.
Fig 6: Calibration curve of Tranexamic acid.
Fig 7: Calibration curve of Ethamsylate.
Fig 8: Linearity 25% Chromatogram of Tranexamic acid and Ethamsylate.
Fig 9: Linearity 50% Chromatogram of Tranexamic acid and Ethamsylate.
Fig 10: Linearity 75% Chromatogram of Tranexamic acid and Ethamsylate.
3. Precision
Intraday precision (Repeatability): Intraday Precision
Repeatability results for Tranexamic acid and Ethamsylate.
S.No. Tranexamic acid Ethamsylate
1 3865035 1990117
2 3947651 1987499
3 3865633 1987087
4 3867298 1992210
5 3856195 1989632
6 3859513 1984121
Mean 3876888 1988444
Std. Dev. 34918.8 2821.9
%RSD 0.9 0.1
*Average of six determinations
4. Accuracy: Threeconcentrations 50%, 100%, 150%,
were injected in a triplicate manner and amount Recovered and % Recovery were displayed in Table 6.5.
Sample Concentration
(%) (µg/ml)
Recovery (%)
% RSD Tranexamic
acid 100 99.65 0.26
200 100.55 1.20
300 100.25 0.30
Ethamsylate 50 99.78 1.19
100 99.50 0.52
150 100.21 1.42
5. LOD: Limit of detection was calculated by std
deviation method Tranexamic acid and Ethamsylate and LOD for Tranexamic acid and Ethamsylate were
found to be 0.02and 0.08respectively.
6. LOQ: Limit of Quantification was calculated by std
deviation method Tranexamic acid and Ethamsylate and LOQ for Tranexamic acid and Ethamsylate were found to be 0.07and 0.24 respectively.
7. Robustness: Small deliberate changes in method
like Flow rate, mobile phase ratio, and temperature are made but there were no recognized change in the result and are within range as per ICH Guide lines.
Assay: Standard preparations are made from the API and
Sample Preparations are from Formulation. Both sample and standards are injected six homogeneous samples. Drug in the formulation was estimated by taking the standard as the reference. The Average %Assay was calculated and found to be 100.54% and 99.98% for Tranexamic acid and Ethamsylate respectively.
Assay of Tablet
S. No. Tranexamic
acid %Assay
Ethamsylate %Assay
1 100.23 100.06
2 102.37 99.93
3 100.24 99.91
4 100.29 100.17
5 100.00 100.04
6 100.09 99.76
AVG 100.54 99.98
STDEV 0.9055 0.1419
%RSD 0.9 0.14
SUMMARY AND CONCLUSION
Summary Table
Parameters Tranexamic acid Ethamsylate
Calibration range (mcg / ml) 50-300ppm 25-150ppm
Optimized wavelength 230nm 230nm
Retention time 2.527min 3.142 min
Regression equation (Y*) y = 18625.x + 1734 y = 18614.x + 5549
Correlation coefficient(r2) 0.999 0.999
Precision (% RSD*) 0.9 0.1
% Assay 100.54 99.98
Limit of Detection (mcg / ml) 0.02ppm 0.08ppm
Limit of Quantization (mcg / ml) 0.07ppm 0.24ppm
CONCLUSION
A simple, Accurate, precise method was developed for the simultaneous estimation of the Tranexamic acid and Ethamsylate in Tablet dosage form. Retention time of Tranexamic acid and Ethamsylate were found to be 2.527min and 3.142 min. %RSD of the Tranexamic acid and Ethamsylate were and found to be 0.9 and 0.1 respectively. %assay was obtained as 100.54% and 99.98% for Tranexamic acid and Ethamsylate respectively. LOD, LOQ values are obtained from
REFERENCES
1. R. S. Satoskar, S. D. Bhandarkar and S. S. Ainapure. “Pharmacology and Pharmacotherapeutics”, 17th edition, Popular Prakashan, Mumbai, India, 2001. 2. “Burger’s Medicinal Chemistry and drug
discovery”, 6 th edition, Wiley Interscience, New Jersey, 2007.
3. “Wilson and Gisvold’s Textbook of Organic Medicinal and Pharmaceutical Chemistry”, 11th edition, Lippincott Williams & Wilkins, New york, 2004.
4. Korolkovas. “Essentials of Medicinal Chemistry”, 2nd edition, Wiley Interscience, New Jersey, 1988. 5. “Goodman and Gilman’s The Pharmacological
Basis of Therapeutics”, 9th edition, McGraw-Hill health professions division, New york, 1996. 6. Foye’s “Principles of Medicinal Chemistry”, 6th
edition, Lippincott Williams & Wilkins, New york, 2008.
7. Drugs & Cosmetics Act, 1940 & Rules, 1945, 2nd edition, Susmit publishers, Mumbai, India, 2000. 8. Indian Pharmacopoeia, Ministry of Health & Family
Welfare, Government of India, New Delhi, 1996. 9. The United States Pharmacopoeia- the National
Formulary, United States Pharmacopoeial convention, Rockville, 2007.
10. British Pharmacopoeia, The Stationary Office, London, 2005.
11. “Martindale - The Extra Pharmacopoeia”, rd edition, The Pharmaceutical Press, London, 2002; 7. 12. H. Beckett and J. B. Stenlake. “Practical
Pharmaceutical Chemistry”, Volume I and II, CBS Publishers & Distributors, New Delhi, India, 2000. 13. P. D. Sethi. “Quantitative Analysis of Drugs in
Pharmaceutical Formulations”. rd edition, CBS Publishers & Distributors, New Delhi, India, 1997. 14. H. H. Willard, L. L. Merrit, J. A. Dean and F. A.
Settle. “Instrumental Method of Analysis”, 7th edition, CBS Publishers & Distributors, New Delhi, India, 1986.
15. R. A. Day and A. L. Underwood. “Quantitative Analysis”, 6th edition, PHI learning private limited, New Delhi, India, 2009.
16. Ramana Rao, S. S. N. Murthy and P. Khadgapathi. Gas chromatography to pharmaceutical analysis (Review). Eastern Pharmacist, 1987; 30(353): 35. 17. Ramana Rao, S. S. N. Murthy and P. Khadgapathi.
High performance liquid chromatography and its role in pharmaceutical analysis (Review). Eastern Pharmacist, 1986; 29(346): 53.
18. Ll-Yord R. Snyder, Joseph J. Kirkland and Joseph L. Glajch. Practical HPLC Method development. John Wiley & Sons, INC, U.S.A. 2 nd Edition, New York, 1997.