http://dx.doi.org/10.22161/ijeab/1.4.5
ISSN: 2456-1878
www.ijeab.com Page |
637
Effects of land use on Soil Organic Carbon
fractions in soils of Njala Landscape
in Sierra Leone
Denis M. K. Amara
1*, Sahr A. Koroma
2, Philip J. Kamanda
3, Augustine M. Kamara
3,
Daniel H. Saidu
41Department of Soil Science, School of Agriculture, Njala University, Njala Campus, Sierra Leone. 2U-verse Technician, AT&T, Houstin, Texas, USA.
3Department of Extension & Rural Sociology, School of Agriculture, Njala University, Njala Campus, Sierra Leone. 4Welthungerhilfe DiPAT Project Bo, 137 Bo-Kenema Highway, Bo, Sierra Leone.
* Corresponding author: Dr. Denis. M. K. Amara, Department of Soil Science, School of Agriculture, Njala University, Sierra Leone. E-mail: denismken@yahoo.com. Tel: +23279905400.
Abstract─ Soil organic carbon fractions reflect the
difference in soil organic carbon from one land use to another, and it can be regarded as an indication of the
degree of soil organic carbon deterioration or
improvement. Although knowledge of importance soil quality indicators is vital for replenishing and maintaining soil fertility, little information is available on the effect of different land use management on soil organic matter fractions in Sierra Leone. In the present study, the effects of different land use on the distribution of soil organic matter fractions in soils of the Njala series was assessed. The study revealed both positive and negative effect of land uses on Organic carbon fractions at the Matturie site showed an increase upon conversion of grassland to tree cropping except for carbon in the silt+clay fraction. The total organic carbon, light fraction carbon and particulate organic carbon fractions were significantly greater in the forest soil than in soils under grassland. The decline in the silt+clay fraction organic carbon was an indication that residue decomposition and organic matter addition are low in this area. At the Old Agronomy Site, where Acacia and
Gliricidia fallows were converted to agriculture
(groundnut), soil organic carbon (SOC) contents showed a decrease under annual cropping land use types. The conversion of Acacia and Gliricidia land use to groundnut cultivation resulted in loss of total organic carbon and all carbon fractions. The largest decline was in the light fraction carbon (16.46%)., followed by the particulate organic carbon (15.82%), total organic carbon (14.63%) and the silt+clay fraction (5.83%). The least decline occurring in the silt+clay fraction indicates that organic
matter is better protected in silt+clay fraction. Similar changes in soil organic carbon fractions, as observed for the Old Agronomy site, were observed at the NATC site. The results showed that there are greater losses of particulate organic carbon (17.24%), light fractions (18%) and total organic carbon (16.21) than from the silt+clay fraction (7.34) when the land use is changed from secondary forest to arable cropping.
Keywords— Soil organic carbon, Sierra Leone,
degradation, vegetation, land use, soil quality, soil productivity, Njala.
I. INTRODUCTION
http://dx.doi.org/10.22161/ijeab/1.4.5
ISSN: 2456-1878 increase in grassland and alfalfa soils compared with
cropped soils. Land use is an integrator of several environmental attributes which influence soil organic matter fraction [6].
The rate of soil organic matter degradation depends on land use systems, soil types, topography, and climatic conditions. Among these factors, inappropriate land use aggravates the degradation of soil physical, chemical and biological properties [7]. According to [8], land use affects basic processes such as erosion, soil structure and aggregate stability, nutrient cycling, leaching, carbon sequestration, and other similar physical and biochemical processes. The importance of soil organic matter fractions on soil properties is well known. It influences plant productivity [9], soil structure and the distribution of soil micro-organisms [10]. In many ecosystems, equilibrium levels of soil organic matter are determined by plant biomass production, stabilization and mineralization of organic compounds. When this equilibrium is changed by introduction of new agricultural practices, soil organic matter contents are modified. However, ranges of modifications depend upon climatic conditions, land uses, soil types, and soil texture. Experimental evidence suggests that land use conversion has both positive and negative effects on soil total and extractable carbon and SOM. In Puerto Rico, [11] observed that decreases of soil organic carbon under cultivation were more important under moist climatic conditions that under dry conditions. One year after clearing a tropical rainforest, organic carbon content in the 0–15 cm layer of an Ultisol was 25% lower than before. In Albeluvisols, grassland soil was found to contain by 0.2-0.6 g kg-1 more C compared to fallow land (1-1.5 years old).
Soil organic matter fractions can respond rapidly to changes in land use. These fractions have therefore been suggested as early indicators of the effects of land use on soil organic matter quality [12], as well as important indicators of soil quality. Recently, there has been increased interest in the importance of microbiological properties as indicators of change in soil quality [13]. [14] reported that hot water-extractable C could be used as an integrated measure of soil quality. However, the majority of studies on the labile organic matter fractions in other countries have used only topsoil samples based on the assumption that land use effects occur mainly in the uppermost few centimeters. Much less is known, however, on t he impact of different land use systems on labile organic matter fractions, as well as distribution of labile organic matter through the soil profile depth.
In Sierra Leone, majority of the population is still dependent on forest and agriculture. Maintenance and improvement of soil organic matter is therefore a prime concern. Information regarding the status organic matter (SOM) in soils under different land uses in Sierra Leone is scarce. However soil degradation due to inappropriate land use system is threatening the livelihood of thousands of people [15]. Similarly, large areas of land are abandoned within less than three decades of continuous cultivation. Although knowledge of importance soil quality indicators is vital for replenishing and maintaining soil fertility, little information is available on the effect of different land-use management on soil organic matter fractions in Sierra Leone. Keeping this view in mind, this study was undertaken to assess the effects of different land use on the distribution of soil organic matter fractions in soils of the Njala series.
II. MATERIALS AND METHODS
2.1. Description of study area
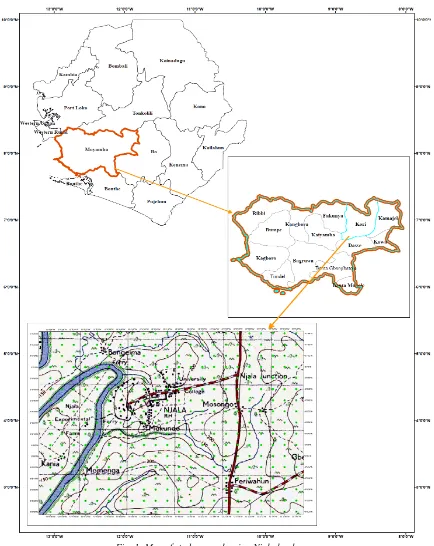
Njala area (Fig. 1) is situated on 8° 7' North Latitude and 12° 5' West Longitude in Kori Chiefdom, Moyamba District in the Southern Province of Sierra Leone. It is bounded on the east by the main Freetown-Bo highway, except for a small area east of this road near Bonganema and also on northwest of Taiama. The Taia River, one of the famous rivers in Sierra Leone, forms the western boundary. Njala is a famous and popular community as the name not only precedes but also hosts the famous and popular Njala University, which are Sierra Leone’s first most renounced university for agricultural studies. The climate of Njala is warm to hot, with marked rainy and dry seasons. The annual rainfall is high averaging 2,750 mm. However, about 90% of this rainfall occurs during the rainy season from May to November. Hence, leaving the other 5 months with no more than 250 mm of rainfall.
2.2. Description of soils of Njala series
http://dx.doi.org/10.22161/ijeab/1.4.5
ISSN: 2456-1878
www.ijeab.com Page |
639
layer is usually 40–47% by volume; the thickness of thelayer varies from 0.8–1.5 m. The residual plinthite gravels are more irregular, relatively more porous and soft, and are formed in-situ. Colours are brighter red (10R 4/6). The gravel content varies from 35–45%, gradually declining with depth and gravel is replaced at about 2.4 m or more by
red plinthite mottles in a light grey to white matrix. The total thickness of both colluvial and residual gravelly layers may be up to 3.1 m or more. Quartz veins may be present in the residual materials while quartz gravels may be present in the whole profile, being relatively rounded in the colluvial layers and relatively angular in the residual layers.
http://dx.doi.org/10.22161/ijeab/1.4.5
ISSN: 2456-1878 The gravel-free surface layer is thin or absent, often
depending on topography. Textures are usually gravelly clay loam in the surface soils and gravelly clay loam in the subsoil. Topsoil colours are very dark grayish brown to dark yellowish brown (10YR-7.5YR 5/8-7/6). Red mottles may or may not be present. The soils are well to moderately well drain and are never waterlogged. The A horizon is usually less than 30 cm thick (Ochric epipedon). Njala soils have a very low nutrient status for plants. Except for the A horizon, the cation exchange capacity is less than 10 cmol(p+)/kg. Exchangeable content of Ca, Mg, K, and Na are low. In comparison with other soils like the Momenga soils, the exchangeable Al content of Njala soils is lower, pH (in KCl) is higher, and the available water holding capacity is much lower. The base saturation is very low. The organic carbon content of the A horizon is moderate (about 3%), but it declines sharply with depth (to about 0.5%). The erosion hazard is slight on nearly level areas and moderate on sloping areas. Runoff is low to moderate; permeability is rapid. Njala soils are very low in moisture content during approximately 5 months of the severe dry season.
2.3. Soil sample collection
Soil samples were collected from 0–20 cm depth from three different land use locations following the guidelines outlined in the Soil Survey Manual as follows:
Site I= Planted forest plots at the back of the Matturie hostels
Site II = The old agronomy buildings by SLARi
Site III = The School of Agriculture (NATC) forest
Site I
i) Two composite samples were taken from four different plots, each having a uniform type of forest tree planted with Terminalis ivorensis, Tectona grandis, Commelina arborea, and Eucalyptus caradulensis. A final sub-sample was taken from a land cultivated with the Gmelina arborea.
ii) Five sub-samples were also taken from fallowed grassland
Site II
Three composite samples were taken from this site as follows:
i. Five sub-samples from a fallow grassland
ii. Five sub-samples from a Gliricidia sepium planted plot, and
iii. Five sub-samples from an Acacia planted plot
Site III
Two composite samples were taken from this area as follows:
i. Five sub-samples from a undisturbed natural forest that has been abandoned for over forty years, ii. Five sub-samples from a grassland area. In total,
seven composite samples were obtained by sampling to a depth of 20cm with an auger.
2.4. Soil Analysis
2.4.1. Soil sample preparation
The collected soil samples were taken to the laboratory, air-dried for two weeks, crushed with mortar and pestle, sieved through a 2mm sieve and stored for analysis. Soil analysis was carried out at the Soil Analysis Laboratory of the Njala Agricultural research Center (NARC-SLARi) at Mokonde, Njala Campus following standard analytical procedures as outlined below:
2.4.2. Determination of soil organic carbon
Organic carbon content of the soils from the different plots was determined by following the Walkley-Black procedure [18]. Soil samples were grounded to pass through a 0.2mm sieve and 0.5g of each grounded sample was weighed and transferred into a 500mL wide mouth Erlenmeyer flask. 10mL of 1N K2Cr2O7 was added to each weighed sample and stirred gently to disperse the soil particles in the solution. This was immediately followed by the addition of 20mL of concentrated sulphuric acid (H2SO4), and immediately covered to prevent heart loss followed by vigorous swirling for one minute. After 30 minutes standing, 200mL of water was adde4d to the solution followed by 10mL of othophosphoric acid and gently swirled and allowed to cool. After cooling, the solution was titrated using 0.5M FeSO4, by using a phenolphthalein indicator.
From the titration results, the percent organic carbon was calculated, using the following formula:
Percent Organic Carbon = [MFe2+ (VFe2+-Vs) x0.3]/Ms
2.4.3. Isolation of the light fraction
http://dx.doi.org/10.22161/ijeab/1.4.5
ISSN: 2456-1878
www.ijeab.com Page |
641
on the <53µm sieve was then backwashed with distilledwater on an aluminium tray and dried at 70°C in an oven. The weight of the oven-dried sample was recorded.
2.4.4. Determination of organic carbon in the light fraction
The oven dried light fraction was ground and 0.05g of the ground material was placed in a 500ml Erlenmeyer flask. 10ml of potassium dichromate (K2Cr2O7) was added to the sample in the flask and swirled gently to disperse the soil in the solution. 20ml of concentrated sulphuric acid was rapidly added to the solution and covered directing the steam into the suspension. The flask was swirled gently for about 1 minute and allowed to stand for about 30 minute. 200ml of water was then added to the flask followed by 10ml of concentrated othophosphoric acid. The flask and its contents was swirled gently and allowed to cool down. The solution was then titrated with 0.5M FeSO4 solution.
2.4.5. Determination of particulate organic carbon (POC)
Dispersing agent was 3% Sodium hexametaphosphate solution made by dissolving 30g (NaPO3)6 in water in a 1L volumetric flask and made to volume. Sodium Chloride saturated solution was made by dissolving 175g NaCl in 1L warm water and cooled. A 200g of air-dried soil was weighed and transferred into a 250ml shaking bottle. 20ml of dispersion agent and 150ml of water was added and shaken overnight, lengthwise, horizontal position in a reciprocating shaker at 150 r.p.m.
The slurry with water was transferred into a 50µm sieve and placed in a funnel on top of a 1000ml measuring cylinder. It
was then sieved by pressing and stirring smoothly with a rubber plunger until the percolating water was almost clear. Care was taken so that the volume does not exceed the 1000ml mark. This was stirred thoroughly and the suspension was checked properly.
The fraction >50µm was transferred to a tray, dried overnight at 105°C and weighed. The small quantity of organic matter floating in the tray was decanted. This is however not allowed in case of peaty samples.
III. RESULTS AND DISCUSSION
3.1 Effect of land use on soil organic carbon fractions at Site I (Matturie Hostels)
Organic carbon fractions at the Matturie site shows an increase upon conversion of grassland to tree cropping except for carbon in the silt+clay fraction (Table 1). Generally, cultivation results in a decline in soil organic carbon and the active fractions of soil organic carbon are particularly sensitive to land use changes [20,21]. The results show that the total organic carbon, light fraction carbon and particulate organic carbon fractions are significantly greater in the forest soil than in soils under grassland. This result is expected because of the intense litter recycling taking place in forest soils [22] Therefore the increase in soil organic carbon fractions under forest land use may be attributed to the incorporation of large quantities of grass biomass during tillage. The decline in the organic carbon in the silt+clay fraction is an indication that residue decomposition and organic matter addition might not have reached the stage where it becomes incorporated into the smaller fractions to account for any effect.
Table 1: Changes in soil organic carbon fractions following conversion of grassland to forest at Site I (Matturie Hostels)
Site I Vegetation Periods (Years)
TOC* (gCkg-1soil)
LFC* (gCkg-1soil)
POC* (gCkg-1soil)
S+C* (gCkg-1soil)
Uncropped Grassland 15 32.0 0.8 6.7 5.5
Cropped Planted forest
trees 2 53.0 1.4 9.8 4.8
% change - - +65.6 +64.6 +45.5 -13.2
* TOC = Total Organic Carbon; LFC = Light Fraction Carbon; POC = Particulate Organic Carbon; S+C = Silt + Clay Fraction Organic Carbon.
4.2 Effect of land use on soil organic carbon fractions at Site II (Old Agronomy Site)
Two different land use changes have occurred on this site: Acacia fallow has been converted to cropland (groundnut cultivation) and Gliricidia fallow to cropland (groundnut) (Table 2a & 2b). As expected, soil organic carbon (SOC)
http://dx.doi.org/10.22161/ijeab/1.4.5
ISSN: 2456-1878 groundnut and a high mineralization rate due to exposure to
high temperature might be a possible reason for the low soil organic carbon recorded. According to [22], organic matter
input is low in arable land use, thus giving rise to the low organic carbon content observed in soils under this land use.
Table 2a: Changes in soil organic carbon fractions following conversion of Acacia woodlot to agricultural crop production at Site II (Old Agronomy Site)
Site II Vegetation Periods (Yrs)
TOC (gCkg-1soil)
LFC (gCkg-1soil)
POC (gCkg-1soil)
S+C (gCkg-1soil)
Uncropped Acacia 15 41.0 1.6 5.5 2.4
Cropped Groundnut 2 36.0 1.3 4.6 2.3
% change - - -14.6 -16.5 -15.8 -5.8
* TOC = Total Organic Carbon; LFC = Light Fraction Carbon; POC = Particulate Organic Carbon; S+C = Silt + Clay Fraction Organic Carbon.
Conversion of Acacia land use to groundnut cultivation resulted in loss of total organic carbon and all carbon fractions (Table 2a). The largest decline was in the light fraction carbon (16.5%)., followed by the particulate organic carbon (15.8%), total organic carbon (14.6%) and the silt+clay fraction (5.8%). The light fraction is considered to be the labile form of soil organic matter [24, 25] and is therefore more susceptible to loss upon cultivation. The least decline occurring in the silt+clay fraction indicates that organic matter is better protected in silt+clay fraction.
Similar patterns of change were also observed when Gliricidia fallow was converted to groundnut cropping (Table 2b). However, land use change in this case resulted in greater depletion of soil organic carbon fractions than in conversion of acacia land use to groundnut cropping. This might be due to the differences in the quality of organic inputs from the two dominant vegetations on this site. Gliricidia has a lower C/N ratio than acacia and is therefore
more easily decomposed than acacia. Plant residues like Gliricidia, which has a narrow C/N ration decompose quickly with rapid rate of humification but the amount of humus produced is limited by the amount of carbon present in the original residue. Thus carbon fractions resulting from the decomposition of acacia are more resistant to degradation and therefore persist for longer times than those resulting from Gliricidia decomposition. The lower levels of soil organic carbon fractions in cultivated soils may have resulted from a combination of low carbon inputs because of less biomass C return on harvested land and greater C losses because of aggregate disruption, increased aeration by tillage, crop residue burning, accelerated water erosion and livestock grazing [26, 27]. In contrast, higher soil organic carbon contents of soils under Acacia and Gliricidia land uses are probably due to higher litter production and N fixation by the leguminous Acacia [28] and Gliricidia biomass.
Table 2b: Changes in soil organic carbon fractions following conversion of Gliricidia woodlot to agricultural crop production at Site II (Old Agronomy Site)
Site II Vegetation Periods (Years)
TOC (gCkg-1soil)
LFC (gCkg-1soil)
POC (gCkg-1soil)
S+C (gCkg-1soil)
Uncropped Gliricidia 15 28.0 1.6 5.0 2.3 Cropped Groundnut 2 24.0 1.2 4.1 2.1 % change - - -14.3 -22.6 -17.8 -11.9
* TOC = Total Organic Carbon; LFC = Light Fraction Carbon; POC = Particulate Organic Carbon; S+C = Silt + Clay Fraction Organic Carbon.
3.3 Effect of land use on soil organic carbon fractions at Site III (NATC Site)
At the NATC site, there has been a change from secondary forest to agriculture (mainly cassava cultivation). Similar changes in soil organic carbon fractions, as observed for the
http://dx.doi.org/10.22161/ijeab/1.4.5
ISSN: 2456-1878
www.ijeab.com Page |
643
carbon is higher in forest soils compared with cultivatedfields [29]. Some researchers reported that the highest organic matter content is found in grasslands compared to agricultural fields [30, 31]. The depletion of organic matter
in the cultivated field can be associated with the intensive tillage and the removal of plant residue. The results indicate that cultivation decreases soil nutrient levels, as has been noted by many authors [32, 33, 34].
Table 3: Changes in organic carbon fractions following conversion of secondary forest to agricultural crop production at Site III (NATC Site)
Site III Vegetation Periods (Years)
TOC (gCkg-1soil)
LFC (gCkg-1soil)
POC (gCkg-1soil)
S+C (gCkg-1soil)
Uncropped Secondary
forest 15.0 37.0 0.5 4.9 2.5
Cropped Cassava 2.0 31.0 0.4 4.1 2.3
% change - - -16.2 -18.0 -17.2 -7.3
* TOC = Total Organic Carbon; LFC = Light Fraction Carbon; POC = Particulate Organic Carbon; S+C = Silt + Clay Fraction Organic Carbon
.
IV. CONCLUSION
As the percent change in soil organic carbon fractions reflects the difference in soil organic carbon from one land use to another, it can be regarded as an indication of the degree of soil organic carbon deterioration or improvement. The positive value shows improvement of the soil organic carbon, whereas negative value indicates deterioration of the soil organic carbon. Across the three sites, there has been greater reduction in soil organic carbon fractions when forest land use is converted to agricultural land use. Clearing and cultivation of forest lands resulted in deterioration of soil organic carbon compared to soils under forest, Acacia and Gliricidia land uses. Cultivated soils showed low soil organic carbon fractions. Total organic C, light fraction C, particulate organic C and silt+clay organic C fractions were all reduced. Improvement of total organic C, light fraction C, and particulate organic C under planted forest land use at Matturie site indicates that planting of well-adapted and fast-growing tree species can gradually improve soil quality and regenerate degraded lands. The study has revealed that soil organic carbon is best protected in the silt+clay fraction under grassland use, and the incorporation of residues during tillage could increase soil organic matter fractions in soils of the Njala series. The level of crop residue addition should be increased in order to increase the level of soil organic matter. A further research is needed to determine the Microbial Biomass Carbon, KMnO4 soluble carbon, water soluble carbon and KMnO4 soluble carbon. The results of such research can be compared with the current results to see if they show any correlation. There is need for faster organic matter restoration through the addition of organic residues in the Njala landscape.
REFERENCES
[1] B. M. Kogut, "Tansformation of humus status in cultivated Chernozems", Erusian Soil Sci., vol. 7, pp. 721-728, 1998.
[2] W. M. Post, R. C. Isaurralde, L. K. Mann, et al., "Monitoring and verifying changes of organic carbon in soils", Climate Change, vol. 51, pp. 3-99, 2001. [3] D. S. Schimel, "Terrestrial ecosystems and the carbon
cycle", Global Change Biol., vol. 1(1), pp. 77-91, 1995.
[4] D. Murty, M. U. F. Kirschbaum, R. E. McMurtrie, "Does conversion of forest to agricultural change soil carbon and nitrogen? A review of the literature", Global Change Biol., vol. 8, pp. 105-123, 2002. [5] Y. Z. Su, "Soil carbon and nitrogen sequestration
following the conversion of cropland to alfalfa forage land in northwest China". Soil & Tillage Res., vol. 92, pp. 181-189, 2007.
[6] Z. H. Young, B. R. Singh, B. R. Sitaula, "Soil organic carbon fractions under different land uses in Mardi watershed of Nepal", Communications in Soil Sci. & Plant Analysis, vol. 35, pp. 615-629, 2004.
[7] Z. L. He, A. K. Alva, D. V. Calvert, Y. C. Li, D. J. Banks, "Effects of N fertilization of grapefruit trees on soil acidification and nutrient availability in a Riviera fine sand". Plant Soil, vol. 206, pp. 11-19, 1999. [8] G. A. S. Maddonni, S. Urricariet, C. M. Ghersa, R. S.
Lavado, "Assessing soil fertility in the rolling Pampa using soil properties and maize characteristics". J. Agric. Res. Sci.,vol. 91, pp. 280-286, 1999.
http://dx.doi.org/10.22161/ijeab/1.4.5
ISSN: 2456-1878 annees d'essai", L'Agron Trop. vol. 30, pp. 344-53,
1975.
[10]D. S. Powlson, P. C. Brooks, B. T. Christensen, "Measurement of microbial biomass provides an early indication of changes in total soil organic matter due to straw incorporation". Soil Biol. & Biochem., vol. 19, pp. 159–164, 1987.
[11]A. E. Lugo, M. J. Sanchez, S. Brown, "Land use and organic carbon content of some subtropical soils", Plant and Soil, vol. 96, pp. 185-196, 1986.
[12]E. G. Gregorich, C. M. Monreal, M. Schnitzer, H. R. Schulten, "Transformation of plant residues into soil organic matter: Chemical characterization of plant tissue, isolated soil fractions, and whole soils". Soil Sci., vol. 161, pp. 680-693, 1994.
[13]S. Saggar, G. W. Yeates, and T. G. Shepherd, Cultivation effects on soil biological properties, microfauna and organic dynamics in Eutric Gleysol and Gleyic Luvisol soils in New Zealand, Soil & Tillage Res., vol. 58, pp. 55-68, 2001.
[14]A.. Ghani, M. Dexter, K. W. Perrott, "Hot-water extractable carbon in soils: A sensitive measurement for determining impacts of fertilization, grazing and cultivation". Soil Biol. & Biochem., vol. 35, pp. 1231-1243, 2003.
[15]MAFFS, "Assessment of the effects of forest degradation on biodiversity and the environment in post-war Sierra Leone", Forestry Department, MAFFS, 2002.
[16]W. van Vuure, R. T. Odell, P. M. Sutton, "Soil Survey of the Njala Area, Sierra Leone", Bulletin No. 3, 1972. [17]Soil Survey Division Staff, "Soil Survey Manual". USDA-SCS Agric. Handb. 18. US Gov. Print. Office, Washington, DC, 1993.
[18]C. A. Black, "Methods of Soil Analysis Part – II. Chemical and microbiological properties", Agronomy Monograph No. 9. American Society of Agronomy, Inc. Madison, Wisconsin, USA, pp. 18-25, 1965. [19]C. Shang, H. Tiessen, "Stabilization of organic
matter in two semi-arid tropical soils: size, density and magnetic separations", Soil Sci. Soc. Am. J., vol. 62, pp. 1247–1257, 1998.
[20]J. Six, E. T. Elliot, K. Paustian, J. W. Doran, "Aggregation and soil organic matter accumulation in cultivated and native grassland soils", Soil Sci. Soc Am. J., vol. 62, pp. 1367-1377, 1998.
[21]J. Six, E. T. Elliot, K. Paustian, "Soil macroaggregate turnover and microaggregate formation: A mechanism
for carbon sequestration under no-tillage agriculture", Soil Biol. & Biochem., vol. 32, pp. 2099-2103, 2000. [22]C.A. Igwe, "Effects of land use on some structural
properties of an Ultisol in south-eastern Nigeria", Int. Agrophysics, vol. 15, pp. 237-241, 2001.
[23]K. M. Cho, M. A. Zoebisch, S. L.
Ranamukhaarachchi, "Land-use dependent soil quality in the Lam Phra Phloeng watershed, Northeast Thailand'', ISCO 2004 - 13th International Soil Conservation Organization Conference – Brisbane, July 2004, Conserving Soil and Water for Society: Sharing Solutions.
[24]J. A. Magid, A. Gorissen, K. E. Giller, ''In search of the "elusive" active fraction of soil organic matter. Three size-density fractionation methods for tracing the fate of homogenously 14C-labelled plant materials'', Soil Biol. & Biochem., vol. 28, pp. 89-99, 1996. [25]E. G. Gregorich, H. H. Janzen, ''Storage of carbon in
the light fraction and microorganic matter. In Structure and organic matter, soil biota, and C and N mineralization in grassland soils'', Geoderma, vol. 57, pp. 105-128, 1996.
[26]I. Mullar-Harvey, A. S. R. Juo, A. Wilde, ''Soil C, N and P after forest clearance: mineralization rates and spatial variability'', J. of Soil Sci., vol. 36, pp. 585-591, 1985.
[27]T. Girma, ''Effect of cultivation on physical and chemical properties of a Vertisol in Middle Awash Valley, Ethiopia'', Communications in Soil Sci. & Plant Analysis, vol. 29, pp. 287- 295, 1998.
[28]K. R. Islam, M. Kamaluddin, M. K. Bhuiyan, A. Badruddin, ''Comparative performance of exotic and indigenous forest species for tropical semi-evergreen degraded forest land reforestation in Bangladesh'', Land Degrad. Dev., vol. 10, pp. 241–249, 1999. [29]A. Paz-Gonzalez, S. R. Vieira, M. T. Taboada Castro,
''The effect of cultivation on spatial variability of selected properties of an umbric horizon'', Geoderma, vol. 97, pp. 273-292, 2000.
[30]C. Lopez-Fando, M. T. Pardo, ''Soil carbon storage and stratification under different tillage systems in a semi-arid region'', Soil &Tillage Res., vol. 111, pp. 224–230, 2011.
[31]I. A. Jaiyeoba, ''Changes in soil properties due to continuous cultivation in Nigerian semiarid savannah'', Soil &Tillage Res., vol. 70, pp. 91-98, 2003.
http://dx.doi.org/10.22161/ijeab/1.4.5
ISSN: 2456-1878
www.ijeab.com Page |
645
untilled soils'', Biogeochem., vol. 20, pp. 161-193,1993.
[33]I. F. Lepsch, J. R. F. Menk, J. B. Oliveira, ''Carbon storage and other properties of soils under agriculture and natural vegetation in Sao Paulo State, Brazil'', Soil Use Mgt., vol. 10, pp..34-42, 1994.