10
Copyright © 2011-15. Vandana Publications. All Rights Reserved.
Volume-5, Issue-4, August-2015
International Journal of Engineering and Management Research
Page Number: 10-17
A Comparative Study of Loan Performance in Selected Indian Public
Sector Banks
K. Khasimpeera1, Dr. M. Sugunatha Reddy2
1
Assistant Professor, Department of Humanities, K.S.R.M College Of Engineering, Kadapa, INDIA
2
Associate Professor, Department of Humanities, K.S.R.M College Of Engineering, Kadapa, INDIA
ABSTRACT
The paper studies the loan performance of selected public banks. Last decade has witnessed many changes in the banking industry. In this study highlighted the effect of the loans and advances on the Indian Economy. Banks mainly make profit from the difference of interest received and loans paid. Banks are performing the number of functions in addition to its two main functions lending and accepting deposits. Banks grant loans in order to satisfy the growing credit needs of the different sections of the society but since the Commercial banks are profit making Organization thus they have profit making dimension added to advances granted by them. In this paper we have focused on the movement of Loans of the public banking industry by analyzing the data from the year 2010 to 2014.
Keywords---- Term Loans, Cash Credit, Overdraft, Bills Discounted.
I.
INTRODUCTION
This paper studies with the Loan Performance of selected public banks. In the last decades various developments have been witnessed in the Public Banking Sector. Public Banks generally perform two main functions lending & accepting deposits. It facilitates business activities providing money and services that helps in exchange of goods. Lending is the most profitable because interest rates realized on loan is more than those realized on investment. Interest receive on loans are the main source of income for banks. Bankers deploy the residual funds to meet the administrative requirement, give salary to staff, build reserves and pay dividends to the shareholders and satisfy liquidity requirements. An examination of some of the important characteristics of loans provides us an insight into the lending activities of Public banks.
II.
REVIEW OF LITERATURE
With respect to the performances of public banking sector, foreign and national experts have undertaken a number of studies.
Hossain and Bhuiyan (1990) stated that there is no universally accepted operational definition of performance measures. In broad sense performance level of an enterprise can be measured by the extent of its organizational effectiveness. In the context of services rendered towards public the performance of an organization can be viewed as the extent to which its work is carried out within established specifications for goods and services produced, to the general satisfaction of the clientele served, within given cost and time constraints, and in such a manner as to support or contribute to the achievement of the organization objectives.
John P. Bonin, Iftekhar Hasan, Paul Wachtel(2005), Used data from 1996 to 2000 to investigate the effects of ownership, especially by strategic foreign owners, on banks efficiency for eleven transition countries in an unbalanced panel consisting of 225 banks and 856 observations. They concluded that privatization by itself was not sufficient to increase bank efficiency as government-owned banks were not appreciably less efficient than domestic private banks. They also found that foreign-owned banks were more cost-efficient than other banks and they also provided better service, in particular if they had a strategic foreign owner.
11
Copyright © 2011-15. Vandana Publications. All Rights Reserved.
whether the differential in performance between public and private banks was driven by political considerations, the study checked whether the differential widened during the election years and found strong support for this hypothesis. Giuliano Iannotta, Giacomo Nocera, Andrea Sironi (2007) compared the performance and risk of a sample of 181 large banks from 15 European countries over the 1999–2004 periods and evaluated the impact of alternative ownership models; together with the degree of ownership concentration, on profitability, cost efficiency and risk.
Chowdhury and Islam (2007) stated that deposits and loan advances of Nationalized Commercial Banks (NCBs) were less sensitive to interest rate changes than those of Specialized Banks (SBs). So SBs should not make abrupt change in lending or deposit rates by following the NCBs. If NCBs change their lending or deposit rates, their deposits or loans and advances will be less affected than those of SBs. Moreover, deposits of NCBs have higher volume and higher volatility than those of SBs. On the other hand, loans advances of NCBs show a higher volume and higher volatility than those of SBs. However, SBs offer higher deposit rates and charge higher lending rates than NCBs. Hence the interest rate spread of SBs was higher than that of NCBs.
Jahangir, Shill and Hague (2007) stated that the traditional measure of profitability through stockholders equity was quite different in the banking industry from any other sector of business, where loantodeposit ratio worked as a very good indicator of banks' profitability as it depicts the status of asset-liability management of banks. But banks' risk is not only associated with this asset liability management but also related to growth opportunity. Smooth growth ensures higher future returns to holders and there lies the profitability which means not only current profits but future returns as well. So, market size and market concentration index along with return to equity and loan-to-deposit ratio grab the attention of analyzing the banks‟ profitability.
III.
OBJECTIVES OF THE STUDY
This study mainly focuses on the loan performance of the selected public banks The main objectives for the study were:
• To evaluate the growth of lending in selected public banks.
• To ascertain the sources or causes that promoted or weakened the credit programme of public banks.
• To findout the operational efficiency performance of public Sectors Banks.
• To make relevant suggest remedial measures based on the findings of the study.
IV.
ROLE OF THE STUDY
This study is useful to the following;
• Stake holders
• Customer
• Shareholders
• Debtors
• Researchers
Sample size
For the present study, 10 banks have been considered. Baroda, Bank of India, Dena Bank, Indian Bank, IDBI,Indian Overseas Bank, Punjab National Bank, State Bank India, Union Bank. Reference period:
The period for the present study covered 5 years.
2009-10 to 2013-14
Data collection
The data for the present study has been collected from the annual reports and accounts, which was obtained from the branch offices and related sites. All the data related to the study have been rounded off to crore (rupees). This has been done for the following:
V.
TYPES OF CREDIT/ LENDING
SCHEMES OFFERED BY PUBLIC BANKS
Indian Public Banks finances the working capital requirements of their customers. The main credits of financing in our country are Term Loans, Cash Credit, Overdrafts, and Loans Repayable on demand, bills purchased and discounted.
1. CASH CREDIT: It is the main source of lending by banks. Under this scheme bankAdvances loans for a given period on the security of shares, debentures and movable and immovable properties. Generally, banks charges interest on the amount which has been withdrawn by the account holder. The main advantages of this facility are it encourages savings, allows easy payment and provides flexibility. The disadvantages are that it encourages speculation, creates monopolistic tendencies and create inflation pressure
2. OVERDRAFT: When a bank allows its customers having current account to withdraw the amount more than the deposits in the account it is called Overdraft. The Overdrafts depends on the credit of the customers. Such facility is given for short term and emergency purposes. Banks requires security from the customer for such facility. Such facility is given on the current account only. The main advantage of overdrafts is that it provides flexibility and easy and quick arrangement of cash flows. The disadvantages are that it carries high cost and it need to be secured.
12
Copyright © 2011-15. Vandana Publications. All Rights Reserved.
always mature between 1 to 10 years. The term loan is generally provided as working capital for acquiring income producing assets that generate the cash flows for epayment of the loan. They are the source of long term debt; they are generally obtained for financing large expansion, modernization. The advantages of term loans are that they are more flexible as compared to others; they usually have fixed interest rate. The disadvantages of term loans are that it carry repayment facility.
4. BILLS PURCHASED AND DISCOUNTED: It is also a method for borrowing from banks. Under this method bank provides credit against the dated bills of exchange before its maturity. Seller writes such bill and buyer accept it. The buyer promises to pay in the given period. Such bills are discounted by banks and a payment is made to the customers. If the buyer does not make the payment of the bill then the bank gets payment from the seller.
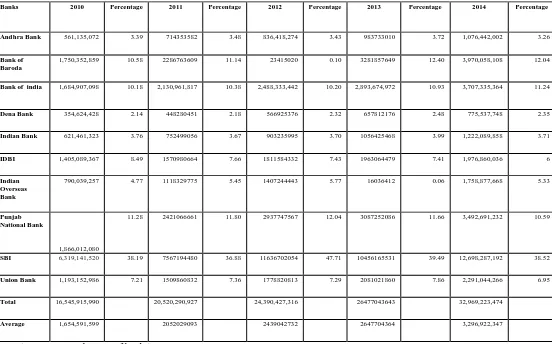
TABLE 1: LOAN PERFORMANCE OF INDIAN PUBLIC BANKS DURING 2009-10 TO 2013-14 (IN CRORE)
Banks 2010 Percentage 2011 Percentage 2012 Percentage 2013 Percentage 2014 Percentage
Andhra Bank 561,135,072 3.39 714353582 3.48 836,418,274 3.43 983733010 3.72 1,076,442,002 3.26
Bank of Baroda
1,750,352,859 10.58 2286763609 11.14 23415020 0.10 3281857649 12.40 3,970,058,108 12.04
Bank of india 1,684,907,098 10.18 2,130,961,817 10.38 2,488,333,442 10.20 2,893,674,972 10.93 3,707,335,364 11.24
Dena Bank 354,624,428 2.14 448280451 2.18 566925376 2.32 657812176 2.48 775,537,748 2.35
Indian Bank 621,461,323 3.76 752499056 3.67 903235995 3.70 1056425468 3.99 1,222,089,858 3.71
IDBI 1,405,089,367 8.49 1570980664 7.66 1811584332 7.43 1963064479 7.41 1,976,860,036 6
Indian Overseas Bank
790,039,257 4.77 1118329775 5.45 1407244443 5.77 16036412 0.06 1,758,877,668 5.33
Punjab National Bank
1,866,012,080
11.28 2421066661 11.80 2937747567 12.04 3087252086 11.66 3,492,691,232 10.59
SBI 6,319,141,520 38.19 7567194480 36.88 11636702054 47.71 10456165531 39.49 12,698,287,192 38.52
Union Bank 1,193,152,986 7.21 1509860832 7.36 1778820813 7.29 2081021860 7.86 2,291,044,266 6.95
Total 16,545,915,990 20,520,290,927 24,390,427,316 26477043643 32,969,223,474
Average 1,654,591,599 2052029093 2439042732 2647704364 3,296,922,347
(Source: Annual report of banks)
Table 1 shows the loan performance of Indian Public Banks during 2010 to 2014. At the end of the year 2010, the amounts of total loans of selected public banks were 16,545,915,990 crore. However, after 5 years, it reached to 32969223474 crore in 2014. It increased by 99 % in 5 years. It was a great achievement for these selected public banks. The overall achievement was an increased by 91.8 % in Andhra Bank, 126.8 % of Bankof Baroda, 120
13
Copyright © 2011-15. Vandana Publications. All Rights Reserved.
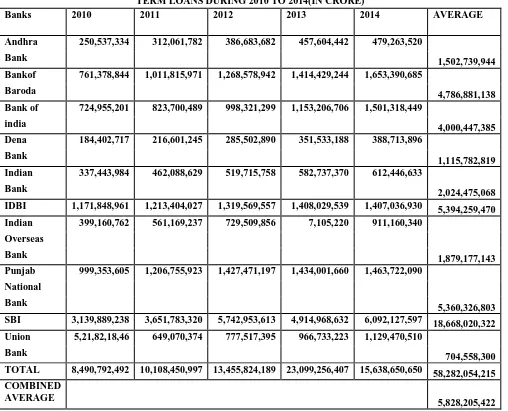
TABLE 2: FINANCIAL PERFORMANCE OF SELECTED PUBLIC BANKS INTERM LOANS DURING 2010 TO 2014(IN CRORE)
Banks 2010 2011 2012 2013 2014 AVERAGE
Andhra 250,537,334 312,061,782 386,683,682 457,604,442 479,263,520
1,502,739,944 Bank
Bankof 761,378,844 1,011,815,971 1,268,578,942 1,414,429,244 1,653,390,685
4,786,881,138 Baroda
Bank of 724,955,201 823,700,489 998,321,299 1,153,206,706 1,501,318,449
4,000,447,385 india
Dena 184,402,717 216,601,245 285,502,890 351,533,188 388,713,896
1,115,782,819 Bank
Indian 337,443,984 462,088,629 519,715,758 582,737,370 612,446,633
2,024,475,068 Bank
IDBI 1,171,848,961 1,213,404,027 1,319,569,557 1,408,029,539 1,407,036,930 5,394,259,470
Indian 399,160,762 561,169,237 729,509,856 7,105,220 911,160,340
1,879,177,143 Overseas
Bank
Punjab 999,353,605 1,206,755,923 1,427,471,197 1,434,001,660 1,463,722,090
5,360,326,803 National
Bank
SBI 3,139,889,238 3,651,783,320 5,742,953,613 4,914,968,632 6,092,127,597 18,668,020,322
Union 5,21,82,18,46 649,070,374 777,517,395 966,733,223 1,129,470,510
704,558,300 Bank
TOTAL 8,490,792,492 10,108,450,997 13,455,824,189 23,099,256,407 15,638,650,650 58,282,054,215
COMBINED AVERAGE
5,828,205,422
(Source: Annual report of banks)
Table 2 shows the Loan Performance of Banks (taken for the study) from the period 2010 to 2014. The loan figures for Andhra bank shows that the volume of term loan increased rapidly in every year of the study period. In 2011, it increased by 24.55% over the previous year. In the year 2012 the growth was 23.91%, 18.34% in 2013 and 4.73% in 2014.
In Bank of Baroda, in 2011 the volume of loans increased by 32.89 % over the previous year in 2012 it increased by25.3% in 2013 increased by 11.49%in 2014 increased by16.89%.
In Bank of India, in 2011 the volume of loans increased by 13.62 % over the previous year in 2012 it increased by21.19% in 2013 increased by 15.51%in 2014 increased by30.18%.
In Dena Bank, in 2011 the volume of loans increased by 17.46 % over the previous year in 2012 it increased by31.81% in 2013 increased by 23.12%in 2014 increased by10.57%.
In Indian Bank, in 2011 the volume of loans increased by 36.93 % over the previous year in 2012 it increased by12.47% in 2013 increased by 12.12%in 2014 increased by05.09%.
In IDBI, in 2011 the volume of loans increased by 3.54 % over the previous year in 2012 it increased by 8.74% in 2013 increased by 6.70%in 2014 decreased by -0.07%.
14
Copyright © 2011-15. Vandana Publications. All Rights Reserved.
In Punjab National Bank, in 2011 the volume of loans increased by 20.75 % over the previous year in 2012 it increased by18.28% in 2013 increased by 0.45%in 2014 increased by02.07%.
In State Bank of India, in 2011 the volume of loans increased by 16.30 % over the previous year in 2012 it increased by 57.26% in 2013 decreased by -14.41%in 2014 increased by23.95%.
In Union Bank, in 2011 the volume of loans increased by 24.38 % over the previous year in 2012 it increased by 19.78% in 2013 increased by 24.33%in 2014 increased by16.88%.
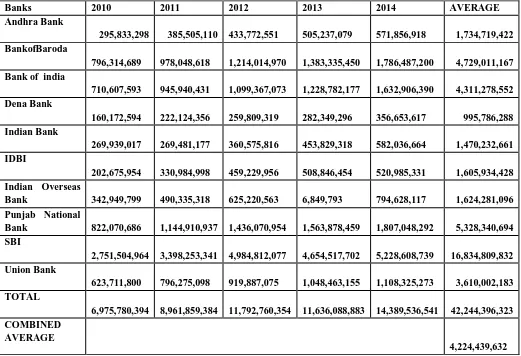
TABLE 3: PERFORMANCE OF SELECTED PUBLIC BANKS IN CASH CREDIT, OVERDRAFT AND LOANS REPAYBLE ON DEMAND DURING 2010 TO 2014(IN CRORE)
Banks 2010 2011 2012 2013 2014 AVERAGE
Andhra Bank 295,833,298 385,505,110 433,772,551 505,237,079 571,856,918 1,734,719,422 BankofBaroda 796,314,689 978,048,618 1,214,014,970 1,383,335,450 1,786,487,200 4,729,011,167 Bank of india
710,607,593 945,940,431 1,099,367,073 1,228,782,177 1,632,906,390 4,311,278,552 Dena Bank 160,172,594 222,124,356 259,809,319 282,349,296 356,653,617 995,786,288 Indian Bank 269,939,017 269,481,177 360,575,816 453,829,318 582,036,664 1,470,232,661 IDBI 202,675,954 330,984,998 459,229,956 508,846,454 520,985,331 1,605,934,428 Indian Overseas Bank 342,949,799 490,335,318 625,220,563 6,849,793 794,628,117 1,624,281,096 Punjab National Bank 822,070,686 1,144,910,937 1,436,070,954 1,563,878,459 1,807,048,292 5,328,340,694 SBI 2,751,504,964 3,398,253,341 4,984,812,077 4,654,517,702 5,228,608,739 16,834,809,832 Union Bank 623,711,800 796,275,098 919,887,075 1,048,463,155 1,108,325,273 3,610,002,183 TOTAL 6,975,780,394 8,961,859,384 11,792,760,354 11,636,088,883 14,389,536,541 42,244,396,323 COMBINED AVERAGE 4,224,439,632
(Source: Annual report of banks)
Table 3 shows the Details of cash credit, Overdraft and Loan Repayable on demand of select public banks from the period 2010 to 2014. The loan figures for Andhra bank shows that the volume of term loan increased rapidly in every year of the study period. In 2011, it increased by 30% over the previous year. In the year 2012
the growth was 12.52%, 16.47% in 2013 and 13.18% in 2014.
15
Copyright © 2011-15. Vandana Publications. All Rights Reserved.
In Bank of India, in 2011 the volume of loans increased by 33.11 % over the previous year in 2012 it increased by 16.21% in 2013 increased by 11.77%in 2014 increased by 32.88%.
In Dena Bank, in 2011 the volume of loans increased by 38.67 % over the previous year in 2012 it increased by 16.96% in 2013 increased by 8.67%in 2014 increased by 26.31%.
In Indian Bank, in 2011 the volume of loans decreased by -0.16 % over the previous year in 2012 it increased by 33.80% in 2013 increased by 25.86%in 2014 increased by 28.25%.
In IDBI, in 2011 the volume of loans increased by 63.30 % over the previous year in 2012 it increased by 27.92% in 2013 increased by 10.80%in 2014 increased by 2.38%.
In Indian Overseas Bank, in 2011 the volume of loans increased by 42.97 % over the previous year in 2012 it increased by 27.50% in 2013.
In Punjab National Bank, in 2011 the volume of loans increased by 39.27 % over the previous year in 2012 it increased by 25.43% in 2013 increased by 8.89%in 2014 increased by 15.54%.
In State Bank of India, in 2011 the volume of loans increased by 23.50 % over the previous year in 2012 it increased by 46.68% in 2013 decreased by -6.62%in 2014 increased by12.33%.
In Union Bank, in 2011 the volume of loans increased by 27.66 % over the previous year in 2012 it increased by 15.52% in 2013 increased by 13.97%in 2014 increased by 5.70%.
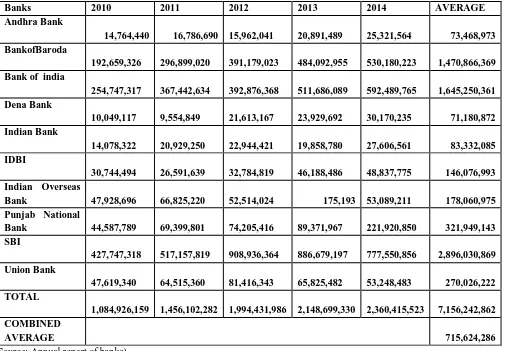
TABLE 4: PERFORMANCE OF SELECTED PUBLIC BANKS IN BILLS PURCHASED AND DISCOUNTED DURING 2010 TO 2014(IN CRORE)
Banks 2010 2011 2012 2013 2014 AVERAGE
Andhra Bank 14,764,440 16,786,690 15,962,041 20,891,489 25,321,564 73,468,973 BankofBaroda 192,659,326 296,899,020 391,179,023 484,092,955 530,180,223 1,470,866,369 Bank of india
254,747,317 367,442,634 392,876,368 511,686,089 592,489,765 1,645,250,361 Dena Bank 10,049,117 9,554,849 21,613,167 23,929,692 30,170,235 71,180,872 Indian Bank 14,078,322 20,929,250 22,944,421 19,858,780 27,606,561 83,332,085 IDBI 30,744,494 26,591,639 32,784,819 46,188,486 48,837,775 146,076,993 Indian Overseas Bank 47,928,696 66,825,220 52,514,024 175,193
53,089,211 178,060,975 Punjab National Bank 44,587,789 69,399,801 74,205,416 89,371,967 221,920,850 321,949,143 SBI 427,747,318 517,157,819 908,936,364 886,679,197 777,550,856 2,896,030,869 Union Bank 47,619,340 64,515,360 81,416,343 65,825,482 53,248,483 270,026,222 TOTAL 1,084,926,159 1,456,102,282 1,994,431,986 2,148,699,330 2,360,415,523 7,156,242,862 COMBINED AVERAGE 715,624,286
(Source: Annual report of banks)
Table 4 shows the Details of Bills purchased and Discounted of select public banks from the period 2010 to 2014. The loan figures for Andhra bank shows that the volume of term loan increased rapidly in every year of the
16
Copyright © 2011-15. Vandana Publications. All Rights Reserved.
In Bank of Baroda, in 2011 the volume of loans increased by 54.10% over the previous year in 2012 it increased by 31.75% in 2013 increased by 23.75%in 2014 increased by 9.52%.
In Bank of India, in 2011 the volume of loans increased by 44.23 % over the previous year in 2012 it increased by 6.92% in 2013 increased by 30.24%in 2014 increased by 15.79%.
In Dena Bank, in 2011 the volume of loans decreased by -4.91 % over the previous year in 2012 it increased by 12.61% in 2013 increased by 10.79%in 2014 increased by 26.07%.
In Indian Bank, in 2011 the volume of loans increased by 48.66 % over the previous year in 2012 it increased by 9.62% in 2013 decreased by -13.44%in 2014 increased by 39.01%.
In IDBI, in 2011 the volume of loans increased by 13.50 % over the previous year in 2012 it increased by 23.28% in 2013 increased by 40.80%in 2014 increased by 5.73%.
In Indian Overseas Bank, in 2011 the volume of loans increased by 39.42 % over the previous year in 2012 it increased by 21.41% in 2013.
In Punjab National Bank, in 2011 the volume of loans increased by 55.64 % over the previous year in 2012 it increased by 6.92% in 2013 increased by 20.43%in 2014 increased by 148.31%.
In State Bank of India, in 2011 the volume of loans increased by 20.90 % over the previous year in 2012 it increased by 75.75% in 2013 decreased by -2.44%in 2014 decreased by -12.30%.
In Union Bank, in 2011 the volume of loans increased by 35.48 % over the previous year in 2012 it increased by 26.19% in 2013 decreased by -19.14%in 2014 decreased by -19.19%.
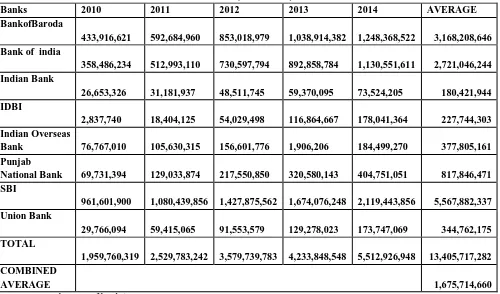
TABLE 5 : PERFORMANCE OF SELECTED PUBLIC BANKS IN ADVANCES OUTSIDE INDIA DURING 2010 TO 2014(IN CRORE)
Banks 2010 2011 2012 2013 2014 AVERAGE
BankofBaroda
433,916,621
592,684,960
853,018,979
1,038,914,382
1,248,368,522
3,168,208,646 Bank of india
358,486,234
512,993,110
730,597,794
892,858,784
1,130,551,611
2,721,046,244 Indian Bank
26,653,326
31,181,937
48,511,745
59,370,095
73,524,205
180,421,944 IDBI
2,837,740
18,404,125
54,029,498
116,864,667
178,041,364
227,744,303 Indian Overseas
Bank
76,767,010
105,630,315
156,601,776
1,906,206
184,499,270
377,805,161 Punjab
National Bank
69,731,394
129,033,874
217,550,850
320,580,143
404,751,051
817,846,471
SBI
961,601,900
1,080,439,856
1,427,875,562
1,674,076,248
2,119,443,856
5,567,882,337 Union Bank
29,766,094
59,415,065
91,553,579
129,278,023
173,747,069
344,762,175
TOTAL
1,959,760,319
2,529,783,242
3,579,739,783
4,233,848,548
5,512,926,948
13,405,717,282 COMBINED
AVERAGE
1,675,714,660
(Source: Annual report of banks)
Table 5 shows the Details of the total loan performance of the select public banks outside india from the period 2010 to 2014. The study concluded that these are the only banks that provide loans outside india also
Bank of Baroda, Bank of india, Indian Bank, IDBI, Indian Overseas Bank, Punjab National Bank, State Bank of India, Union Bank.
17
Copyright © 2011-15. Vandana Publications. All Rights Reserved.
Table 5 shows the Details of the total loan performance of the select public banks outside india from the period 2010 to 2014. The study concluded that these are the only banks that provide loans outside india also Bank of Baroda, Bank of india, Indian Bank, IDBI, Indian Overseas Bank, Punjab National Bank, State Bank of India, Union Bank.
VI.
RECOMMENDATIONS AND
SUGGESTIONS
After having studied the Loan Performance of the selected Public Banks, the following suggestions could improve the operational efficiency of the Public Banking Sector.
They are as follows:
• It was observed that the lending policies of the various Banks were not proper due to having improper financing.
• Banks should provide detailed information to the customer about their lending policy.
• Various Public Banks are not granting Loans outside India, so they could do so to
Expand their business.
REFERENCES
[1] Alejandro Micco, Ugo Panizza, Monica Yañez (2007) “Bank ownership and performance. Does politics matter?” the Journal of Banking & Finance, Volume 31, Issue 1,January 2007, Pages 219–241.
[2] Bonim, Hasan, Wachtel(2005),” Bank Performance, efficiency and ownership in transitioncountries” the Journal of banking & Finance volume 29.Issue1,January, Pages 31-53.
[3] Iannotta, Nocera, Andrea Sironi (2007), “Ownership Structure, risk and performance in thebanking industry” the Journal of banking & Finance volume 31. Issue 7, July 2007,Pages 2127-2149.
[4] Chowdhury, H. A., and Islam, M. S. (2007). “Interest Rate Sensitivity of Loans and Advances: A Comparative Study between Nationalized Commercial Banks (NCBs) and specialized Banks (SBs)”. ASA University Review, Vol.1, No.1.
[5] Hossain, M. K., and Bhuiyan, R. H. (1990). “Performance Dynamics of Nationalized Commercial Banks in Bangladesh” The Sonali Bank. Journal of Business Studies,University of Dhaka, Vol. XI, No. 1.
[6] Reserve Bank of India, Report on Trend and Progress of banking in India, Various issues,Bombay, India www.rbi.org.in.
[7] Andhra Bank,Bank of Baroda,Bank of