Volume 2, Issue 5, May 2013
Page 455
A
BSTRACTRadon is a radioactive gas produced by uranium decay chain. The concentration of this gas in indoor is higher than that of outdoor. An indoor radon survey of a total of 112 locations with one dosimeter per site was carried out at the university of Baghdad- Jadiriyah site. In this study, the concentrations of radon and uranium, radon exhalation rate and background of gamma rays were estimated, and the dose due to indoor radon concentrations was calculated. The minimum, maximum and average of indoor radon concentrations were 22.399±2.182 , 66.447±1.98 and 45.487±1.157
respectively. Radon mass exhalation rate ranged from 2.851±0.1874 to 4.240±0.3797 with an average value of 3.31±0.13 . The average concentrations of radon and uranium in soil samples were 66.73±2.62 and 18.672±0.457 respectively. The average indoor inhalation exposure (radon) effective dose in the buildings was 0.8058 and the background dose rate of gamma rays was 0.0328
Keywords: Radon, Exhalation Rate, Uranium, Gamma ray, CR-39 detector.
1.
I
NTRODUCTIONThe exposure to natural radiation may be due to external or internal according to the body radiation source geometry. External exposure comes mainly from the γ- emitter in man's surrounding environment which impacts the body and
can be harmful to different organs due to the high penetration property of γ- rays. There has been interest in the determination of the average gamma radiation dose to which the population is exposed. The environmental radiation is composed of natural radiation, found in the ground, plus the cosmic radiation together with the contribution to background radiation from nuclear weapons tests and accidents which, eventually, will come down to the ground level. On the other hand, internal exposure comes from swallowing or inhaling radioactive materials as in the case of inhaling radon and its daughters (Saleh, 2007).[1] Radon is radioactive noble inert gas and very mobile gaseous daughter of uranium 238U which is found in all rocks and soil. Radon is very soluble in water (Misdaq et al., 2000).[2] There are three natural isotopes of the radioactive element radon: 222Rn originate in the 238U decay series and has a half-life of 3.82 days, 220Rn (thoron) is in the 232Th chain with a half-life of 55.6 sec and 219Rn (actinon) is in the 235U series with its half-life of 4 sec. The chemical element radon with atomic weight 86 is the heaviest among of the inert gases, which include neon, argon, krypton and xenon as well (Wilkening, 1990).[3] The exposure to radon gas is the most signification element of human exposure to natural sources. It is distinguished from the other three elements of basic background because exposure varies markedly in ordinary circumstances, and because high exposure may be avoided with comparative ease. The most important mechanism of exposure is the inhalation of the short-lived decay products of the principal isotope, 222Rn, with indoor air. Concentrations of 222Rn and its progeny are usually higher in indoor air than in outdoor air, exceptions are in tropical regions, where 222Rn concentrations in well- ventilated dwellings are essentially the same as in outdoor air (UNSCEAR 1993).[4] Sources of radon include soil, water, outdoor air, and building materials, but transport of radon – bearing gas from soil is generally the most predominant source of indoor. The concentration of radon is expressed as Becquerel per cubic meter ( ) or picocuries per liter ( ) (Nagda, 1994).[5] The exposure to high level of radon gas through breathing of air increases the risk of lung cancer (Ramadhan, 2012).[6]
When radon gas is inhaled, densely ionizing alpha particles emitted by deposited short- lived decay products of radon (218Po and 214Po) can interact with biological tissue in the lungs leading to DNA damage (WHO, 2009).[7]
2.
M
ATERIAL ANDM
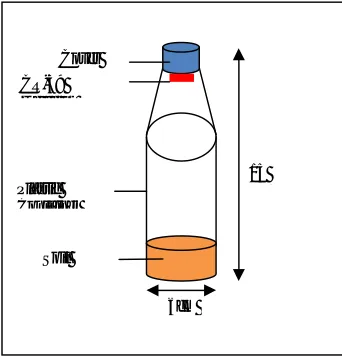
ETHODSThe technique used in this work is based on CR-39 nuclear track detectors (Pershore Mouldings which was made in England). The passive radon dosimeter geometry consists of a closed chamber into which radon diffuses (Al-Jarallah et al., 2003).[8] It is made from plastic cup with a hole at the top cover which is covered with a 5 thickness of soft
Measurement of Radon and Uranium
Concentrations and Background Gamma Rays
at the University of Baghdad -Jadiriyah Site
Shafik S. Shafik1, Aamir A. Mohammed2
1, 2
Volume 2, Issue 5, May 2013
Page 456
sponge layer. The radon dosimeter containing CR-39 (with an area 1 x 1 and 500 at its bottom. The design of the chamber ensures that the aerosol particles and radon decay products are deposited on the sponge from outside and that only radon diffuses through it to the volume of the chamber (Al-Jarallah et al., 2008).[9] The radon dosimeter was used to determine the indoor radon concentrations as shown in the figure (1). The exposure time was 90 days. At the end of the exposure time, the radon dosimeters were collected and the detectors were removed, and then treated using etching solution NaOH with 6.25N in water bath at 70±1°C for 7 h. Then, the CR-39 detectors were washed with distilled water and dried. The tracks produced were counted using optical microscope with 400x magnification as shown in figure (2).Figure 1 The Radon dosimeter.
Figure 2 The tracks counting system..
The radon concentrations were calculated using the following equation (Ajaj, 1999):[10] CRn= --- (1)
where represents the track density resulting from all alpha particles which are present inside the container, represent the time exposure radon and the calibration factor is given by:
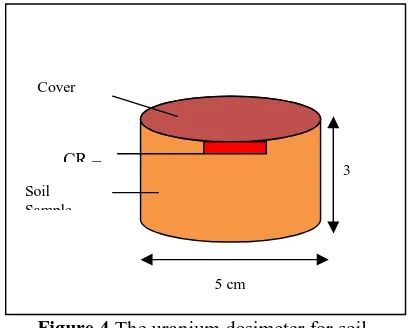
where is the critical angle, R is the alpha particle range and is the radius of container. The radon and uranium dosimeters for soil are shown in figures (3) and (4) respectively.
Figure 3 The radon dosimeter for soil.
6cm
15 cm
Soil Plastic Container
Cover
Volume 2, Issue 5, May 2013
Page 457
Figure 4 The uranium dosimeter for soil.The uranium concentration CU can be determined using a procedure similar to used to determine radon concentration, one can write (Ajaj, 1999, Salama et al., 2006):[10,11]
CU KU T --- (2)
CTh KTh T --- (3)
+ --- (4)
total=CU KU T + CTh KTh T --- (5)
= CU Ku+ CTh KTh --- (6)
CUKU [1+ (CTh / CU) (KTh / KU)] - - - - (7)
The ratio CTh / CU = 4 / T = CU KU [1+ 4 (KTh / KU)] -- (8)
KU =0.25 AU cos2 --- (9)
KTh is given by a formula similar to eq. (9). where is the density, ei is the branching ratio, and AU is the radioactivity concentration of 1 ppm (one part per million ) of Uranium. The mass exhalation rate is given by the following equation(K. Kant et al., 2010):[12] Ex= --- (10)
where Ex is the mass exhalation rate of radon, CRn is the integrated radon exposure (Bq m-3h-1) , M is the mass of the sample, V is the effective volume of radon dosimeter can (figure 1), is the decay constant of radon and T is the exposure time. The annual exposure to potential alpha energy EP (effective dose equivalent) is then related to the average radon concentration CRn by the expression: EP [WLM.Y-1] = --- (11)
where, CRn is in Bq/m3; n is the fraction of time spent indoors; 8760, the number of hours per year; 170, the number of hours per working month and F is the equilibrium factor for radon and was taken as 0.4 as suggested by UNSCEAR, (2000). Radon progeny equilibrium is a very important quantity, where dose calculation are to be made on the basis of the measurement of radon concentration, it may have value 0 < F < 1.Thus, the values of n=0.8 and F=0.4 were used in the present research. From radon exposure the indoor inhalation exposure (radon) effective dose was estimated using the conversion factor of 3.88 by ICRP, (1993) (Mahur, 2012).[13]In addition to the radon and uranium measurements, gamma rays were measured in 75 locations of the University of Baghdad - Jadiriyah site using digital hand-held gamma spectrometer.
3. Results and Discussion
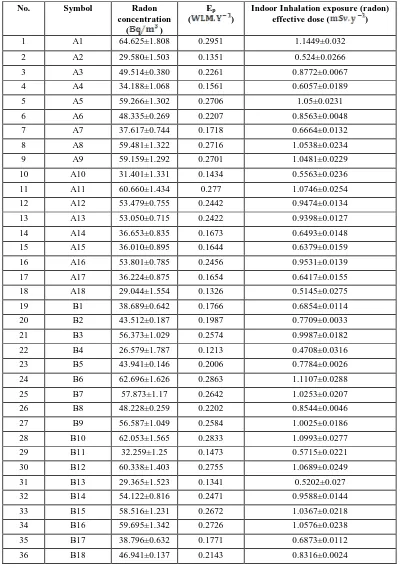
A summary of the results are shown in Table (1), it is observed that the concentration of indoor radon and the indoor inhalation exposure (radon) effective dose inside the buildings at the university of Baghdad-Jadiriyah site. The concentrations of indoor radon were varied from 22.399±2.182 to 66.447±1.98 with an average value of 45.487±1.157 . From the results listed in Table (2), it is observed that the average concentrations of indoor radon in the campus of the university of Baghdad – Jadiriyah site were lowest at the Institute of Genetic Engineering with value of 30.008±1.46 while the highest value was 61.168±1.48 in the College of Khwarizmi Engineering because all college buildings located has lacked of ventilation. The indoor radon concentrations are much lower than the recommended ICRP action level of 200- 600 (ICRP 1993).[14] The average indoor inhalation exposure (radon) effective dose in the buildings was0.8058±0.0205 . Table (3) shows the concentration of radon in soil and mass exhalation rate of radon in Jadiriyah site. The average radon concentration in soil samples was
5 cm
3 cm Soil
Sample Cover
Volume 2, Issue 5, May 2013
Page 458
66.73±2.62 . The radon concentrations in the soil are lower than the allowed limit (800 ) from WHO (WHO,1993).[15] The mass exhalation rate of radon ranged from 2.851±0.1874 to 4.240±0.3797 with an overall average value of 3.31±0.13 Table (4) shows the concentrations of uranium in soil samples taken from the university of Baghdad - Jadiriyah site . Its values varied from 17.145±0.623 to 21.496±1.153 with an overall average value of 18.672±0.457 . The uranium concentration in soil s samples are less than the allowed limit (40 ) from UNSCEAR (UNSCEAR1993).[16] Also the background gamma dose rate was measured in Jadiriyah site, it is equal to 0.0328 . It is lower than the recommended Ministry of Environmental in Iraq action level of 0.08±0.008 (Ministry of Environment/Iraq).[17]Table 1: Radon concentrations, EP and indoor inhalation exposure (radon) effective dose in buildings.
No. Symbol Radon
concentration
( )
Ep
( )
Indoor Inhalation exposure (radon) effective dose ( )
1 A1 64.625±1.808 0.2951 1.1449±0.032
2 A2 29.580±1.503 0.1351 0.524±0.0266
3 A3 49.514±0.380 0.2261 0.8772±0.0067
4 A4 34.188±1.068 0.1561 0.6057±0.0189
5 A5 59.266±1.302 0.2706 1.05±0.0231
6 A6 48.335±0.269 0.2207 0.8563±0.0048
7 A7 37.617±0.744 0.1718 0.6664±0.0132
8 A8 59.481±1.322 0.2716 1.0538±0.0234
9 A9 59.159±1.292 0.2701 1.0481±0.0229
10 A10 31.401±1.331 0.1434 0.5563±0.0236
11 A11 60.660±1.434 0.277 1.0746±0.0254
12 A12 53.479±0.755 0.2442 0.9474±0.0134
13 A13 53.050±0.715 0.2422 0.9398±0.0127
14 A14 36.653±0.835 0.1673 0.6493±0.0148
15 A15 36.010±0.895 0.1644 0.6379±0.0159
16 A16 53.801±0.785 0.2456 0.9531±0.0139
17 A17 36.224±0.875 0.1654 0.6417±0.0155
18 A18 29.044±1.554 0.1326 0.5145±0.0275
19 B1 38.689±0.642 0.1766 0.6854±0.0114
20 B2 43.512±0.187 0.1987 0.7709±0.0033
21 B3 56.373±1.029 0.2574 0.9987±0.0182
22 B4 26.579±1.787 0.1213 0.4708±0.0316
23 B5 43.941±0.146 0.2006 0.7784±0.0026
24 B6 62.696±1.626 0.2863 1.1107±0.0288
25 B7 57.873±1.17 0.2642 1.0253±0.0207
26 B8 48.228±0.259 0.2202 0.8544±0.0046
27 B9 56.587±1.049 0.2584 1.0025±0.0186
28 B10 62.053±1.565 0.2833 1.0993±0.0277
29 B11 32.259±1.25 0.1473 0.5715±0.0221
30 B12 60.338±1.403 0.2755 1.0689±0.0249
31 B13 29.365±1.523 0.1341 0.5202±0.027
32 B14 54.122±0.816 0.2471 0.9588±0.0144
33 B15 58.516±1.231 0.2672 1.0367±0.0218
34 B16 59.695±1.342 0.2726 1.0576±0.0238
35 B17 38.796±0.632 0.1771 0.6873±0.0112
Volume 2, Issue 5, May 2013
Page 459
37 B19 57.659±1.150 0.2633 1.0215±0.0204
38 B20 60.767±1.444 0.2775 1.0765±0.0256
39 B21 33.438±1.138 0.1527 0.5929±0.0202
40 B22 51.443±0.563 0.2349 0.9114±0.00997
41 B23 57.980±1.180 0.2647 1.0272±0.0209
42 B24 56.158±1.008 0.2564 0.9949±0.0179
43 B25 28.722±1.584 0.1311 0.5088±0.0281
44 B26 42.547±0.278 0.1943 0.7538±0.0049
45 B27 60.767±1.444 0.2775 1.0765±0.0256
46 B28 58.730±1.251 0.2682 1.0404±0.0222
47 B29 24.971±1.938 0.114 0.4424±0.0343
48 B30 60.231±1.393 0.275 1.067±0.0249
49 C1 52.407±0.654 0.2393 0.9284±0.0116
50 C2 33.545±1.128 0.1532 0.5943±0.01999
51 C3 65.161±1.859 0.2975 1.1544±0.0329
52 C4 30.330±1.432 0.1385 0.5373±0.0254
53 C5 29.687±1.493 0.1355 0.5259±0.0264
54 C6 48.763±0.309 0.2226 0.8639±0.0055
55 C7 50.478±0.472 0.2305 0.8943±0.0083
56 C8 23.578±2.070 0.1076 0.4177±0.0367
57 C9 27.329±1.716 0.1248 0.4842±0.0304
58 C10 29.472±1.513 0.1346 0.5221±0.0268
59 C11 50.049±0.431 0.2285 0.8867±0.0076
60 D1 29.258±1.533 0.1336 0.5183±0.0272
61 D2 23.364±2.090 0.1067 0.4139±0.037
62 D3 35.796±0.916 0.1634 0.6341±0.0162
63 D4 23.256±2.101 0.1062 0.412±0.0372
64 D5 35.796±0.916 0.1634 0.6341±0.0162
65 D6 22.613±2.161 0.1032 0.4006±0.0383
66 D7 66.447±1.980 0.3034 1.1772±0.0351
67 D8 38.475±0.662 0.1757 0.6816±0.0117
68 D9 22.613±2.161 0.1032 0.4006±0.0383
69 D10 48.871±0.32 0.2231 0.8658±0.0057
70 D11 33.223±1.159 0.1517 0.5886±0.0205
71 D12 31.830±1.290 0.1453 0.5639±0.0229
72 E1 60.231±1.393 0.275 1.067±0.0247
73 E2 58.838±1.261 0.2686 1.0424±0.0223
74 E3 53.372±0.745 0.2437 0.9455±0.0132
75 E4 61.731±1.535 0.2819 1.0936±0.0272
76 E5 56.158±1.008 0.2564 0.9949±0.0179
77 E6 58.409±1.221 0.2667 1.03478±0.0216
78 E7 32.473±123 0.1483 0.5753±0.0218
79 E8 43.405±0.197 0.1982 0.769±0.0035
80 E9 25.721±1.868 0.1174 0.4557±0.0331
81 E10 43.726±0.166 0.1996 0.7747±0.0029
82 F1 61.731±1.535 0.2819 1.0936±0.0272
83 F2 34.188±1.068 0.1561 0.6057±0.0189
Volume 2, Issue 5, May 2013
Page 460
85 F4 46.727±0.117 0.2133 0.8278±0.0021
86 F5 45.763±0.026 0.2089 0.8107±0.0005
87 F6 45.763±0.026 0.2089 0.8107±0.0005
88 F7 38.904±0.622 0.1776 0.6892±0.011
89 F8 33.974±1.088 0.1551 0.6019±0.0193
90 F9 64.839±1.829 0.296 1.1487±0.0324
91 F10 22.828±2.141 0.1042 0.4044±0.0379
92 F11 56.801±1.069 0.2593 1.0063±0.0189
93 G1 63.875±1.737 0.2916 1.1316±0.031
94 G2 63.017±1.656 0.2877 1.1164±0.0293
95 G3 62.160±1.575 0.2838 1.1012±0.0279
96 G4 59.266±1.302 0.2706 1.05±0.0231
97 G5 66.125±1.950 0.3019 1.1715±0.0345
98 G6 55.408±0937 0.253 0.9816±0.0166
99 G7 61.410±1.504 0.2804 1.0879±0.0266
100 G8 58.087±1.191 0.2652 1.0291±0.0211
101 H1 35.367±0.956 0.1615 0.6266±0.0169
102 H2 22.399±2.182 0.1023 0.3968±0.0386
103 H3 57.123±1.099 0.2608 1.012±0.0195
104 K1 31.830±1.290 0.1453 0.5639±0.0229
105 K2 33.866±1.098 0.1546 0.6±0.0194
106 K3 36.760±0.825 0.1678 0.6512±0.0146
107 K4 62.589±1.616 0.2858 1.1088±0.0286
108 M1 25.507±1.888 0.1165 0.4519±0.0334
109 M2 34.509±1.037 0.1576 0.6114±0.0184
110 N1 59.159±1.292 0.2701 1.0481±0.0229
111 N2 37.510±0.754 0.1713 0.6645±0.0133
112 N3 38.475±0.662 0.1757 0.6816±0.0117
where the symbols A’s for College of Science, B’s for College of Engineering, C’s for College of Science for Women, D’s for College of Education for Women, E’s for College of Media, F’s for College of Political Science, G’s for College of Khwarizmi Engineering, H’s for Institute of Laser, K’s for Institute of Accounting and Financial studies, M’s for Institute of Genetic Engineering, and N’s for Institute of Urban and Regional planning.
Table 2: The average radon concentrations in the colleges and institutes in Jadiriyah site
No. Name of College or Institute Average Radon
concentrations( )
1 College of Science 46.227±1.048
2 College of Engineering 48.999±1.072
3 College of Science for Women 40.073±1.189
4 College of Education for Women 34.295±1.440
5 College of Media 49.406±1.060
6 College of Political Science 43.785±0.997
7 College of Khwarizmi Engineering 61.168±1.480
8 Institute of Laser 38.296±1.412
9 Institute of Accounting and Financial studies 41.261±1.207
10 Institute of Genetic Engineering 30.008±1.460
Volume 2, Issue 5, May 2013
Page 461
Table 3: Radon concentrations and mass exhalation rate in soil samples.No. Symbol Radon concentration
( )
Radon mass exhalation rate
( )
1 S1 67.231±0.204 3.335±0.0102
2 S2 65.156±0.643 3.232±0.0318
3 S3 85.491±7.659 4.240±0.3797
4 S4 57.478±3.777 2.851±0.1874
5 S5 58.827±3.226 2.918±0.160
6 S6 66.194±0.219 3.283±0.011
Table 4: Uranium concentrations in Jadiriyah site.
No. Symbol Uranium concentration ( ) Uranium concentration ( )
1 S1 19.206±0.218 1.549±0.0176
2 S2 18.126±0.223 1.462±0.0179
3 S3 21.496±1.153 1.733±0.093
4 S4 17.145±0.623 1.383±0.0503
5 S5 17.766±0.369 1.433±0.0298
6 S6 18.290±0.156 1.475±0.0126
4. Conclusions
The concentrations of radon gas in soil samples and inside buildings were measured using Cr – 39 detectors, and they were found lower than the recommended WHO and ICRP action levels respectively. The concentrations of uranium in soil samples were found lower than the recommended UNSCEAR. The background gamma rays and mass exhalation rates of radon were 0.0328 and 58.922±2.315 , respectively. All results of indoor radon showed that no action is required to reduce radon levels inside the buildings.
References
[1.]F. S. Al- Saleh, "Measurements of indoor gamma radiation and radon concentrations in dwellings of Riyadh city, Saudi Arabia", App. Rad. Isot. 65(2007) – 843-848.
[2.]M. A. Misdaq, A. Merzouki, D. Elabboubi, F. Aitnouh, and S. Berrazzouk, "Determination of radon equivalent alpha- dose in different human organs from water ingestion using SSNTD and dosimetric compartmental models", J. Radioanal. Nucl. Chem., Vol.245, No.3 (2000) 513-520.
[3.]M. Wilkening, "Radon in the Environment", Elsevier Science Publishing Company INC., New York, U.S.A.1990. [4.]UNSCEAR 1993, "Sources and Effects of Ionizing Radiation", United Nations Scientific Committee on the Effects
of Atomic Radiation 1993, Report to the General Assembly.
[5.]N. L. Nagda, " Radon: Prevalence, Measurements, Health Risks and Control", American Society for testing and materials, Philadelphia, PA, 1994.
[6.]R. M. Ramadhan, " Measurement of radon concentration in Iraqi and imported cement", J. Thi- Qar Sci., Vol.3 (2), 2012.
[7.]WHO, "Handbook on Indoor Radon, A public health perspective" World Health Organization, 2009. [8.]M. I. Al-Jarallah and F. Rehman, "Indoor radon measurements in dwellings of four Saudi Arabian cities", Radiat.
Meas. 36(2003) 445-448.
[9.]M. I. Al-Jaralla, F. Rehman, and Abdalla K. "Comparative study of short and long term indoor radon measurements", Radiat. Meas. 43(2008) S471-S474.
[10.]F. Abdul-Kader, " A study of the nuclear track detectors and the use of them in Natural Radioactivity Measurements in Mekkah ", M.sc thesis , Umm Al- Qura University, 1999.
[11.]T. A. Salama, U. Seddik, T. M. Dsoky, A. M. Morsy, and R. El-Asser, "Determination of thorium and uranium contents in soil samples using SSNTDs passive method", Pramana – J. Phys., Vol. 67, No. 2, 2006, pp 269- 276. [12.]K. Kant, R. Rashmi, S. Kuriakose, R. G. Sonkawade, R. P. Chauhan, S.K. Chakarvarti and G. S. Sharma, " Radon
Volume 2, Issue 5, May 2013
Page 462
[13.]A. K. Mahur, "Comparative study of indoor radon, thoron with radon exhalation rate in soil samples in some historical places at Jaipur, Rajasthan, India", Pelagia Research Library: Advances in Applied Science Research, 2012, 3(2): 1085 – 1091.[14.]International Commission on Radiological Protection (ICRP 65), 1993, "Protection against Rn-222 at home and at work", Pergamon Press, Oxford, 1993.
[15.]World Health Organization, WHO, " Guidelines for Drinking –Water Quality", 2nd. Geneva, 1993.
[16.]UNSCEAR 1993 , "sources and effects of ionizing radiation ", united nations scientific committee effects of atomic radiation , Report to the General Assembly , United Nations , New York,1993.
[17.]Ministry of Environment in Iraq, "Indeed Environment Radioactivity for 2007". http://www.moen.gov.iq.


