FTIR Spectroscopic Study on Quantitation of Billirubin in Human
BloodSerum
1
Dr.U. VIJAYA USHASREE, 2Prof.G.PUSHPA CHAKRAPANI, 3Prof.ADEEL AHMAD
1
Department of Physics,Dr.B.R.Ambedkar Open University, Hyderabad - 500033, India.
2
Department of Physics,Dr.B.R.Ambedkar Open University, Hyderabad - 500033, India.
3
Biophysics Research Laboratory, Department of Physics, Nizam College (Autonomous), Osmania University, Hyderabad – 500 001, India
Email: dr_adeelahmad@yahoo.com, ulchala99@gmail.com, pushpanig@gmail.com
1. INTRODUCTION:
IR spectroscopy has been used by Biophysicist and Chemist as a powerful tool to characterize compounds. It has been applied to biology for studying the structure and conformation of molecules like proteins, nucleic acids and lipids. The advances made in instrumentation have paved the way for its utilization in medicine. Besides the application of FTIR for tissue diagnostics, the investigation of body fluids has been gaining importance. The mid–IR region is very useful in the identification of disease patterns using the FT-IR spectrum of human blood serum. Precise quantification of several components such as albumin, total protein, Urea and Billirubin can be achieved using FT-IR spectroscopy.
Zhdanov et al [1] made a comparative study to determine the role of the skeletal base configuration of carbohydrate molecules, using IR and Raman spectroscopy. Theoretical calculations of the vibrational spectra of series of carbohydrates differed in the configuration of CO (CH) bonds in various positions of the pyranosering. The normal vibrations of carbohydrate molecules had, with few exceptions, close or coinciding frequencies; however, they differed greatly in the shape and contribution to the potential energy distribution(PED) of individual groups and bonds. Despite the cooperative character of the vibrations, each compound wascharacterized by a specific set of frequencies with a prevailing contribution to the PED of particular CO and C - C bonds of the molecule. They concluded that vibrations have a peculiar localization and that steric factors play an important role in the vibrational spectra of carbohydrates.
Minesh Patel et al [2] Studied poly acrylic acid and mucus using infrared, 1H and 13C nuclear magnetic resonance, and X-ray photoelectron spectroscopes and differential scanning Calorimetry, which supported the hypothesis that hydrogen bonds, formed between the carboxylic acid functionality of the muco - adhesive material (polyacrylic acid) and the glycoprotein component of mucus, play a significant role in the process of muco-adhesion. Theyfound fewer H-bonded interactions between the components than within the bulk of the pure muco-adhesive agent and pH of the medium influenced the structures of both the poly acrylic acid and the mucus, which in turn determine the nature and the extent of muco-adhesive interactions.
Davis and Mauer [3] highlighted the principles of FTIR spectroscopic analysis of bacteria; the advantagesand disadvantages of FT- IR applied to bacterial analysis; various sampling techniques; spectral manipulation statistical analysis of spectra; and applications in pathogen detection.
Jana kopikova et al [4] used FT-IR spectroscopy for the estimation of isolated high molecule fractions andalso for the identification of food hydrocolloids in confectionery jellies and food supplements. The simple comparisonof spectra of standards and samples proved that this technique is useful for the monitoring of food hydrocolloids inparticular food products.
SyedIsmailAhmadetal[5] estimated concentrationof glucose in human urine.They reported specific bandat1034 cm-1for glucose and established are lation between glucose concentration in urine and Transmission(%) of IR band.
Vijaya Ushasree and AdeelAhmad[6]reported IR spectroscopic data on human blood and its constituents.IR an analysis was made on whole blood, plasma and serum. The characteristic spectral bands pertaining to fibrinogen,
Abstract: The Quantitation of Billirubin has been achieved using FTIR spectroscopy. The FTIR spectra of
human blood serum samples are recorded in Mid IR region 4000-400cm1.The normal blood serum is treated with Billirubin at different concentrations and FTIR spectra are recorded, which confirm the specific peaks related to Billirubin. A plot between concentration of Billirubin and percentage of absorbance has shown linear relationship. The study being complementary to chemical analysis is very much useful for the estimation of Billirubin in the blood serum of patients suffering from diabetes and renal diseases.
hemoglobin, erythrocyte membrane lipids and other plasma proteins were identified. They explored the possibility of disease an analysis by IR spectroscopy.
Vijaya Ushasree and AdeelAhmad[7] presented IR spectroscopic data on humanblood of groups A, B, AB and O. IR analysis is was made on 90% packed erythrocytes. The characteristic spectral band pertaining to antigens were discussed. They suggested the possibility of identification of blood antigens spectroscopically.
Vijaya Ushasree and AdeelAhmad[8] reported IR spectroscopic data on blood of patients suffering from
Diabetes mellitus. IR analysis was made on whole blood, plasma and serum. The characteristic spectral bands pertaining to glucose in the medium of blood were identified.
Vijaya Ushasree and AdeelAhmad[9] made quantification of glucose in human blood serum in mid-IR region
4000-400cm-1 using FTIR Spectroscopy. The FT-IR spectra confirmed the specific peak for glucose. A graph between
concentration of glucose and intensity of absorption showed a linear relation. There was an increase in the intensity of absorption.
Vijaya Ushasree and Adeelahmad [10] made quantification of Urea in human blood serum in mid-IR region
4000-400cm-1 using FTIR Spectroscopy. The FT-IR spectra confirmed the specific peak for Urea. A graph between
concentrations in the intensity of absorption.
The present study is an attempt to quantities Billirubin in human blood serum by using FTIR spectroscopy.
2. MATERIALS AND METHODS:
The blood samples were collected from healthy donors without adding anticoagulant and serum was separated by removing blood clot. The serum was treated with research grade (SD Fine Chem) Billirubin at the concentrations of 100,200,300,400 and 500 gm/dL. Infrared spectrum was recorded in FTIR spectrophotometer (Shimadzu FTIR - 8400S) in the range of 4000 cm-1 to 400 cm-1. The resolution was kept at 4 cm-1 and scanning time was fixed at 38 Sec. A total number of 10 scans were carried out on each sample.
3. RESULTS AND DISCUSSION:
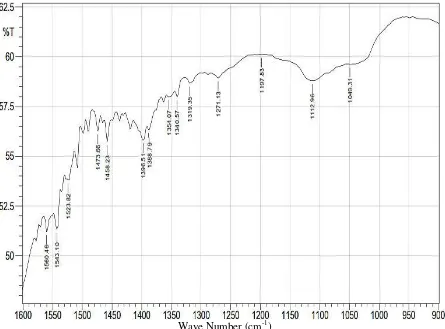
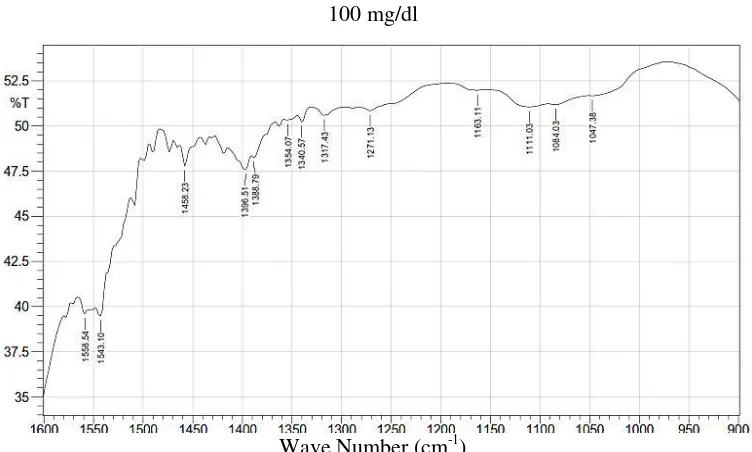
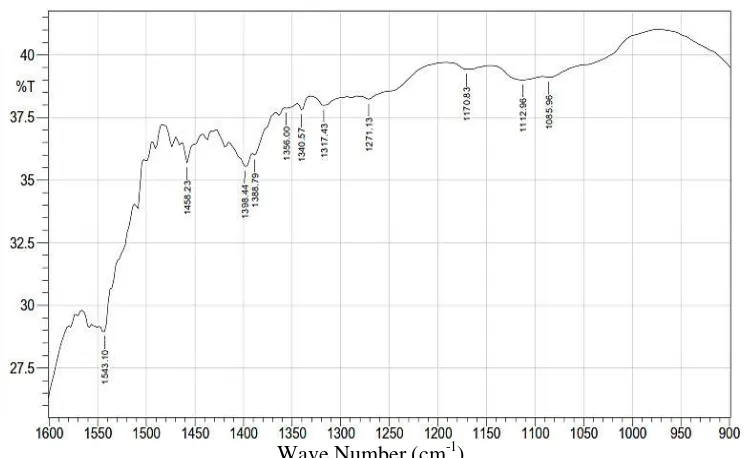
Fig. 1(a),(b),(c),(d) and (e) shows FTIR spectra of human blood serum treated with Bilirubin of concentration 100, 200, 300, 400, 500 gm/dl. Spectra show a series of bands, in the range of 4000 cm-1 and 400 cm-1, related to functional groups of proteins, lipids and carbohydrates and other inorganic materials present in the blood serum.
Wave Number (cm-1)
100 mg/dl
Wave Number (cm-1)
Fig. 1(b). FTIR spectrum of human blood serum treated with Billirubin of concentration 200 mg/dl
Wave Number (cm-1)
Fig.1(c). FTIR spectrum of human blood serum treated with Billirubin of concentration 300 mg/dl
Fig. 1(d). FTIR spectrum of human blood serum treated with Billirubin of concentration 400 mg/dl
Wave Number (cm-1)
Fig.1(e). FTIR spectrum of human blood serum treated with Billirubin of concentration 500 mg/dl
Table-1. gives FTIR data obtained from Fig.1(a),(b),(c),(d),(e). around 1400 cm-1. The table reveals IR absorbance, calculated from transmittance (%), in blood serum treated with Bilirubin of concentration ranging from 100 to 500 mg/dl with an interval of 100 mg/dl. A plot is drawn between Absorbance on Y – axis and Bilirubin concentration (gm/dl) on X – axis . It is a straight line with +ve slope and also +ve Y – intercept, the linear regression equation of which is
A = 0.0003 X + 0.2426, where A is absorbance and X is Bilirubin concentration and R2 = 0.98.
Table 1. – Absorbance of IR bands of serum treated with Bilirubin of different concentration
Concentration of Bilirubin
(mg/dl) Absorbance
100 0.28
200 0.30
300 0.34
400 0.38
500 0.40
y = 0.0003x + 0.2426 R² = 0.9818
0 0.05 0.1 0.15 0.2 0.25 0.3 0.35 0.4 0.45
0 100 200 300 400 500 600
A
b
sor
b
an
ce
Concentration of Billirubin (mg/dl)
Fig. 2. A plot between Absorbance and concentration of Bilirubin added to blood serum
4. CONCLUSION:
The study concludes that FT-IR spectrum is a finger print of molecular constituent of the sample. The absorbance positions of band at wave numbers reveal the qualitative characteristics of chemical bonds and structure of the molecule, while the intensities of absorption provide quantitative information of the sample. The present study suggests that the most specific band for Billirubin is around at1400 cm-1 in human blood serum. The Quantitation of Billirubin in blood serum IR spectroscopically is very much useful for its estimation in blood of patients suffering from diabetes and kidney diseases.
REFERENCES:
1. R G Zhdanov, V M Andrianov, M K Marchewka, Fourier transform IR and Raman spectroscopy and structure
of carbohydrates, J. Mol. Stru.,Vol. 436(1997), pp. 637-654.
2. Minesh M. Patel, John D. Smart, Thomas G. Nevell, Richard J. Wen, Peter J. Eaton, and John Tsibouklis, Mucin/Poly acrylic acid Interactions:A Spectroscopic Investigation of Mucoadhesion, Bio macromolecules, Vol.4(2003), pp. 1184-1190.
3. R Davis and L J Mauer, Fourier transform infrared (FT-IR) spectroscopy: A rapid tool for detection and analysis of foodborne pathogenicbacteria, Curre research, technology and education topics in applied microbiology and Microbial biotechnology, (ed.) A. Mendez Vilas,Formatex, 2010.
4. A Jana copikova, AndriySynytsya, Marcela Cerna, JitkaKaasova and MiroslavaNovotna, Application of FTIR
spectroscopy in detection offood hydro-colloids in confectionery jellies and food supplements, Czech. J. Food. Sci., Vol. 19, No. 2(2001), pp. 51- 56.
5. SyedIsmailAhmad,PRavi Prasad and AdeelAhmad, Quantitation of glucose in urine by Fourier Transform Infrared Spectroscopy, J. Pure &Appl.Phys.,Vol.22,No.4(2010), pp.645–649.
6. U.VijayaUshasree, KaleemAhmedJaleeli and AdeelAhmad, A study on infrared spectroscopy of humanblood,
Int.J.Sci.,Env.Tech.,Vol.5, No 3(2016),pp. 1189– 1192.
7. U.VijayaUshasree and AdeelAhmad, FTIR spectroscopic analysis on human blood groups,
Int.J.Sci.Env.Tech.,Vol.6, No 3(2017),pp. 1685 – 1689.
8. U.VijayaUshasree and AdeelAhmad, A study on infrared spectroscopy of humanblood of patients suffering from Diabetes mellitus,Int.J. Innov.Sci.Res.,Vol. 6, No. 6(2017), pp. 1025 - 1027.