PRIMARY RESEARCH
Identification of a three-long noncoding
RNA prognostic model involved competitive
endogenous RNA in kidney renal clear cell
carcinoma
Di Zhang
1,2†, Song Zeng
1,2†and Xiaopeng Hu
1,2*Abstract
Background: Long noncoding RNA (lncRNA) is generally identified as competing endogenous RNA (ceRNA) that
plays a vital role in the pathogenesis of kidney renal clear cell carcinoma (KIRC), the most common subtype of renal cell carcinoma with poor prognosis and unclear pathogenesis. This study established a novel ceRNA network and thus identified a three-lncRNA prognostic model in KIRC patients.
Methods: Differentially expressed genes (DEGs) were screened out from The Cancer Genome Atlas (TCGA)
data-base. The lncATLAS was applied to determine the differentially expressed lncRNAs (DElncRNAs) of the cytoplasm. The miRcode, miRDB, miRTarBase, and TargetScan databases were utilized to predict the interactions of DElncRNAs, DEmiRNAs, and DEmRNAs. Cytoscape was used to construct the ceRNA network. Then, a lncRNA prognostic model (LPM) was constructed based on ceRNA-related lncRNA that was significantly related to overall survival (OS), and its predictive ability was evaluated. Moreover, an LPM-based nomogram model was constructed. The significantly differ-ent expression of genes in the LPM was validated in an independdiffer-ent clinical cohort (N = 21) by quantitative RT-PCR.
Results: A novel ceRNA regulatory network, including 73 lncRNAs, 8 miRNAs, and 21 mRNAs was constructed.
Functional enrichment analysis indicated that integral components of membrane and PI3K–Akt signaling pathway represented the most significant GO terms and pathway, respectively. The LPM established based on three lncRNAs (MIAT, LINC00460, and LINC00443) of great prognostic value from the ceRNA network was proven to be independent of conventional clinical parameters to differentiate patients with low or high risk of poor survival, with the AUC of 1-, 5- and 10-year OS were 0.723, 0.714 and 0.826 respectively. Furthermore, the nomogram showed a better predictive value in KIRC patients than individual prognostic parameters. The expression of MIAT and LINC00460 was significantly upregulated in the KIRC samples, while the expression of LINC00443 was significantly downregulated compared with the adjacent normal samples in the clinical cohort, TCGA, and GTEx.
Conclusion: This LPM based on three-lncRNA could serve as an independent prognostic factor with a tremendous
predictive ability for KIRC patients, and the identified novel ceRNA network may provide insight into the prognostic biomarkers and therapeutic targets of KIRC.
© The Author(s) 2020. This article is licensed under a Creative Commons Attribution 4.0 International License, which permits use, sharing, adaptation, distribution and reproduction in any medium or format, as long as you give appropriate credit to the original author(s) and the source, provide a link to the Creative Commons licence, and indicate if changes were made. The images or other third party material in this article are included in the article’s Creative Commons licence, unless indicated otherwise in a credit line to the material. If material is not included in the article’s Creative Commons licence and your intended use is not permitted by statutory regulation or exceeds the permitted use, you will need to obtain permission directly from the copyright holder. To view a copy of this licence, visit http://crea-tivecommons.org/licenses/by/4.0/. The Creative Commons Public Domain Dedication waiver ( http://creativecommons.org/publicdo-main/zero/1.0/) applies to the data made available in this article, unless otherwise stated in a credit line to the data.
Open Access
*Correspondence: [email protected]
†Di Zhang and Song Zeng contributed equally to this work 1 Department of Urology, Beijing Chao-Yang Hospital, Capital Medical
Background
Kidney renal clear cell carcinoma (KIRC) is the most common and aggressive malignant subtype of renal cell carcinoma that has a poor prognosis and high mortality in an advanced stage due to the lack of useful biomark-ers and treatments [1]. Currently, there is a multitude of established treatments for KIRC, such as surgical resec-tion, nonspecific immune approach, targeted therapy against vascular endothelial growth factor, and novel immunotherapy agents. Despite these treatments, about 50% of KIRC patients develop metastases, and the 5-year survival rate of these patients is still lower than 10% [2]. At present, the commonly used clinical prognostic markers of KIRC include the pathological grade system and tumor node metastasis (TNM) stage, microvascular invasion, tumor necrosis, and invasion of the collecting system [3]. These clinicopathological risk factors exhibit valuable but insufficient prediction of prognosis and esti-mation for subsets of KIRC patients. Previous researches have established some prognostic models and nomo-grams that incorporate necrosis, blood tests such as lac-tate dehydrogenase, hemoglobin, platelets, and calcium levels, prior nephrectomy, symptoms, and performance status [4, 5]. However, due to the intratumor heterogene-ity of KIRC, these prognostic models cannot accurately predict the prognosis of KIRC patients in different sub-sets [6]. Therefore, the identification of useful prognos-tic biomarkers and therapeuprognos-tic targets is urgingly needed to predict more accurately and improve the outcome of KIRC patients.
Long noncoding RNA (lncRNA), broadly defined as noncoding RNA molecules longer than 200 nucleotides, has gained emerging attention in cancer biology due to their direct and indirect regulatory roles [7]. It has been reported to be aberrantly expressed in a broad spec-trum of tumors, leading to tumor initiation and pro-gression [8]. Hence, they may serve as promising a new type of biomarkers for tumor diagnosis, prognosis, even in targeted gene therapy [9]. More recently, extensive research has explored the lncRNA expression profiling in the KIRC with the development of sequencing technol-ogy [10–12]. The determination of their interaction with other molecules and functional analysis is also widely investigated in recent years [13]. Notably, the subcellu-lar localization of lncRNAs holds valuable clues to their molecular function [14]. In the cell nucleus, lncRNA could modulate nuclear functions, such as transcription, chromatin regulation, and variable splicing [15]. While in the cytoplasm, lncRNA could modulate mRNA mainly
through the competitive endogenous RNA (ceRNA) regulation mechanism, according to the ceRNA hypoth-esis proposed by Salmena et al. in which lncRNA could compete with miRNA as a natural sponge and therefore indirectly regulate mRNA expression [16, 17]. Since pro-posed, numerous studies have investigated and validated that this lncRNA–miRNA–mRNA regulatory mecha-nism participates in tumor occurrence, progression, and metastasis and the potential prognosis of colorec-tal cancer, hepatocellular carcinoma, and lung cancer [18–20]. However, the overall regulatory functions of the lncRNA–miRNA–mRNA ceRNA network remain unclear, and the predictive accuracy of the prognostic model based on multiple lncRNAs’ expression is virtually worthy of exploring in KIRC patients.
In this study, we constructed a ceRNA network to elu-cidate the potential interaction of differentially expressed lncRNAs (DElncRNAs), DEmiRNAs, and DEmRNAs in KIRC. The subcellular localization of lncRNA was restricted to be cytoplasm in this network. We also explored the vital role of the network in KIRC. Subse-quently, we identified the potential prognostic values of lncRNAs included in the ceRNA network and confirmed a lncRNA prognostic model (LPM) signature, which was established based on three lncRNAs of great prognostic value for overall survival (OS), as an independent prog-nostic biomarker. Then, we demonstrated a nomogram with better prediction value in KIRC patients than indi-vidual prognostic parameters. In the end, an independent clinical cohort was used to verify the significantly differ-ent expression of genes in the LPM by RT-PCR.
Methods
Data source and processing
The level 3 gene expression files and the corresponding clinical information for 530 KIRC patients, and miRNA expression files for 516 KIRC patients were retrieved from The Cancer Genome Atlas (TCGA) database (https ://porta l.gdc.cance r.gov/) (up to October 10, 2019). Sequencing was performed by Illumina HiSeq RNA-Seq and Illumina HiSeq miRNA-Seq platforms, respectively. Among these KIRC patients, a total of 539 KIRC sam-ples and 72 adjacent normal samsam-ples in RNA sequence data, 545 KIRC samples and 71 adjacent normal samples in miRNA sequence data were subjected to subsequent analyses. The annotation data (antisense, lincRNA, and sense_intronic/sense overlapping, lncRNAs, 3′ over-lapping ncRNAs, processed transcripts, antisense, and sense intronic) of probes of the TCGA RNA sequence
data was recognized as lncRNA, and annotation data (protein-coding) as mRNA by using the GENCODE data-base (https ://www.genco degen es.org/). Then, the gene symbols were annotated based on the Homo_sapiens. GRCh38.84.chr.gtf file, which was downloaded from the Ensembl database (https ://asia.ensem bl.org/index .html).
Identification of differentially expressed genes (DEGs)
We compared the KIRC samples and adjacent normal samples to identify DEGs by using DESeq 2 R package (Version 1.27.19; http://www.bioco nduct or.org/packa ges/ devel /bioc/html/DESeq 2.html) with a rigorous threshold as |log2-fold change (FC)| > 2.0 and FDR < 0.01 [21]. Then a heat map and volcano plot were drawn by using the heatmap R package (Version 1.0.1; https ://www.rdocu menta tion.org/packa ges/pheat map) and ggpubr R pack-age (Version 0.2.4; https ://www.rdocu menta tion.org/ packa ges/ggpub r) in R software (Version 3.6.0; https :// www.r-proje ct.org/), to visualize the hierarchical cluster-ing analysis of the identified DEGs.
Construction of the ceRNA network
The lncATLAS database (http://lncat las.crg.eu/) was used to identify the DElncRNAs located in the cytoplasm [22]. Then the DEmiRNAs which potentially interacted with DElncRNAs located in the cytoplasm were pre-dicted using the miRcode (http://www.mirco de.org/), a comprehensive searchable map of putative microRNA target sites in the long noncoding transcriptome [23]. Subsequently, the target DEmRNAs of DEmiRNA were predicted using miRDB (http://mirdb .org/), miRTarBase (http://mirta rbase .mbc.nctu.edu.tw/php/index .php) and TargetScan (http://www.targe tscan .org/vert_72/) data-bases [24–26]. After that, Cytoscape software (Version 3.7.2; http://www.cytos cape.org/) was utilized to visual-ize and construct the ceRNA network [27].
Functional enrichment analysis
The pathway and functional enrichment analysis were carried out by utilizing KO-Based Annotation System (KOBAS) (Version 3.0; http://kobas .cbi.pku.edu.cn/) and the Database for Annotation, Visualization and Integrated Discovery (DAVID) (Version: 6.8; https :// david .ncifc rf.gov/), to investigate the potential biological implications of the ceRNA network [28, 29]. Significant GO terms and pathways were visualized by the GOplot (Version 1.0.2; https ://cran.r-proje ct.org/web/packa ges/ GOplo t/index .html) and ggalluvial (Version 0.9.1; https ://www.rdocu menta tion.org/packa ges/ggall uvial ) R pack-ages, respectively.
Construction and validation of a lncRNA‑related prognostic model
Among 530 KIRC patients with RNA-sequencing data and clinical information, 514 KIRC patients were sub-jected to subsequent analyses after excluded according to the following criteria: (1) patients without survival infor-mation including survival time and status; (2) patients without complete lncRNA expression data; (3) patients who did not meet endpoint with following time less than 30 days. The expression files of DElncRNAs involved in the ceRNA network from 514 KIRC patients were ana-lyzed through univariate Cox regression analysis in which genes were regarded as significant at P < 0.001, to identify the prognostic value of the DElncRNAs for OS. Then, the least absolute shrinkage and selection opera-tor (LASSO) model with L1-penalty, performed by using the glmnet R package (Version 2.0-16; https ://www.rdocu menta tion.org/packa ges/glmne t), was utilized to further select crucial lncRNAs from the prognostic DElncRNAs. In this method, a sub-selection of lncRNAs involved in KIRC patient prognosis was identified by shrinkage of the regression coefficient. Eventually, quite a few indica-tors with a weight of nonzero remained, and most of the potential indicators were shrunk to zero. In this process, we subsampled the data set 1000 times and selected the lncRNAs that were repeated > 900 times [30]. Finally, a risk-score based LPM was established using the regres-sion coefficients from the multivariate Cox regresregres-sion analysis in which genes were regarded as significant at
P < 0.01. The formula of the risk score was constructed as follows:
β stands for the regression coefficient of genes, X repre-sents the expression level of genes, and N is the number of significant genes derived from the multivariate Cox regression analysis. The univariate and multivariate Cox regression analysis was performed utilizing the survival R package (Version 3.1-8; https ://www.rdocu menta tion. org/packa ges/survi val). Subsequently, the X-tile 3.6.1 software was applied to calculate the optimal cutoff to classify the KIRC patients into high- and low-risk groups [31]. Risk heatmap applying pheatmap R package (Ver-sion 1.0.12; https ://www.rdocu menta tion.org/packa ges/ pheat map) was employed to cluster the expression files of core lncRNAs, which constructed the LPM, in the high- and low-risk groups. Then, the Kaplan–Meier (K–M) survival analysis and time‐dependent receiver operat-ing characteristic (ROC) curves were used to evaluate the ability of the LPM to predict OS and disease-spe-cific survival (DSS) by utilizing the survminer (Version
Risk score=
N
0.4.3; https ://www.rdocu menta tion.org/packa ges/survm iner) and survival ROC (Version 1.0.3; https ://www. rdocu menta tion.org/packa ges/survi valRO C) R package, respectively.
Independence of the LPM from traditional clinical features
514 KIRC patients with complete lncRNA expression data, survival information, and complete clinical infor-mation, including age, gender, pathologic stage, and histologic grade, were subjected to subsequent univari-ate and multivariunivari-ate Cox regression analyses, to assess the independent prognostic ability of the LPM for KIRC patients. To better visualize the prognostic value of risk score and clinical features, the forest plot was performed by using the ggplot2 R package (Version 3.2.1; https :// www.rdocu menta tion.org/packa ges/ggplo t2).
Construction and validation of the nomogram
To further determine the predictive accuracy of model efficiency for 1-, 5-, 10-year, we constructed a novel nomogram, contained significant clinical features and calibration plots, based on the results of the multivariate Cox analysis utilizing the rms R package (Version 5.1-4; https ://cran.r-proje ct.org/web/packa ges/rms/index .html). The concordance index (C-index) was applied to evaluate the discrimination of the nomogram, and it was corrected by a bootstrap method with 1000 resam-ples [32]. Besides, the C-index and time-dependent ROC curves were performed to compare the predictive accura-cies of the nomogram and individual prognostic factors. Besides, decision curve analysis (DCA) was performed to assess the clinical utility of the nomogram by comparing the benefits of different models.
Gene set enrichment analysis (GSEA)
GSEA (Version 4.0; http://softw are.broad insti tute.org/ gsea/index .jsp) was performed between high- and low-risk groups to identify the potential biological function of LPM [33]. An annotated gene set file (c5.bp.v7.0.entrez. gmt) was chosen as the reference gene set. The threshold was set at levels of |NES| > 2 and P < 0.01.
Clinical samples and quantitative RT‑PCR
In the clinical validation set, a total of 21 KIRC patients with KIRC samples and adjacent normal samples were selected according to the following criteria: (1) patients treated in the Beijing Chao-Yang Hospital; (2) patients who did not undergo treatment before surgery. Two individual experienced pathologists confirmed the final diagnosis of samples through identifying the morphol-ogy of the samples stained with H&E. This study was carried out in accordance with The Code of Ethics of the World Medical Association (Declaration of Helsinki). All
patients signed the informed consent, and this study was approved by the ethics committees of Beijing Chao-Yang Hospital.
Total RNA of samples was extracted using the Trizol method, and then we synthesized cDNA via reverse tran-scription using the HiScript III RT SuperMix Kit (R323-01, Vazyme, China). The expression levels of lncRNAs were quantitated using the AceQ qPCR SYBR Green Master Mix (R323-01, Vazyme, China) by the ABI 7500 real-time PCR system (Applied Biosystems, Foster City, CA, USA). The primers used in this study are listed in Additional file 1: Table S1. Target lncRNA levels were normalized against GAPDH standards and calculated using the 2-ΔΔCt method.
Validation of lncRNAs expression
The expression levels of the three lncRNAs were verified in KIRC patients with paired KIRC samples and adja-cent normal samples from the Beijing Chao-Yang cohort (N = 21) and TCGA cohort (N = 72), respectively, by using Wilcoxon signed-rank test. Additionally, the differ-ent expression analysis was further performed in KIRC samples (N = 523) from TCGA and normal samples (N = 100) from the match TCGA normal and Genotype-Tissue Expression (GTEx) data by utilizing Gene Expres-sion Profiling Interactive Analysis (GEPIA2) (http://gepia 2.cance r-pku.cn/#index ) [34]. P <0.05 was considered sig-nificant, and all statistical tests were two-sided.
Results
Identification of differentially expressed genes between KIRC samples and adjacent normal samples
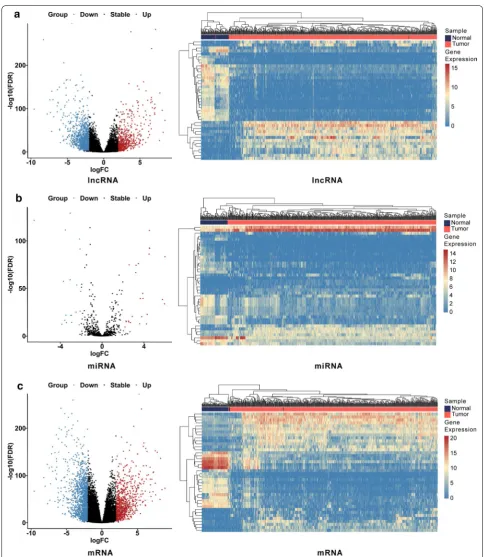
A total of 539 KIRC samples and 72 adjacent normal sam-ples were utilized to screen DElncRNAs and DEmRNAs; 545 KIRC samples and 71 adjacent normal samples were utilized to screen DEmiRNAs. The DESeq 2 R package was performed to identify differentially expressed genes with a strict cutoff threshold of |log2 FC | > 2 and an adjusted P <0.01. Compared with normal samples, 2015 DElncRNAs, 47 DEmiRNAs, and 2314 DEmRNAs were differentially expressed, among which 1461 lncRNAs, 19 miRNAs, and 1511 mRNAs were upregulated as well as 554 lncRNAs, 28 miRNAs and 803 mRNAs were down-regulated (Additional file 1: Table S2). The heat maps and volcano plots of DEGs between KIRC samples and adja-cent normal samples were shown in Fig. 1.
Construction of the ceRNA network
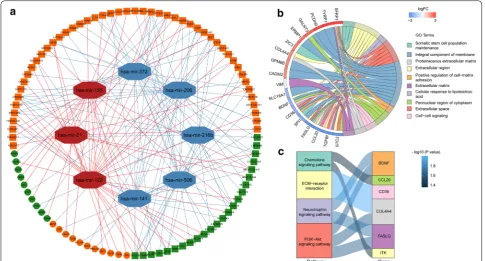
the nucleus because the endogenous competition role of lncRNAs is mainly exhibited in the cytoplasm. The detailed distribution information for the DElncRNAs was shown in Additional file 1: Table S3. Then the remained DElncRNAs were put into the miRcode database to iden-tify the potential miRNAs targeting lncRNAs. However, only 12 out of predicted miRNAs were selected after taking the intersection with 47 DEmiRNAs. We then utilized the databases of miRDB, miRTarBase, and Tar-getScan to identify the downstream target mRNAs with reference to the 12 DEmiRNAs. In addition, we selected potential mRNAs that only shared by all three databases to enhance the veracity of the prediction. The results showed that 21 out of 2314 DEmRNAs were identified. Finally, a total of 73 DElncRNAs, 8 DEmiRNAs, and 21 DEmRNAs were eventually incorporated into the KIRC-associated ceRNA regulatory network by applying Cytoscape software (Fig. 2a, Additional file 1: Table S4).
To further reveal the biological functions and pathways associated with the ceRNA network, GO and KEGG enrichment analysis was performed via KOBAS and DAVID. The results of GO analysis indicated that the DEmRNAs involved in the ceRNA network were mainly
enriched in the “Integral component of membrane”, “Extracellular region” and “Extracellular space” (Fig. 2b). Moreover, the results from KEGG analysis showed that the DEmRNAs were particularly enriched in “ECM-receptor interaction”, “Chemokine signaling pathway”, “PI3K–Akt signaling pathway” and Neurotrophin signal-ing pathway (Fig. 2c).
Construction of an LPM and evaluation of its predictive ability
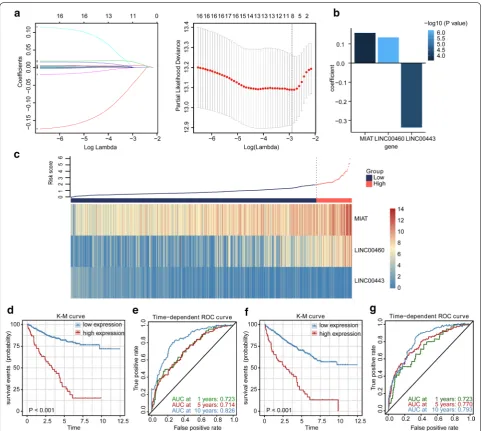
To consider whether those DElncRNAs involved in the ceRNA network were closely related to the OS of KIRC patients in the TCGA cohort, we performed the univariate Cox regression to identify the prognos-tic value of the DElncRNAs for OS. The result indi-cated that 17 of the 73 DElncRNAs were significantly related to OS (Additional file 1: Table S5). To further find crucial lncRNAs from the prognostic DElncR-NAs, we applied LASSO estimation and selected 8 lncRNAs which appeared > 900 times out of 1000 repetitions (Fig. 3a). Subsequently, multivariate Cox regression analysis was utilized to select lncRNAs with the best prognostic value and calculate their
Fig. 2 Construction and functional enrichment analysis of the ceRNA network. a The ceRNA regulatory network in KIRC. Red octagons represent
relative coefficients, to further establish a risk-score based LPM. Finally, we constructed the LPM to pre-dict patient survival with the risk score of each patient calculated as follows: risk score = (0.13383 × expres-sion level of LINC00460) + (− 0.33667 × expression level of LINC00443) + (0.15751 × expression level of MIAT) (Fig. 3b). Furthermore, we applied the X-tile software to find the optimal cutoff value of risk scores, and patients with risk scores greater than 2.08 (n = 65)
were classified into the high‐risk group, while those with risk scores less than or equal to 2.08 (n = 449) were allocated to the low‐risk group. The risk score distribution and lncRNA expression data are shown in Fig. 3c. The K-M survival analysis indicated that the high-risk patients had a shorter OS than the low-risk patients (Fig. 3d). Additionally, the high-risk group showed a 3.768-fold higher risk [95% confidence inter-val (CI) 2.254–6.299, P <0.001)] than the low-risk
Fig. 3 The lncRNA prognostic model. a Lasso-penalized Cox regression analysis of 17 DElncRNAs. Ten-fold cross-validation was applied to
group. The time-dependent ROC curve analysis vali-dated the great prognostic value of the LPM (Fig. 3e). The area under the ROC curve (AUC) of the LPM for OS was 0.723 at 1 year, 0.714 at 5 years, and 0.826 at 10 years. Besides, the high-risk patients had a shorter DSS than the low-risk patients with a 5.561-fold higher risk (95% CI 2.929–10.560, P <0.001), and the AUC of the LPM for DSS was 0.723 at 1 year, 0.770 at 5 years and 0.793 at 10 years (Fig. 3f, g).
High risk indicated an enhanced immune phenotype
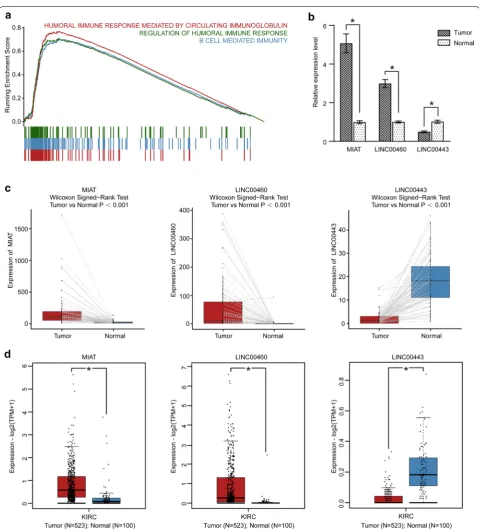
To explore the biological pathways associated with the LPM, GSEA was conducted between the 65 high-risk and 449 low-risk KIRC patients in the TCGA KIRC cohort. The result revealed that the high-risk patients were sig-nificantly related to 223 biological processes (Additional file 1: Table S6), in which the top 3 immune processes were HUMORAL_IMMUNE_RESPONSE_MEDI-ATED_BY_CIRCULATING_IMMUNOGLOBULIN (NES = 3.512, size = 136), B_CELL_MEDIATED_IMMU-NITY (NES = 3.364, size = 199) and REGULATION_ OF_HUMORAL_IMMUNE_RESPONSE (NES = 3.172, size = 124) (P <0.01) (Fig. 4a). Therefore, the high-risk score may confer an enhanced immune phenotype.
Validation of lncRNAs in the clinical cohort, TCGA, and GTEx
According to the above analysis in the TCGA KIRC cohort, the three lncRNAs (LINC00460, LINC00443, MIAT) involved in the ceRNA network could serve as potential prognostic predictors for KIRC patients. To verify the validity and reliability of the results, the expres-sion of the three lncRNAs were analyzed between 21 diagnosed KIRC samples and 21 adjacent normal samples through RT-PCR. As shown in Fig. 4b, the results dem-onstrated that the expression of MIAT and LINC00460 was significantly upregulated in the KIRC samples, while the expression of LINC00443 was significantly down-regulated compared with the adjacent normal sam-ples. In addition, we performed the difference analysis of three-lncRNA expression by using the TCGA paired samples and GEPIA2, to verify the expression of MIAT, LINC00460, LINC00443 further. A consistent find-ing with that of the clinical KIRC cohort was elucidated (Fig. 4c, d).
Stratification analysis of OS for the LPM
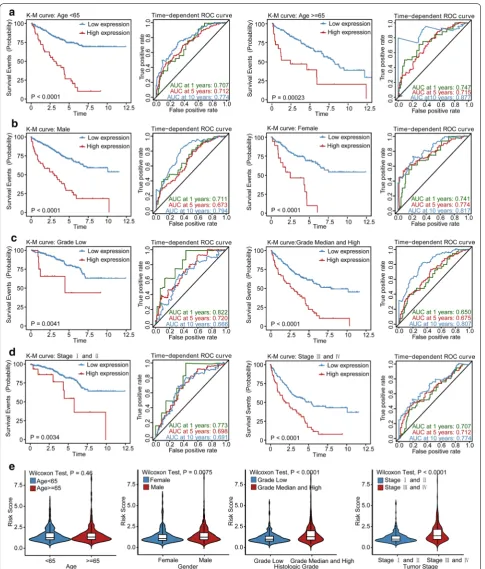
Stratification analysis was performed to determine whether the prognostic value of the LPM would remain stable in different subgroups. Therefore, patients in the TCGA KIRC cohort were classified into two groups according to age, sex, tumor grade, and tumor stage, respectively. As shown in Fig. 5, patients in the high-risk
group showed worse survival compared to those in the low-risk group in patients with grade low or grade median and high tumors, stage I and II or stage III and IV tumors, younger or older, and male or female patients. Besides, the LPM still remained a stable and great predic-tive ability for KIRC patients in distinct subgroups.
LPM is independent of traditional clinical features for KIRC Patients
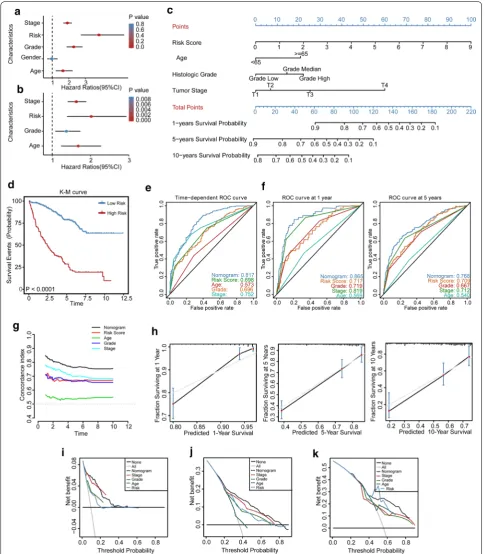
To identify whether the LPM is an independent clinical prognostic factor for KIRC patients, we firstly performed the univariate Cox regression analysis and demonstrated that the LPM was significantly associated with OS [Haz-ard ratio (HR): 3.809, 95% CI 2.720–5.330, P <0.001; Fig. 6a]. Then clinical characteristics, including gen-der, age, pathologic stage, and histological grade were adjusted by multivariate Cox regression analysis, and the result indicated that the LPM remained an independent prognostic factor with an HR of 2.020 in the TCGA KIRC cohort (95% CI 1.387–2.940, P <0.001; Fig. 6b).
Construction and validation of an LPM‑based nomogram model
novel method for evaluating prediction models [37]. As a result, the nomogram model showed a better net ben-efit and broader threshold probability. Thus, it provided
the best clinical utility compared with other independent prognostic factors (1-year OS: Fig. 6i; 5-year OS: Fig. 6j; 10-year OS: Fig. 6k).
Fig. 4 GSEA and validations of three lncRNAs. a GSEA plot shows the top three immune processes associated with high risk score. b The barplot
exhibits the expressions of MIAT, LINC00443, and LINC00460 evaluated by RT-PCR in 21 KIRC samples and paired adjacent normal samples. ∗P < 0.05 versus control. c The differential expression patterns of three lncRNAs in 72 KIRC patients with paired KIRC and adjacent normal samples from TCGA.
Discussion
As the most common and lethal subtype of renal carci-noma, KIRC is driven by distinct driver gene mutations and complex molecular alterations [38]. Though many effective treatments have been developed for KIRC, the unsatisfied survival rate and intolerant of chemother-apy make it an emerging need for new therapeutic tar-gets and prognostic biomarkers to improve the clinical outcomes of KIRC patients in the future [39]. Previous research has demonstrated that lncRNAs located in the cytoplasm could regulate mRNA transcription indispen-sably, primarily through ceRNA regulatory networks, making these attractive molecules targets and prognostic biomarkers [40]. However, few studies have investigated the specific functions and prognostic value of lncRNAs involved in the ceRNA regulatory network in KIRC, especially lncRNAs located in the cytoplasm.
In this study, we established a lncRNA-miRNA-mRNA ceRNA regulatory network and constructed a novel three-lncRNA-based LPM that could identify KIRC patients who had a high risk of poor prognosis. There-fore, it is feasible to divide the KIRC patients into dif-ferent subgroups with a particular risk score, and such patient stratification could clinically contribute to more individualized management for patients. The lncRNAs (MIAT, LINC00460, and LINC00443) that constitute the LPM could be regarded as individual targets in the future, and they may provide better performance in com-bination, depending on their prognostic significance. To facilitate the clinical use of the LPM, we further devel-oped a nomogram to help clinicians conduct accurate risk assessment for individual KIRC patients. Since it consisted of the LPM and several independent clini-cal prognostic factors (age, histologic grade, and tumor stage), the nomogram can better account for intratumor heterogeneity of KIRC. Thus, it can accurately predict the prognosis of KIRC patients in different subsets.
An increasing number of researches have found that tumor initiation and progression can be primarily repre-sented by DEGs [41, 42]. Thus, we firstly identified DEGs as candidate genes for the ceRNA network by using the DESeq 2 method, which has better statistical power in sensitivity and precision than edgeR and DESeq. To the best of our knowledge, our study is the first to use the DESeq 2 method in constructing the ceRNA network in KIRC, resulting in an inconsistent finding in the DEGs screen with other studies [35, 43]. Since the lncRNA– miRNA–mRNA interaction in the ceRNA network only presented in the cytoplasm [44], we excluded the lncR-NAs that only located in the nucleus to enhance the accu-racy of prediction. Based on these improved methods, we constructed a novel ceRNA network. In this network, the potential binding sites of the three lncRNA (LINC00443,
LINC00460, and MIAT) on the targeted DEmiRNAs were showed in Additional file 1: Table S7. Moreover, in order to explore the potential biological function of the ceRNA network, we performed the KEGG pathway anal-ysis. The result indicated that the function of the ceRNA network might be associated with the PI3K–Akt signal-ing pathway, a cancer-related pathway. Current stud-ies have shown that the PI3K–Akt pathway is activated in many types of cancers. Recent large-scale integrated analyses have provided the genetic alteration rates of the PI3K–Akt pathway in KIRC patients, reiterating the criti-cal role of the PI3K–Akt pathway [45]. Previous studies have reported that the PI3K–Akt pathway could closely connected with the VHL–HIF pathway, forming a large signaling network contributing to cell proliferation, migration, and invasion in KIRC [46].
In addition, we revealed that the LPM was still an independent prognostic factor in KIRC patients after adjusting traditional clinical characteristics. This result indicated that LPM has the potential to improve the predictive power of traditional factors. Hence, we construct a nomogram model that combines the LPM and other independent clinical prognostic factors. The results of time-dependent ROC curve analysis, C-index, and DCA demonstrated the robust prognostic value of the nomogram for KIRC patients. The primary advantage of this model lies in developing a unique LPM based clinically associated risk scoring system for KIRC patients.
Our study provided new insight into developing a prognostic score system for KIRC patients. It can eas-ily separate patients with poor prognosis from patients with good prognosis. Since this LPM consisted of only three lncRNAs which can be measured by PCR, it was convenient, cost-effective, and easy to use in clini-cal application. The nomogram, a unique LPM based clinically associated risk scoring system, had robust prognostic value for KIRC patients, and it could be a promising tool for clinicians in the future. Further-more, clinicians can develop more individualized treat-ment regimens for patients with different prognosis assessed by nomogram, and this will make treatment more targeted. However, our study is limited because we only validated the expression of three lncRNAs in the individual clinical cohorts, and it would be better if clinical cohorts could validate the prognostic value of LPM. Besides, prospective studies are further needed to perform to confirm its predictive ability.
Conclusions
In conclusion, we successfully constructed a novel ceRNA regulatory network, which narrowed the scope of predicting prognostic biomarkers and therapeutic targets for KIRC. Besides, we identified and validated an LPM which is based on three lncRNAs involved in the ceRNA network, and it has independent and great prognostic value for KIRC patients.
Supplementary information
Supplementary information accompanies this paper at https ://doi. org/10.1186/s1293 5-020-01423 -4.
Additional file 1: Table S1. List of primers used for RT-PCR. Table S2. Dif-ferentially expressed lncRNAs, miRNAs, and mRNAs between KIRC samples and adjacent normal samples. Table S3. The subcellular distribution of lncRNAs in the ceRNA network. Table S4. The interactions of the ceRNA network in KIRC. Table S5. Seventeen lncRNAs associated with overall survival in KIRC. Table S6. The results of GSEA. Table S7. The potential binding sites of three lncRNAs (LINC00443, LINC00460 and MIAT) on the targeted DEmiRNAs in the ceRNA network.
Abbreviations
KIRC: Kidney renal clear cell carcinoma; lncRNA: Long noncoding RNA; ceRNA: Competitive endogenous RNA; DElncRNAs: Differentially expressed lncRNAs; LPM: lncRNA prognostic model; OS: Overall survival; TCGA : The Cancer Genome Atlas; LASSO: Least absolute shrinkage and selection operator; K-M: Kaplan–Meier; ROS: Receiver operating characteristic; DSS: Disease-specific survival; C-index: Concordance index; DCA: Decision curve analysis; GSEA: Gene set enrichment analysis; GTEx: Genotype-Tissue Expression; GEPIA2: Gene Expression Profiling Interactive Analysis; CI: Confidence interval; AUC : Area under the ROC curve; HR: Hazard ratio.
Acknowledgements Not applicable.
Authors’ contributions
ZD initiated the study and organized; ZD, ZS and Hu XP designed and carried out bioinformatics analyses, statistical analyses, drew figures and drafted the manuscript; ZS and Hu XP participated in modifying the manuscript. All authors read and approved the final manuscript.
Funding Not applicable.
Availability of data and materials
All data generated or analyzed during this study are included in this published article and its additional information files.
Ethics approval and consent to participate
This study was carried out in accordance with The Code of Ethics of the World Medical Association (Declaration of Helsinki). All patients signed the informed consent, and this study was approved by the ethics committees of Beijing Chao-Yang Hospital.
Consent for publication Not applicable.
Competing interests
The authors declare that they have no competing interests.
Author details
1 Department of Urology, Beijing Chao-Yang Hospital, Capital Medical
Univer-sity, No. 8 GongTi South Road, 100020 Beijing, China. 2 Institute of Urology,
Capital Medical University, Beijing, China.
Received: 5 February 2020 Accepted: 14 July 2020
References
1. Capitanio U, Montorsi F. Renal cancer. Lancet. 2016;387(10021):894–906.
https ://doi.org/10.1016/s0140 -6736(15)00046 -x.
2. Barata PC. Treatment of renal cell carcinoma: current status and future directions. CA Cancer J Clin. 2017;67:507–24.
3. Ljungberg B, Albiges L, Abu-Ghanem Y, Bensalah K, Dabestani S, Fernández-Pello S, et al. European association of urology guidelines on renal cell carcinoma: the 2019 update. Eur Urol. 2019;75(5):799–810. https ://doi.org/10.1016/j.eurur o.2019.02.011.
4. Heng DY, Xie W, Regan MM, Warren MA, Golshayan AR, Sahi C, et al. Prog-nostic factors for overall survival in patients with metastatic renal cell car-cinoma treated with vascular endothelial growth factor-targeted agents: results from a large, multicenter study. J Clin Oncol. 2009;27(34):5794–9.
https ://doi.org/10.1200/jco.2008.21.4809.
5. Frank I, Blute ML, Cheville JC, Lohse CM, Weaver AL, Zincke H. An out-come prediction model for patients with clear cell renal cell carcinoma treated with radical nephrectomy based on tumor stage, size, grade and necrosis: the SSIGN score. J Urol. 2002;168(6):2395–400. https ://doi. org/10.1097/01.ju.00000 35885 .91935 .d5.
heterogeneity of clear cell renal cell carcinoma biomarkers. Eur Urol. 2014;66(5):936–48. https ://doi.org/10.1016/j.eurur o.2014.06.053. 7. Prensner JR, Chinnaiyan AM. The emergence of lncRNAs in cancer
biol-ogy. Cancer Discov. 2011;1(5):391.
8. Lin C, Yang L. Long noncoding RNA in cancer: wiring signaling cir-cuitry. Trends Cell Biol. 2018;28(4):287–301. https ://doi.org/10.1016/j. tcb.2017.11.008.
9. Schmitt AM, Chang HY. Long noncoding RNAs in cancer pathways. Can-cer Cell. 2016;29(4):452–63. https ://doi.org/10.1016/j.ccell .2016.03.010. 10. Deng M, Blondeau JJ, Schmidt D, Perner S, Muller SC, Ellinger J.
Identifica-tion of novel differentially expressed lncRNA and mRNA transcripts in clear cell renal cell carcinoma by expression profiling. Genom Data. 2015;5:173–5. https ://doi.org/10.1016/j.gdata .2015.06.016. 11. Blondeau JJ, Deng M, Syring I, Schrodter S, Schmidt D, Perner S, et al.
Identification of novel long non-coding RNAs in clear cell renal cell carcinoma. Clin Epigenetics. 2015;7:10. https ://doi.org/10.1186/s1314 8-015-0047-7.
12. Fachel AA, Tahira AC, Vilella-Arias SA, Maracaja-Coutinho V, Gimba ER, Vignal GM, et al. Expression analysis and in silico characterization of intronic long noncoding RNAs in renal cell carcinoma: emerg-ing functional associations. Mol Cancer. 2013;12(1):140. https ://doi. org/10.1186/1476-4598-12-140.
13. Quinn JJ, Chang HY. Unique features of long non-coding RNA biogenesis and function. Nat Rev Genet. 2016;17(1):47–62. https ://doi.org/10.1038/ nrg.2015.10.
14. Chen LL. Linking long noncoding RNA localization and function. Trends Biochem Sci. 2016;41(9):761–72. https ://doi.org/10.1016/j. tibs.2016.07.003.
15. Batista PJ, Chang HY. Long noncoding RNAs: cellular address codes in development and disease. Cell. 2013;152(6):1298–307. https ://doi. org/10.1016/j.cell.2013.02.012.
16. Salmena L, Poliseno L, Tay Y, Kats L, Pandolfi PP. A ceRNA hypothesis: the Rosetta Stone of a hidden RNA language? Cell. 2011;146(3):353–8. https ://doi.org/10.1016/j.cell.2011.07.014.
17. Cesana M, Cacchiarelli D, Legnini I, Santini T, Sthandier O, Chinappi M, et al. A long noncoding RNA controls muscle differentiation by function-ing as a competfunction-ing endogenous RNA. Cell. 2011;147(2):358–69. https :// doi.org/10.1016/j.cell.2011.09.028.
18. Wang L, Cho KB, Li Y, Tao G, Xie Z, Guo B. Long noncoding RNA (lncRNA)-mediated competing endogenous rna networks provide novel potential biomarkers and therapeutic targets for colorectal cancer. Int J Mol Sci. 2019. https ://doi.org/10.3390/ijms2 02257 58.
19. Afify AY, Ibrahim SA, Aldamsisi MH, Zaghloul MS, El-Ekiaby N, Abdelaziz AI. Competing endogenous RNAs in hepatocellular carcinoma-the pinnacle of rivalry. Semin Liver Dis. 2019;39(4):463–75. https ://doi. org/10.1055/s-0039-16884 42.
20. Yang J, Qiu Q, Qian X, Yi J, Jiao Y, Yu M, et al. Long noncoding RNA LCAT1 functions as a ceRNA to regulate RAC1 function by sponging miR-4715-5p in lung cancer. Mol Cancer. 2019;18(1):171. https ://doi. org/10.1186/s1294 3-019-1107-y.
21. Love MI, Huber W, Anders S. Moderated estimation of fold change and dispersion for RNA-seq data with DESeq2. Genome Biol. 2014;15(12):550.
https ://doi.org/10.1186/s1305 9-014-0550-8.
22. Mas-Ponte D, Carlevaro-Fita J, Palumbo E, Hermoso Pulido T, Guigo R, Johnson R. LncATLAS database for subcellular localization of long non-coding RNAs. RNA. 2017;23(7):1080–7. https ://doi.org/10.1261/rna.06081 4.117.
23. Jeggari A, Marks DS, Larsson E. miRcode: a map of putative microRNA target sites in the long non-coding transcriptome. Bioinformatics. 2012;28(15):2062–3. https ://doi.org/10.1093/bioin forma tics/bts34 4. 24. Wong N, Wang X. miRDB: an online resource for microRNA target
predic-tion and funcpredic-tional annotapredic-tions. Nucleic Acids Res. 2015;43(Database issue):D146–52. https ://doi.org/10.1093/nar/gku11 04.
25. Chou CH, Chang NW, Shrestha S, Hsu SD, Lin YL, Lee WH, et al. miRTarBase 2016: updates to the experimentally validated miRNA-target interac-tions database. Nucleic Acids Res. 2016;44(D1):D239–47. https ://doi. org/10.1093/nar/gkv12 58.
26. Agarwal V, Bell GW, Nam JW, Bartel DP. Predicting effective microRNA target sites in mammalian mRNAs. Elife. 2015. https ://doi.org/10.7554/ elife .05005 .
27. Shannon P, Markiel A, Ozier O, Baliga NS, Wang JT, Ramage D, et al. Cytoscape: a software environment for integrated models of biomo-lecular interaction networks. Genome Res. 2003;13(11):2498–504. https ://doi.org/10.1101/gr.12393 03.
28. Xie C, Mao X, Huang J, Ding Y, Wu J, Dong S, et al. KOBAS 2.0: a web server for annotation and identification of enriched pathways and diseases. Nucleic Acids Res. 2011;39(Web Server issue):W316–22. https ://doi.org/10.1093/nar/gkr48 3.
29. Dennis G Jr, Sherman BT, Hosack DA, Yang J, Gao W, Lane HC, et al. DAVID: database for annotation, visualization, and integrated discovery. Genome Biol. 2003;4(5):P3.
30. Long J, Wang A, Bai Y, Lin J, Yang X, Wang D, et al. Development and validation of a TP53-associated immune prognostic model for hepatocellular carcinoma. EBioMedicine. 2019;42:363–74. https ://doi. org/10.1016/j.ebiom .2019.03.022.
31. Camp RL, Dolled-Filhart M, Rimm DL. X-tile: a new bio-informatics tool for biomarker assessment and outcome-based cut-point optimization. Clin Cancer Res. 2004;10(21):7252–9. https ://doi.org/10.1158/1078-0432.Ccr-04-0713.
32. Kiran M, Chatrath A, Tang X, Keenan DM, Dutta A. A prognostic signa-ture for lower grade gliomas based on expression of long non-coding RNAs. Mol Neurobiol. 2019;56(7):4786–98. https ://doi.org/10.1007/ s1203 5-018-1416-y.
33. Subramanian A, Tamayo P, Mootha VK, Mukherjee S, Ebert BL, Gillette MA, et al. Gene set enrichment analysis: a knowledge-based approach for interpreting genome-wide expression profiles. Proc Natl Acad Sci U S A. 2005;102(43):15545–50. https ://doi.org/10.1073/pnas.05065 80102 . 34. Tang Z, Kang B, Li C, Chen T, Zhang Z. GEPIA2: an enhanced web server
for large-scale expression profiling and interactive analysis. Nucleic Acids Res. 2019;47(W1):W556–60. https ://doi.org/10.1093/nar/gkz43 0. 35. Jiang W, Guo Q, Wang C, Zhu Y. A nomogram based on 9-lncRNAs
signature for improving prognostic prediction of clear cell renal cell carcinoma. Cancer Cell Int. 2019;19:208. https ://doi.org/10.1186/s1293 5-019-0928-5.
36. Deng X, Lin D, Chen B, Zhang X, Xu X, Yang Z, et al. Development and validation of an IDH1-associated immune prognostic signature for diffuse lower-grade glioma. Front Oncol. 2019;9:1310. https ://doi. org/10.3389/fonc.2019.01310 .
37. Vickers AJ, Elkin EB. Decision curve analysis: a novel method for evalu-ating prediction models. Med Decis Making. 2006;26(6):565–74. https ://doi.org/10.1177/02729 89x06 29536 1.
38. Hakimi AA, Voss MH, Kuo F, Sanchez A, Liu M, Nixon BG, et al. Tran-scriptomic profiling of the tumor microenvironment reveals distinct subgroups of clear cell renal cell cancer: data from a randomized phase III trial. Cancer Discov. 2019;9(4):510–25. https ://doi.org/10.1158/2159-8290.Cd-18-0957.
39. Barbieri CE, Chinnaiyan AM, Lerner SP, Swanton C, Rubin MA. The emergence of precision urologic oncology: a collaborative review on biomarker-driven therapeutics. Eur Urol. 2017;71(2):237–46. https ://doi. org/10.1016/j.eurur o.2016.08.024.
40. Guttman M, Rinn JL. Modular regulatory principles of large non-coding RNAs. Nature. 2012;482(7385):339–46. https ://doi.org/10.1038/natur e1088 7.
41. Zhou S, Treloar AE, Lupien M. Emergence of the noncoding cancer genome: a target of genetic and epigenetic alterations. Cancer Discov. 2016;6(11):1215–29. https ://doi.org/10.1158/2159-8290.Cd-16-0745. 42. Reis-Filho JS, Pusztai L. Gene expression profiling in breast
can-cer: classification, prognostication, and prediction. Lancet.
2011;378(9805):1812–23. https ://doi.org/10.1016/s0140 -6736(11)61539 -0.
43. Zhang C, Huang D, Liu A, Xu Y, Na R, Xu D. Genome-wide screening and cohorts validation identifying novel lncRNAs as prognostic biomarkers for clear cell renal cell carcinoma. J Cell Biochem. 2020;121(3):2559–70. https ://doi.org/10.1002/jcb.29478 .
44. Cao Z, Pan X, Yang Y, Huang Y, Shen HB. The lncLocator: a subcellular localization predictor for long non-coding RNAs based on a stacked ensemble classifier. Bioinformatics. 2018;34(13):2185–94. https ://doi. org/10.1093/bioin forma tics/bty08 5.
•fast, convenient online submission •
thorough peer review by experienced researchers in your field • rapid publication on acceptance
• support for research data, including large and complex data types •
gold Open Access which fosters wider collaboration and increased citations maximum visibility for your research: over 100M website views per year •
At BMC, research is always in progress.
Learn more biomedcentral.com/submissions
Ready to submit your research? Choose BMC and benefit from:
46. Guo H, German P, Bai S, Barnes S, Guo W, Qi X, et al. The PI3K/AKT pathway and renal cell carcinoma. J Genet Genomics. 2015;42(7):343–53. https :// doi.org/10.1016/j.jgg.2015.03.003.
47. Zeng JH, Lu W, Liang L, Chen G, Lan HH, Liang XY, et al. Prognosis of clear cell renal cell carcinoma (ccRCC) based on a six-lncRNA-based risk score: an investigation based on RNA-sequencing data. J Transl Med. 2019;17(1):281. https ://doi.org/10.1186/s1296 7-019-2032-y. 48. Liu H, Ye T, Yang X, Lv P, Wu X, Zhou H, et al. A panel of four-lncRNA
sig-nature as a potential biomarker for predicting survival in clear cell renal cell carcinoma. J Cancer. 2020;11(14):4274–83. https ://doi.org/10.7150/ jca.40421 .
49. Li K, Sun D, Gou Q, Ke X, Gong Y, Zuo Y, et al. Long non-coding RNA linc00460 promotes epithelial-mesenchymal transition and cell migra-tion in lung cancer cells. Cancer Lett. 2018;420:80–90. https ://doi. org/10.1016/j.canle t.2018.01.060.
50. Liu X, Wen J, Wang H, Wang Y. Long non-coding RNA LINC00460 promotes epithelial ovarian cancer progression by regulating micro-RNA-338-3p. Biomed Pharmacother. 2018;108:1022–8. https ://doi. org/10.1016/j.bioph a.2018.09.103.
51. Feng L, Yang B, Tang XD. Long noncoding RNA LINC00460 promotes carcinogenesis via sponging miR-613 in papillary thyroid carcinoma. J Cell Physiol. 2019;234(7):11431–9. https ://doi.org/10.1002/jcp.27799 .
52. Qu Y, Xiao H, Xiao W, Xiong Z, Hu W, Gao Y, et al. Upregulation of MIAT regulates LOXL2 expression by competitively binding MiR-29c in clear cell renal cell carcinoma. Cell Physiol Biochem. 2018;48(3):1075–87. https ://doi.org/10.1159/00049 1974.
53. Wang J, Zhang C, He W, Gou X. Construction and comprehensive analysis of dysregulated long non-coding RNA-associated competing endoge-nous RNA network in clear cell renal cell carcinoma. J Cell Biochem. 2018.
https ://doi.org/10.1002/jcb.27557 .
54. Yang K, Lu XF, Luo PC, Zhang J. Identification of six potentially long non-coding RNAs as biomarkers involved competitive endogenous RNA in clear cell renal cell carcinoma. Biomed Res Int. 2018;2018:9303486. https ://doi.org/10.1155/2018/93034 86.
Publisher’s Note