R E S E A R C H
Open Access
Predicting expression: the complementary
power of histone modification and
transcription factor binding data
David M Budden
1,2, Daniel G Hurley
1, Joseph Cursons
1, John F Markham
1,3, Melissa J Davis
1and Edmund J Crampin
1,2,3,4,5,6*Abstract
Background: Transcription factors (TFs) and histone modifications (HMs) play critical roles in gene expression by regulating mRNA transcription. Modelling frameworks have been developed to integrate high-throughput omics data, with the aim of elucidating the regulatory logic that results from the interactions of DNA, TFs and HMs. These models have yielded an unexpected and poorly understood result: that TFs and HMs are statistically redundant in explaining mRNA transcript abundance at a genome-wide level.
Results: We constructed predictive models of gene expression by integrating RNA-sequencing, TF and HM chromatin immunoprecipitation sequencing and DNase I hypersensitivity data for two mammalian cell types. All models identified genome-wide statistical redundancy both within and between TFs and HMs, as previously reported. To investigate potential explanations, groups of genes were constructed for ontology-classified biological processes. Predictive models were constructed for each process to explore the distribution of statistical redundancy. We found significant variation in the predictive capacity of TFs and HMs across these processes and demonstrated the predictive power of HMs to be inversely proportional to process enrichment for housekeeping genes.
Conclusions: It is well established that the roles played by TFs and HMs are not functionally redundant. Instead, we attribute the statistical redundancy reported in this and previous genome-wide modelling studies to the
heterogeneous distribution of HMs across chromatin domains. Furthermore, we conclude that statistical redundancy between individual TFs can be readily explained by nucleosome-mediated cooperative binding. This could possibly help the cell confer regulatory robustness by rejecting signalling noise and allowing control via multiple pathways.
Keywords: Gene expression, Transcriptional regulation, Transcription factors, Histone modifications, Predictive modelling
Background
A critical challenge in molecular biology is understand-ing the biological mechanisms underlyunderstand-ing precise spa-tiotemporal regulation of gene expression in mammals. Significant regulation is known to occur at the level of transcriptional initiation and elongation [1], through the combinatorial interactions of transcription factors
*Correspondence: [email protected]
1Systems Biology Laboratory, Melbourne School of Engineering, The University of Melbourne, 3010 Parkville, Australia
2NICTA Victoria Research Laboratory, The University of Melbourne, 3010 Parkville, Australia
Full list of author information is available at the end of the article
(TFs) [2,3] and histone modifications (HMs) [4,5]. By binding to specific DNA motifs, activator or repressor TFs regulate the recruitment and behaviour of RNA polymerase II (RNAP-II). Direct interactions between TFs and the transcription pre-initiation complex require genomic proximity to the transcription start site (TSS) or higher-order chromatin looping [6], corresponding with TF-binding motifs in the promoter or enhancer/silencer regions respectively [2,7]. Post-translational modifications of the amino-termini of nucleosomal histones are also known to regulate transcription [8,9] by either modulat-ing the local chromatin structure to control TF acces-sibility [4] or directly recruiting chromatin remodellers
and other related enzymes [10]. Altered gene expression caused by abnormalities in TF or HM patterns has been directly associated with hundreds of human diseases [3], including leukaemia [11], prostate cancer [12] and various developmental, autoimmune, neurological, inflammatory and neoplastic disorders [13].
The complex relationship between TFs and HMs is still largely unexplored. Statistical models have recently been developed to integrate high-throughput omics data with the aim of understanding the regulatory logic that fol-lows from these interactions (recently reviewed in [14]). These models demonstrated that TFs and HMs are accu-rate predictors of mRNA transcript abundance in several organisms and cell types. However, the utility of this data-driven framework is not the ability to predict gene expression, but rather the insights that can be gained from investigating the putative regulatory interactions captured by an accurate model. A recent study showed that models constructed from position weight matrix-predicted TF binding, when combined with a tissue-specific H3K4me3 prior, yield similar prediction accuracy to models constructed from actual chromatin immuno-precipitation sequencing (ChIP-seq) data [15]. Further-more, a principal component analysis of these models was able to extract correctly the established regulatory roles (i.e., activator or repressor) of 20 TFs and HMs in mouse embryonic stem cells (mESCs) [14].
In addition to providing a powerful explorative frame-work, predictive modelling of gene expression has yielded an unexpected and previously unexplained result: that TFs and HMs are statistically redundant in explaining mRNA transcript abundance at a genome-wide level. Moreover, redundancy has been identified bothwithinandbetween
TFs and HMs in mESCs [16], to the extent that a single TF (E2f1) is almost as informative as a panel of 20 TFs and HMs with well-established regulatory roles [15]. Here,
statisticalredundancy equates to two variables providing equivalent information (e.g., due to being strongly corre-lated), and it is important to appreciate that this does not necessarily imply functional redundancy (i.e., removing either element does not affect gene expression). Assum-ing the existence of functional redundancy between TFs and HMs outwardly contradicts our understanding of transcriptional regulation, in which TFs and HMs play complementary yet distinct roles in RNAP-II recruitment and elongation.
In this study, we investigate the fundamental cause of the statistical redundancy within and between TFs and HMs. First, we validate the robustness of previous find-ings by constructing genome-wide predictive models for different mammalian cell types and modelling algorithms. We confirm that TFs and HMs are both predictive of gene expression (measured by mRNA transcript abundance) and statistically redundant at a genome-wide level. Our
analysis was extended by constructing individual models for thousands of ontology-classified biological processes. By diverging from previous genome-wide analyses, we identify significant variance in the distribution of statisti-cal redundancy across these processes, which we attribute to regions of open nucleosome-sparse chromatin main-tained by the activity of boundary proteins and enriched for housekeeping genes. Finally, we discuss several impli-cations of our findings and how they contribute to the overall understanding of regulatory logic in mammalian systems.
Results and discussion
Transcription factors and histone modifications are predictive of mRNA transcript abundance
As TFs and HMs are known to play critical roles in regu-lating transcription, accurate predictive models of mRNA transcript abundance have been constructed from corre-sponding ChIP-seq binding data for various organisms, cell types and modelling techniques [14,17-19]. To val-idate the robustness of these findings, we constructed both log-linear and support vector regression (SVR) mod-els for two mammalian cell types: mESCs and human lymphoblastoids (GM12878).
Table 1 presents the prediction accuracy of log-linear and SVR models constructed from three sets of data: TF binding (TF), HM and DNase-I hypersensitivity (HM+DNase; both proxies for chromatin accessibility) and the concatenation of both (TF+HM+DNase). The proportion of transcript abundance variation explained by each model (adjustedR2) was calculated using a tenfold cross-validation [20], with the presented adjustedR2 val-ues capturing the mean and standard deviation of these folds. The relationship between measured and predicted mRNA transcript abundance is visualised in Additional file 1: Figure S1 and Additional file 2: Figure S2 for mESCs and GM12878 cells, respectively.
Table 1 Prediction accuracy of predictive models of mRNA transcript abundance
TF HM+DNase TF+HM+DNase
mESC
Log-linear regression 0.58 (0.01) 0.62 (0.01) 0.68 (0.01)
Support vector regression 0.64 (0.02) 0.67 (0.01) 0.70 (0.01)
GM12878
Log-linear regression 0.33 (0.01) 0.42 (0.01) 0.43 (0.01)
Support vector regression 0.39 (0.01) 0.45 (0.01) 0.46 (0.01)
Three sets of ChIP-seq input data were considered: TF binding (TF), HM and DNase-I hypersensitivity (HM+DNase) and the concatenation of both (TF+HM+DNase). Prediction accuracy is based on tenfold cross-validation adjusted R2, reported as the mean and standard deviation of the ten folds.
It is evident that small sets of TFs, HMs and DNase are predictive of genome-wide mRNA transcript abundance in mESCs, as reported in previous studies [18]. We have further demonstrated that these results extend to differ-ent mammalian cell types and are robust against algo-rithm selection. As support vector regression (SVR) yields minimal improvement despite a two-order-of-magnitude increase in required CPU time, only log-linear regression is applied throughout the remainder of this study.
Transcription factors and histone modifications are less predictive of mRNA transcript abundance in differentiated cells
Our results reveal that models of transcriptional reg-ulation in GM12878 cells are less accurate than those constructed for mESCs. To ensure that this does not simply reflect the different proportion of zero-expression genes in the GM12878 and mESC data, we constructed log-linear regression models considering only genes with R/FPKM(fragments per kilobase per million)-normalised transcript abundance >0. These models yielded an average reduction in adjustedR2prediction accuracy of 58% and
7% for GM12878 and mESC, respectively (not shown), excluding a high proportion of zero-expression genes in the differentiated GM12878 cell line as the underlying cause of the observed performance gap. The removal of these genes also adversely affected subsequent analysis (not shown), as much of the information used to eluci-date the silencing roles of some regulatory elements (e.g., H3K9me3 and H3K27me3) is lost.
One explanation for the performance gap between mESC and GM12878 models may be the selection of individual TFs, which vary between cell types. The 12 TFs selected for mESCs (see Table 2) are known to play important regulatory roles specific to embryonic stem cell biology; i.e., as self-renewal regulators and pluripotency reprogramming factors [21,22]. Initial differentiation of embryonic stem cells involves silencing of these TFs and activation of developmental regulators [23,24], necessitat-ing the selection of alternate TFs for GM12878 modellnecessitat-ing. Although the 11 GM12878 TFs chosen are known to play key roles (see Table 2) in regulating various cellular, metabolic and development processes [3], it is possible that they represent a smaller fraction of the key regulators than the 12 considered for mESCs (in which regulatory logic is better characterised).
A more likely explanation for the performance gap between predictive models for embryonic stem versus dif-ferentiated cells is the increasing heterogeneity in regula-tory mechanisms following differentiation. In embryonic stem cells, the majority of gene promoters containing CpG (dinucleotide) islands are characterised by H3K4me3-bearing nucleosomes. Many of these genes are main-tained in a bivalent state with the inherently antagonistic
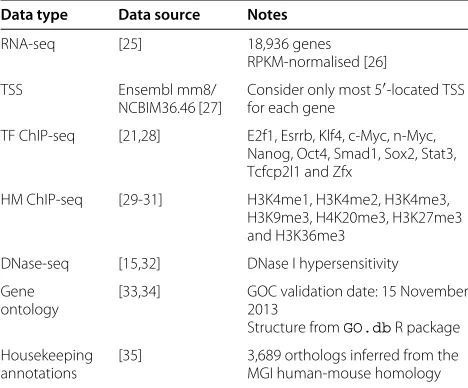
Table 2Mus musculus(embryonic stem cell) data
Data type Data source Notes
RNA-seq [25] 18,936 genes
RPKM-normalised [26]
TSS Ensembl mm8/
NCBIM36.46 [27]
Consider only most 5-located TSS for each gene
TF ChIP-seq [21,28] E2f1, Esrrb, Klf4, c-Myc, n-Myc, Nanog, Oct4, Smad1, Sox2, Stat3, Tcfcp2l1 and Zfx
HM ChIP-seq [29-31] H3K4me1, H3K4me2, H3K4me3, H3K9me3, H4K20me3, H3K27me3 and H3K36me3
DNase-seq [15,32] DNase I hypersensitivity
Gene ontology
[33,34] GOC validation date: 15 November 2013
Structure fromGO.dbR package
Housekeeping annotations
[35] 3,689 orthologs inferred from the MGI human-mouse homology
Genes corresponding with haplotype variants, unmapped contig regions and low confidence RNA-seq mappings were removed, resulting in a set of 17,517 genes for analysis. Pre-processed RNA-seq and ChIP-seq data and mapped DNase I hypersensitivity in mESCs are available online [15,32].
ChIP, chromatin immunoprecipitation; GOC, Gene Ontology Consortium; HM, histone modification; MGI, Mouse Genome Informatics; seq, sequencing; TF, transcription factor; TSS, transcription start site; RPKM, reads per kilobase per million.
H3K27me3 repressive mark; these genes are expressed only at low levels, but are poised for rapid transition to active or silenced states in response to differentia-tion signals or other extracellular stimuli [36]. Accord-ingly, the genome-wide correlation between H3K4me3 and H3K27me3 in mESCs is very high (Pearson’sr=0.78 versus−0.20 in GM12878, not shown).
Lineage-specific gene expression programs exhibit far less regulatory homogeneity; e.g., many genes are silenced by H3K27me3/polycomb-mediated facultative heterochromatinisation, whereas others are silenced by H3K9me3/HP1-mediated constitutive heterochromatini-sation and subsequent DNA methylation. Synergistic and conditional relationships become more widespread (e.g., H3K4me3 is positively associated with expression only in the absence of H3K27me3), limiting the effectiveness of regression models only able to capture additive and simple-multiplicative relationships.
Future predictive modelling studies of differentiated cells could integrate information for the H2A.Z histone variant (not assayed), which is critical for maintaining metastable equilibrium between antagonistic H3K4me3 and H3K27me3 [37,38], and could therefore be used to classify genes subject to different regulatory logic.
Individual transcription factors are statistically redundant for predicting mRNA transcript abundance
Functional redundancy between individual TFs has
and Drosophila melanogaster [19] and proposed as an important mechanism in eukaryotes [2]. To investigate the existence of similar redundancy within mammalian TFs and HMs, log-linear regression models of genome-wide mRNA transcript abundance were constructed for
all combinations ofnTFs andmHMs and DNase
consid-ered in this study. Figure 1(a,b) demonstrates the adjusted
R2 distributions for these 4,095 mESC TF models and
255 mESC HM+DNase models respectively, with the
min-imum and maxmin-imum prediction accuracies for each n
and mconnected by the blue and red curves. The
cor-responding results for GM12878 models are presented in Figure 1(c,d).
Although models constructed from greater numbers of regulatory elements generally yielded improved predic-tion accuracy, this improvement diminished considerably
(a)
0.0 0.2 0.4 0.6 0.8 1.0
1 2 3 4 5 6 7 8 9 10 11 12
number of TFs (n)
adjusted
R
2
(b)
0.0 0.2 0.4 0.6 0.8 1.0
1 2 3 4 5 6 7 8
number of HMs+DNase (m)
adjusted
R
2
(c)
0.0 0.2 0.4 0.6 0.8 1.0
1 2 3 4 5 6 7 8 9 10 11
number of TFs (n)
adjusted
R
2
(d)
0.0 0.2 0.4 0.6 0.8 1.0
1 2 3 4 5 6 7
number of HMs+DNase (m)
a
djusted
R
2
for values ofnormgreater than 4. This is particularly evi-dent for mESC TF models; despite all 12 TFs being known to play key roles in mESC biology [21], a model con-structed from E2f1 data alone yielded equivalent mRNA transcript abundance prediction accuracy (adjustedR2=
0.57) as a model integrating all 12 (adjustedR2=0.59). The most predictive TFs (E2f1, c-Myc, n-Myc and Zfx) were those known to localise preferentially to promoter regions (e.g., E2f1 was found to bind to more than 60% of mESC promoters), whereas the least predictive TFs (Smad1 and Stat3) bind further from the TSS (e.g., Smad1 was found to bind to less than 3% of mESC promoters).
Previous studies have demonstrated that many TFs (including E2f1 and Oct4) do not require the presence of a consensus motif to bindin vivo, but rather may be recruited to the promoter with the assistance of other bound TFs [39,40]. These results may partially explain the observed statistical redundancy between mammalian TFs; i.e., if one TF is necessary for the recruitment of another, these TFs will provide similar predictive informa-tion regarding the regulatory state despite their distinct functional roles. It should be noted that this is dis-tinct fromfunctionalredundancy; i.e., it does not imply the removal of any individual TF would not affect gene expression. It has previously been proposed that the paral-lel deployment of cooperatively bound TFs confers robust-ness to gene expression, both allowing the regulatory state of a gene to reject signalling noise and providing con-trol through activation or inhibition of multiple signalling pathways [41].
Transcription factors and histone modifications provide equivalent information regarding genome-wide transcriptional regulation
In Table 1, we present the prediction accuracy of log-linear and SVR models constructed from three sets of data: TF binding (TF), HM and DNase-I hyper-sensitivity (HM+DNase) and the concatenation of both (TF+HM+DNase). In addition to the findings described earlier, it is apparent that the TF+HM+DNase models perform only marginally better than those constructed from TF or HM+DNase data alone, irrespective of algorithm or cell type. Although TFs and HMs inde-pendently provide significant information regarding tran-scriptional regulation, it appears that they provide the
same information and are therefore statistically redun-dant. To quantify this phenomenon, we performed a partial correlation analysis by calculating the correlation between genome-wide transcript abundance prediction residuals for TF and HM+DNase models [42]. The resid-uals were found to be highly correlated (Pearson’sr>0.8 for both mESCs and GM12878 cells, not shown), indicat-ing a significant degree of association between the TF and
HM+DNase data. These results (previously identified for mESCs [15,16]) outwardly contradict our understanding of transcriptional regulation, in which TFs and HMs play complementary yet distinct roles in RNAP-II recruitment and elongation.
Prediction of transcript abundance for genes grouped by biological process suggests a more heterogeneous role for transcription factors and histone modifications
To investigate the source of statistical redundancy between TFs and HMs, we constructed individual pre-dictive models for thousands of ontology-classified bio-logical processes. Insight can be gained into the nature of this redundancy by investigating its distribution across the smaller groups of genes contributing to each process.
The mESC and GM12878 genes were grouped by ontology-classified biological process. Two regression models were constructed for each set of genes: one con-sidering only TF-binding data and the other concon-sidering only HM and DNase data. The ratio of adjustedR2
val-ues for the TF and HM+DNase models was calculated to capture their relative performance.
Of the 1,880 mESC processes considered, 25 were found
to exhibit a significant TF-to-HM+DNase adjusted R2
ratio (i.e., demonstrating that TF binding is more pre-dictive of mESC mRNA transcript abundance than HMs and DNase for the markers considered in this study, Benjamini–Hochberg-correctedP<0.05 [43]). A full list of these processes and their respective ratios is provided in Additional file 3: Table S1. Furthermore, 523 processes were found to exhibit a significant HM+DNase-to-TF adjustedR2ratio (i.e., demonstrating that HMs and DNase are more predictive of mRNA transcript abundance than TF binding). These processes and their respective ratios are listed in Additional file 4: Table S2. The specific TF and HM+DNase adjustedR2values used to calculate the ratios
for each of the 1,880 processes are provided in Additional file 5: Table S3.
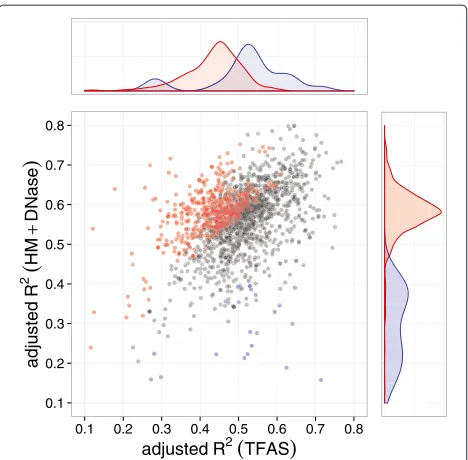
The distributions of adjustedR2values for models con-structed from mESC TF and HM+DNase data (visualised in Figure 2) demonstrate that their relative predictive power is heterogeneous across different biological pro-cesses. A similar distribution of adjusted R2 values is evident for GM12878 data (not shown), although statis-tically significant outliers were not confidently identified due to an overall lower prediction accuracy of GM12878 models (described earlier). It is important to note that this lack of outliers does not adversely affect subsequent analy-sis, which focuses on statistically significant trends across high- and low-scoring biological processes rather than the individual processes themselves.
0.1 0.2 0.3 0.4 0.5 0.6 0.7 0.8
0.1 0.2 0.3 0.4 0.5 0.6 0.7 0.8
adjusted R2
(
TFAS)
adjusted
R
2
(
HM
+
DNase
)
Figure 2Predictive power of TF binding and HM+DNase-based models.These models are of mRNA transcript abundance for 1,880 sets of mESC genes grouped by ontology-classified biological processes. Sets of genes exhibiting significant HM+DNase-to-TF adjustedR2ratio (i.e., for which HMs are more predictive of transcript abundance) are indicated in red, with those exhibiting a significant TF-to-HM+DNase adjustedR2ratio (i.e., for which TF binding is more predictive) are indicated in blue. The overlap between the significant (Benjamini–Hochberg-correctedP<0.05 [43]) and non-significant (grey) regions is due to the ratio significance threshold varying with the number of genes belonging to each group. HM, histone modification; TF, transcription factor; TFAS, transcription factor association strength.
functional redundancy, but rather arises from averaging over heterogeneous groups of genes subject to differ-ent regulatory logic. Moreover, the observation that HM and DNase data were significantly more accurate in pre-dicting the mRNA transcript abundance of mESC genes contributing to 28% of biological processes, suggests the existence of a small number of genes for which TF binding is considerably more informative. If under-represented in the processes examined, these genes would introduce neg-ative bias into the null distribution (and therefore increase the number of statistically significant outliers) when ran-domly sampled during bootstrapped significance testing. This is also consistent with the order-of-magnitude fewer processes (1.3%) for which contributing mRNA transcript abundance was more accurately predicted by TF-binding data.
Redundancy in transcriptional regulation is dependent upon enrichment for housekeeping genes
The set of genes for which TF binding is considerably more predictive of gene expression than HM and DNase
data was comparatively small (Figure 2). Inspecting the biological processes with high TF-to-HM+DNase and HM+DNase-to-TF adjustedR2ratios for their constituent
genes, it is apparent that the former are enriched for housekeeping tasks (e.g., ncRNA processing and RNA splicing) and the latter for tissue and context-specific processes (e.g., signal transduction and regulation of cell differentiation). To investigate whether these two groups of genes can be characterised accordingly, the top 100 processes from each list were tested for enrichment of housekeeping genes.
Figure 3 presents the housekeeping-gene enrichment of biological processes with the top 100 TF-to-HM+DNase
and HM+DNase-to-TF adjusted R2 ratios for both (a)
mESCs and (b) GM12878 cells. In both cases, the pro-portion of housekeeping genes contributing to biological processes is significantly larger for the top 100 TF-to-HM+DNase group (Welch’st-test (a)P<2.2×10⁻¹⁶and
(b)P < 2.6×10⁻⁶[44]). These results suggest TF
bind-ing provides more information regardbind-ing the transcrip-tional regulatory state of mammalian biological processes enriched for housekeeping genes.
Our findings can be explained by considering the spatial chromatin structure, as housekeeping genes are known to maintain constant ubiquitous expression by co-location in regions of actively transcribed open chro-matin (e.g., at the boundaries of euchrochro-matin and hete-rochromatin, topologically associating domains and larger A and B compartments [6,45,46]). These regions are maintained primarily by the activity of boundary pro-teins (e.g., CTCF [47]) rather than histone acetylation and methyl-recognising co-factors [48]. They are also significantly depleted for histone H1 (responsible for solenoidal chromatin packing [49]) and exhibit overall nucleosomal sparsity to provide unrestricted TF acces-sibility [50]. As HM ChIP-seq data was not normalised to nucleosome density (not assayed), this combination of nucleosome sparsity and TF-modulated chromatin struc-ture presumably explains why HMs provide compara-tively little information regarding the regulatory state of housekeeping genes. As TF–DNA complexes in open regions are capable of remaining stable throughout multi-ple rounds of transcription [51,52], it is also unsurprising that a snapshot of local TF binding would provide more information regarding housekeeping mRNA transcript abundance than in the case of dynamically modulated chromatin.
Conclusions
0.0 0.2 0.4 0.6
TFAS (n = 100) HM+DNase (n = 100)
propor
tion of housek
eeping genes
0.0 0.2 0.4 0.6
TFAS (n = 100) HM+DNase (n = 100)
propor
tion of housek
eeping genes
(b)
(a)
Figure 3Proportion of housekeeping genes contributing toward key biological processes.These processes have the top 100
TF-to-HM+DNase (TF) and HM+DNase-to-TF (HM+DNase) adjustedR2ratios for(a)mESCs and(b)GM12878 cells. The proportion of housekeeping genes is significantly larger for the TF group in both cases (Welch’st-test (a)P<2.2×10⁻¹⁶and (b)P<2.6×10⁻⁶). This suggests that TF binding provides more information regarding the transcriptional regulatory state of mammalian biological processes enriched for housekeeping genes and conversely that HMs and DNase provide more information for tissue and context-sensitive processes. HM, histone modification; TF, transcription factor; TFAS, transcription factor association strength.
those represented in the DREAM challenges [55]). Rather than modelling the regulation of specific genes, they can lead to more general conclusions regarding the roles and interactions of TFs, HMs and other key regulators of gene expression. Furthermore, they avoid the common issue of an underdetermined system by treating individual genes as observationsof transcriptional regulatory logic in action, rather than variablesin an association-driven analysis [56].
Recent predictive modelling studies have identified sta-tistical redundancy between the regulatory roles of TFs and HMs [15,16]. These findings outwardly contradict our understanding of transcriptional regulation, in which TFs and HMs play complementary yet distinct roles in RNAP-II recruitment and elongation. Moreover, there have previously been minimal attempts to resolve this contradiction (or even to distinguish between statisti-cal and functional redundancy), potentially leading read-ers to perceive this modelling framework as one prone to capturing invalid biology. For the above reasons and to enhance our understanding of transcriptional regu-latory logic, we believe that it is important to iden-tify the underlying cause of this recurring statistical redundancy.
In this study, we validated the robustness of previ-ous findings across multiple mammalian cell types and using different modelling algorithms. We extend this anal-ysis by constructing individual models for thousands of
ontology-classified biological processes, identifying sig-nificant variation in the relative predictive power of TFs and HMs across processes (i.e., the redundancy observed at the genome-wide level breaks down at this resolution). Importantly, this resolves the paradox between the distinct regulatory roles of TFs and HMs and the statistical redundancy within and between these elements.
potential of predictive modelling as a powerful explorative framework for integrating heterogeneous genome-wide datasets to elucidate novel biology, and we encourage other researchers to incorporate such models in their own analysis pipelines.
Methods
Data availability and implementation
AllHomo sapiens(GM12878 lymphoblastoid cell line) and
Mus musculus (embryonic stem cell) data used in this study are detailed in Tables 2 and 3. All data and scripts are available online [58].
Calculation of transcription factor–gene association strength
For each geneiand TFj, ChIP-seq binding data forjwas integrated to calculate a transcription factor association strength(TFAS),aij[14,15,18]:
aij=
k gke−
dk
d0, (1)
wheregkis the height (mapped tags) of thekth TF-binding peak,dk is the distance (in base pairs) separating thekth peak from the TSS of gene i, and d0 is the empirical
decay rate derived from the approximate average widths of ChIP-seq peaks (d0=5, 000 for all TFs except E2f1 (d0=
500) [14]). Binding sites further than 30,000 bp from the TSS were not considered as their weighted contribution is
negligible. The TFAS matrixAwas log-transformed and
quantile-normalised [63].
Table 3Homo sapiens(GM12878 lymphoblastoid cell line) data
Data type Data source Notes
RNA-seq ENCODE [59] 49,488 genes FPKM-normalised [60]
TSS Ensembl hg19/ GRCh37 [27]
Consider only most 5-located TSS for each gene
TF ChIP-seq ENCODE [59] c-Fos, Ctcf, Egr1, Nrf1, Nrsf, Pou2f2, Sp1, Srf, Stat3, Usf1 and Yy1
HM ChIP-seq ENCODE [59] H3K4me1, H3K4me2, H3K4me3, H4K20me1, H3K27me3 and H3K36me3
DNase-seq ENCODE [59] DNase I hypersensitivity
Gene ontology
[33,34] GOC validation date: 21 March 2014 Structure fromGO.dbR package
Housekeeping annotations
[61,62] 3,804 genes
Using RNA-seq data GSE30611
Genes corresponding with haplotype variants, unmapped contig regions and low confidence RNA-seq mappings were removed, resulting in a set of 38,041 genes for analysis.
ChIP, chromatin immunoprecipitation; GOC, Gene Ontology Consortium; HM, histone modification; seq, sequencing; TF, transcription factor; TSS, transcription start site.
An alternative formulation of the TFAS involves sim-ply summing the number of mapped ChIP-seq tags either side of the TSS [16,17] (e.g.,−4 to approximately 4 kbp). The exponentially decaying formulation was chosen as it corresponds with the observed sharpness of ChIP-seq TF-binding peaks about the TSS and yields more accurate predictions of mRNA transcript abundance [16].
Calculation of histone and DNase scores
For each pair of geneiand HMj, the number of mapped
ChIP-seq tags for j was summed within a region 2,000
bp either side of the TSS ofito calculate ahistone score,
bij[14,15]:
bij=
k
gk, (2)
where gk is the number of ChIP/DNase-seq reads for j
mapped to position k relative to the TSS of i. A region 2,000 bp either side of the TSS was chosen for consistency with previous studies [15-17,19]. An equivalent method was applied to DNase-seq tags to produce aDNase score.
The concatenated histone and DNase score matrixBwas
log-transformed and quantile-normalised as per the TFAS matrixA[63]. Unlike TFs, HMs do not exhibit sharp, well-defined ChIP-seq peaks about the TSS. This prevents the formulation of histone and DNase scores equivalent to Equation 1 [16].
Regression models for predicting mRNA transcript abundance
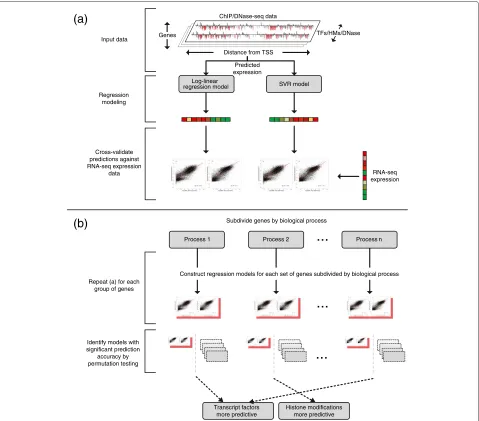
Predictive models of mRNA transcript abundance were constructed using two regression techniques: log-linear regression and SVR [64], as illustrated in Figure 4(a). Both techniques have been previously applied to mod-elling transcript abundance as a function of transcrip-tional regulatory elements and demonstrated to yield comparable predictive performance [15-19]. However, as log-linear regression and nonlinear SVR have previ-ously been applied either to independent datasets or with different TFAS/histone score formulations, it remains unclear which is more appropriate for transcript abun-dance modelling.
Log-linear regression
The log-linear regression model describing mRNA tran-script abundance as a function of TF binding, HMs and DNase was formulated as:
log(yi+σ)=μ+
j βjaij TF binding
+
k γkbik HM+DNase
SVR model Log-linear
regression model
ChIP/DNase-seq data
Distance from TSS Genes
Input data
Regression modeling
Cross-validate predictions against RNA-seq expression
data
(a)
(b)
...
Predicted expression
RNA-seq expression
Process 1 Process 2
Subdivide genes by biological process
Process n
Construct regression models for each set of genes subdivided by biological process
...
...
Repeat (a) for each group of genes
Identify models with significant prediction
accuracy by permutation testing
Transcript factors more predictive
Histone modifications more predictive
TFs/HMs/DNase
Figure 4Flowchart illustrating the experimental pipeline presented in this study.ChIP/DNase-seq data were used to construct regression models of mRNA transcript abundance for a set of genes. The prediction accuracy of each model was evaluated relative to RNA-sequencing data. By constructing groups of genes categorised by biological process and applying the above methodology, it was possible to identify heterogeneity in the relative predictive power of TFs and HMs. These groups were later analysed for enrichment for housekeeping genes.
where yi is the mRNA transcript abundance of gene i, μ is the basal transcript abundance and εi is the gene-specific error term [14,15,18]. For a geneiand TFj,aijis the TFAS defined in Equation 1 andβjis the fitted coef-ficient. Similarly,bikis the histone (or DNase) score for a
genei and HM (or DNase)kdefined in Equation 2 and
γk is the fitted coefficient. The constantσ is fitted from a 20% held-aside dataset to avoid evaluation of log(0). A model considering only the TFAS or HM+DNase score data can be constructed by excluding the HM+DNase or TF-binding components from Equation 3, respectively.
The linear regression implementation from thestatsR
package was used.
Support vector regression
The SVR model describing mRNA transcript abundance of a genei,yi, as a nonlinear function of a TFAS and/or HM+DNase score matrix,X, can be formulated as:
yi=μ+
i
αiK(Xi,X)+εi, (4)
func-tion implementafunc-tion from thee1071R package was used with default parameters.
Identifying heterogeneity in predictive power
Previous models of mRNA transcript abundance have focused on modelling mRNA transcript abundance genome-wide [15-19]. To investigate whether the rela-tive performance of TF-binding and HM+DNase-based models varies across smaller sets of process-related genes, the Gene Ontology biological process annotations for the available set of 17,517 mESC and 38,041 GM12878 genes were considered [34]. For each process, a set containing all genes annotated with that term or any descendant term was constructed. Sets containing fewer than 50 or greater than 10,000 genes were discarded, yielding 1,880 and 1,965 sets of genes (for mESC and GM12878 respectively) for analysis.
Two regression models were constructed for each set of genes: one considering only TF-binding data and the other considering only HM and DNase data. The perfor-mance of the fitted models was evaluated as anadjusted R2 score, which captures the proportion of variation in measured mRNA transcript abundance for those genes explained by the model. Unlike the R2 score (i.e., the
coefficient of determination, equivalent to the square of the Pearson correlation coefficient and previously used to evaluate models of mRNA transcript abundance [16,17]), the adjusted R2 prevents spurious inflation due to the introduction of additional explanatory variables [65]. The
ratio of adjusted R2 values for the TF and HM+DNase
models was calculated to capture their relative
performance.
A bootstrapped non-parametric test was conducted to identify sets of genes exhibiting a significant adjusted
R2 ratio, as illustrated in Figure 4(b). Specifically, for
each biological process annotating n genes, 5,000 sets
of n genes were randomly sampled from the available
17,517/38,041 (mESC/GM12878) to generate a corre-sponding distribution of adjusted R2 ratios under the null hypothesis. From this distribution, a non-parametric
P value was calculated using an empirical
cumula-tive distribution function approximation [66]. Statisti-cally significant P values were identified by applying a Benjamini–Hochberg correction with a false discovery rate of 0.05 [43].
Identifying enrichment of housekeeping genes
If the gene-specific residual,εˆi, for a gene,i, is sufficiently large, it follows that the relationship between mRNA tran-script abundance and the trantran-scriptional regulatory ele-ments described by the corresponding regression model
does not hold for i. These poorly fitted genes were
removed to identify enrichment of housekeeping anno-tation amongst sets of genes sharing common regulatory
profiles. For each of the biological processes subsequently found to exhibit a statistically significant adjusted R2
ratio for the TF and HM+DNase models, genes exhibit-ing a studentised residual magnitude| ˆεi|>1 were there-fore discarded [67]. The remaining genes were tested for significant enrichment of housekeeping annotation using the bootstrapped non-parametric test methodology described above.
Additional files
Additional file 1: Figure S1.Relationship between actual genome-wide mESC mRNA transcript abundance (RPKM-normalised RNA-sequencing) versus transcript abundance predicted from ChIP-seq (TF binding and HM) and DNase data. Two regression algorithms were considered: log-linear regression, for(a)TF,(b)HM+DNase and(c)TF+HM+DNase; and support vector regression, for(d)TF,(e)HM+DNase and(f)TF+HM+DNase. ChIP-seq, chromatin immunoprecipitation sequencing; HM, histone modification; mESC, mouse embryonic stem cell; TF, transcription factor.
Additional file 2: Figure S2.Relationship between actual genome-wide GM12878 mRNA transcript abundance (FPKM-normalised
RNA-sequencing) versus transcript abundance predicted from ChIP-seq (TF binding and HM) and DNase data. Two regression algorithms were considered: log-linear regression, for(a)TF,(b)HM+DNase and(c)
TF+HM+DNase; and support vector regression, for(d)TF,(e)HM+DNase and(f)TF+HM+DNase. ChIP-seq, chromatin immunoprecipitation sequencing; HM, histone modification; TF, transcription factor.
Additional file 3: Table S1.List of 25 mESC biological processes found to exhibit a statistically significant TF-to-HM+DNase adjustedR2ratio
(demonstrating that TF binding is more predictive of mESC mRNA transcript abundance than HMs and DNase for the markers considered in this study, Benjamini–Hochberg-correctedP<0.05 [43]).
Additional file 4: Table S2.List of 523 mESC biological processes found to exhibit a statistically significant HM+DNase-to-TF adjustedR2ratio (i.e.,
demonstrating that HMs and DNase are more predictive of mESC mRNA transcript abundance than TF binding for the markers considered in this study, Benjamini–Hochberg-correctedP<0.05 [43]).
Additional file 5: Table S3.TF and HM+DNase model performance for each of the 1,880 mESC biological processes considered.
Additional file 6: The-support vector regression model describing mRNA transcript abundance as a nonlinear function of a TFAS or HM+DNase score matrix.
Abbreviations
bp: base pair; ChIP: chromatin immunoprecipitation; HM: histone modification; kbp: kilobase pair; mESC: mouse embryonic stem cell; RNAP-II: RNA
polymerase II; SVR: support vector regression; TF: transcription factor; TFAS: transcription factor association strength; TSS: transcription start site.
Competing interests
The authors declare that they have no competing interests.
Authors’ contributions
DMB, DGH, JC, JFM, MJD and EJC analysed and interpreted the data, and were responsible for the study design and concept. DMB developed the software, processed the data and drafted the paper. All authors read and approved the final manuscript.
Acknowledgements
the Australian Research Council Centre of Excellence in Convergent Bio-Nano Science and Technology (project number CE140100036) (EJC). The views expressed herein are those of the authors and are not necessarily those of the National Breast Cancer Foundation, NICTA or the Australian Research Council.
Author details
1Systems Biology Laboratory, Melbourne School of Engineering, The
University of Melbourne, 3010 Parkville, Australia.2NICTA Victoria Research
Laboratory, The University of Melbourne, 3010 Parkville, Australia.3The Walter
and Eliza Hall Institute of Medical Research, Department of Medical Biology, The University of Melbourne, 3010 Parkville, Australia.4ARC Centre of
Excellence in Convergent Bio-Nano Science and Technology, 3010 Parkville, Australia.5Department of Mathematics and Statistics, The University of
Melbourne, 3010 Parkville, Australia.6School of Medicine, The University of
Melbourne, 3010 Parkville, Australia.
Received: 25 July 2014 Accepted: 5 November 2014 Published: 24 November 2014
References
1. Maston GA, Evans SK, Green MR:Transcriptional regulatory elements in the human genome.Annu Rev Genomics Hum Genet2006,7:29–59. 2. Farnham PJ:Insights from genomic profiling of transcription factors.
Nat Rev Genet2009,10(9):605–616.
3. Vaquerizas JM, Kummerfeld SK, Teichmann SA, Luscombe NM:A census of human transcription factors: function, expression and evolution.
Nat Rev Genet2009,10(4):252–263.
4. Berger SL:The complex language of chromatin regulation during transcription.Nature2007,447(7143):407–412.
5. Kurdistani SK, Tavazoie S, Grunstein M:Mapping global histone acetylation patterns to gene expression.Cell2004,117(6):721–733. 6. Dekker J, Marti-Renom MA, Mirny LA:Exploring the three-dimensional
organization of genomes: interpreting chromatin interaction data.
Nat Rev Genet2013,14(6):390–403.
7. Li B, Carey M, Workman JL:The role of chromatin during transcription.
Cell2007,128(4):707–719.
8. Bernstein BE, Meissner A, Lander ES:The mammalian epigenome.Cell 2007,128(4):669–681.
9. Pekowska A, Benoukraf T, Ferrier P, Spicuglia S:A unique H3K4me2 profile marks tissue-specific gene regulation.Genome Res2010,
20(11):1493–1502.
10. Kouzarides T:Chromatin modifications and their function.Cell2007,
128(4):693–705.
11. Krivtsov AV, Feng Z, Lemieux ME, Faber J, Vempati S, Sinha AU, Xia X, Jesneck J, Bracken AP, Silverman LB, Kutok JL, Kung AL, Armstrong SA:
H3K79 methylation profiles define murine and human MLL-AF4 leukemias.Cancer Cell2008,14(5):355–368.
12. Shi Y:Histone lysine demethylases: emerging roles in development, physiology and disease.Nat Rev Genet2007,8(11):829–833.
13. Portela A, Esteller M:Epigenetic modifications and human disease.
Nat Biotechnol2010,28(10):1057–1068.
14. Budden DM, Hurley DG, Crampin EJ:Predictive modelling of gene expression from transcriptional regulatory elements.Brief Bioinform 2014,bbu034:. doi:10.1093/bib/bbu034.
15. McLeay RC, Lesluyes T, Partida GC, Bailey TL:Genome-wide in silico prediction of gene expression.Bioinformatics2012,28(21):2789–2796. 16. Cheng C, Gerstein M:Modeling the relative relationship of
transcription factor binding and histone modifications to gene expression levels in mouse embryonic stem cells.Nucleic Acids Res 2012,40(2):553–568.
17. Cheng C, Yan K-K, Yip KY, Rozowsky J, Alexander R, Shou C, Gerstein M:A statistical framework for modeling gene expression using chromatin features and application to modENCODE datasets.
Genome Biol2011,12(2):15.
18. Ouyang Z, Zhou Q, Wong WH:ChIP-Seq of transcription factors predicts absolute and differential gene expression in embryonic stem cells.Proc Natl Acad Sci2009,106(51):21521–21526.
19. Karli´c R, Chung H-R, Lasserre J, Vlahoviˇcek K, Vingron M:Histone modification levels are predictive for gene expression.Proc Natl Acad Sci2010,107(7):2926–2931.
20. Arlot S, Celisse A:A survey of cross-validation procedures for model selection.Stat Surv2010,4:40–79.
21. Chen X, Xu H, Yuan P, Fang F, Huss M, Vega VB, Wong E, Orlov Y. L, Zhang W, Jiang J, Loh Y-H, Yeo HC, Yeo ZX, Narang V, Govindarajan KR, Leong B, Shahab A, Ruan Y, Bourque G, Sung W-K, Clarke ND, Wei C-L, Ng H-H:
Integration of external signaling pathways with the core transcriptional network in embryonic stem cells.Cell2008,
133(6):1106–1117.
22. Meissner A:Epigenetic modifications in pluripotent and differentiated cells.Nat Biotechnol2010,28(10):1079–1088. 23. Epsztejn-Litman S, Feldman N, Abu-Remaileh M, Shufaro Y, Gerson A,
Ueda J, Deplus R, Fuks F, Shinkai Y, Cedar H, Bergman Y:De novo DNA methylation promoted by G9a prevents reprogramming of embryonically silenced genes.Nat Struct Mol Biol2008,
15(11):1176–1183.
24. Feldman N, Gerson A, Fang J, Li E, Zhang Y, Shinkai Y, Cedar H, Bergman Y:
G9a-mediated irreversible epigenetic inactivation of Oct-3/4 during early embryogenesis.Nat Cell Biol2006,8(2):188–194.
25. Cloonan N, Forrest AR, Kolle G, Gardiner BB, Faulkner GJ, Brown MK, Taylor DF, Steptoe AL, Wani S, Bethel G, Robertson AJ, Perkins AC, Bruce SJ, Lee CC, Ranade SS, Peckham HE, Manning JM, McKernan KJ, Grimmond SM:
Stem cell transcriptome profiling via massive-scale mRNA sequencing.Nat Methods2008,5(7):613–619.
26. Mortazavi A, Williams BA, McCue K, Schaeffer L, Wold B:Mapping and quantifying mammalian transcriptomes by RNA-Seq.Nat Methods 2008,5(7):621–628.
27. Flicek P, Amode MR, Barrell D, Beal K, Billis K, Brent S, Carvalho-Silva D, Clapham P, Coates G, Fitzgerald S, Gil L, Gironi CG, Gordon L, Hourlier T, Hunt S, Johnson N, Juettemann T, Kahari AK, Keenan S, Kulesha E, Martin FJ, Maurel T, McLaren WM, Murphy DN, Nag R, Overduin B, Pignatelli M, Pritchard B, Pritchard E, Riat HS:Ensembl 2014.Nucleic Acids Res2014,
42(D1):749–755.
28. Mapping of transcription factor binding sites in mouse embryonic stem cells[http://www.ncbi.nlm.nih.gov/geo/query/acc.cgi?acc= GSE11431]
29. MIT CHiP-seq data[ftp://ftp.broad.mit.edu/pub/papers/chipseq/] 30. Mikkelsen TS, Ku M, Jaffe DB, Issac B, Lieberman E, Giannoukos G, Alvarez
P, Brockman W, Kim T-K, Koche RP, Lee W, Mendenhall E, O’Donovan A, Presser A, Russ C, Xie X, Meissner A, Wernig M, Jaenisch R, Nusbaum C, Lander ES, Bernstein BE:Genome-wide maps of chromatin state in pluripotent and lineage-committed cells.Nature2007,
448(7153):553–560.
31. Meissner A, Mikkelsen TS, Gu H, Wernig M, Hanna J, Sivachenko A, Zhang X, Bernstein BE, Nusbaum C, Jaffe DB, Gnirke A, Jaenisch R, Lander ES:
Genome-scale DNA methylation maps of pluripotent and differentiated cells.Nature2008,454(7205):766–770.
32. Genome-wide in silico prediction of gene expression[http://research. imb.uq.edu.au/t.bailey/supplementary_data/McLeay2011a/]
33. Gene Ontology Consortium download annotations[http://www. geneontology.org/GO.downloads.annotations.shtml]
34. Ashburner M, Ball CA, Blake JA, Botstein D, Butler H, Cherry JM, Davis AP, Dolinski K, Dwight SS, Eppig JT, Harris MA, Hill DP, Issel-Tarver L, Kasarskis A, Lewis S, Matese JC, Richardson JE, Ringwald M, Rubin GM, Sherlock G:
Gene ontology: tool for the unification of biology.Nat Genet2000,
25(1):25–29.
35. Mouse Genome Informatics[http://www.informatics.jax.org/homology. shtml]
36. Voigt P, Tee W-W, Reinberg D:A double take on bivalent promoters.
Genes Dev2013,27(12):1318–1338.
37. Hu G, Cui K, Northrup D, Liu C, Wang C, Tang Q, Ge K, Levens D, Crane-Robinson C, Zhao K:H2A.Z facilitates access of active and repressive complexes to chromatin in embryonic stem cell self-renewal and differentiation.Cell Stem Cell2013,12(2):180–192. 38. Ku M, Jaffe JD, Koche RP, Rheinbay E, Endoh M, Koseki H, Carr SA,
Bernstein BE:H2A.Z landscapes and dual modifications in pluripotent and multipotent stem cells underlie complex genome regulatory functions.Genome Biol2012,13(10):1–13.
39. Jin VX, O’Geen H, Iyengar S, Green R, Farnham PJ:Identification of an OCT4 and SRY regulatory module using integrated computational and experimental genomics approaches.Genome Res2007,
40. Xu X, Bieda M, Jin VX, Rabinovich A, Oberley MJ, Green R, Farnham PJ:A comprehensive ChIP–chip analysis of E2F1, E2F4, and E2F6 in normal and tumor cells reveals interchangeable roles of E2F family members.Genome Res2007,17(11):1550–1561.
41. Schreiber SL, Bernstein BE:Signaling network model of chromatin.Cell 2002,111(6):771–778.
42. Baba K, Shibata R, Sibuya M:Partial correlation and conditional correlation as measures of conditional independence.Aust N Z J Stat 2004,46(4):657–664.
43. Benjamini Y, Hochberg Y:Controlling the false discovery rate: a practical and powerful approach to multiple testing.J R Stat Soc Series B (Methodological)1995,57:289–300.
44. Welch BL:The generalization of Student’s problem when several different population variances are involved.Biometrika1947,
34:28–35.
45. Dixon JR, Selvaraj S, Yue F, Kim A, Li Y, Shen Y, Hu M, Liu JS, Ren B:
Topological domains in mammalian genomes identified by analysis of chromatin interactions.Nature2012,485(7398):376–380.
46. Zhou G-L, Xin L, Song W, Di L-J, Liu G, Wu X-S, Liu D-P, Liang C-C:Active chromatin hub of the mouseα-globin locus forms in a transcription factory of clustered housekeeping genes.Mol Cell Biol2006,
26(13):5096–5105.
47. Phillips JE, Corces VG:CTCF: Master weaver of the genome.Cell2009,
137(7):1194–1211.
48. Gaszner M, Felsenfeld G:Insulators: exploiting transcriptional and epigenetic mechanisms.Nat Rev Genet2006,7(9):703–713. 49. Thoma F, Koller T, Klug A:Involvement of histone H1 in the
organization of the nucleosome and of the salt-dependent superstructures of chromatin.J Cell Biol1979,83(2):403–427. 50. Tazi J, Bird A:Alternative chromatin structure at CpG islands.Cell
1990,60(6):909–920.
51. Cloutier TE, Librizzi MD, Mollah A, Brenowitz M, Willis IM:Kinetic trapping of DNA by transcription factor IIIB.Proc Natl Acad Sci2001,
98(17):9581–9586.
52. Nikolov D, Burley S:RNA polymerase II transcription initiation: a structural view.Proc Natl Acad Sci1997,94(1):15–22.
53. He X, Samee MAH, Blatti C, Sinha S:Thermodynamics-based models of transcriptional regulation by enhancers: the roles of synergistic activation, cooperative binding and short-range repression.PLoS Comput Biol2010,6(9):1000935.
54. Mariani L, Löhning M, Radbruch A, Höfer T:Transcriptional control networks of cell differentiation: insights from helper T lymphocytes.
Progress Biophys Mol Biol2004,86(1):45–76.
55. Marbach D, Costello JC, Küffner R, Vega NM, Prill RJ, Camacho DM, Allison KR, Kellis M, Collins JJ, Stolovitzky G:Wisdom of crowds for robust gene network inference.Nat Methods2012,9(8):796–804.
56. Maetschke SR, Madhamshettiwar PB, Davis MJ, Ragan MA:Supervised, semi-supervised and unsupervised inference of gene regulatory networks.Brief Bioinform2014,15(2):195–211.
57. Sherwood RI, Hashimoto T, O’Donnell CW, Lewis S, Barkal AA, van Hoff JP, Karun V, Jaakkola T, Gifford DK:Discovery of directional and
nondirectional pioneer transcription factors by modeling DNase profile magnitude and shape.Nat Biotechnol2014,32(2):171–178. 58. Scripts and supplementary data[http://sourceforge.net/projects/
budden2014exploring/]
59. The ENCODE Project Consortium:An integrated encyclopedia of DNA elements in the human genome.Nature2012,489(7414):57–74. 60. Trapnell C, Williams BA, Pertea G, Mortazavi A, Kwan G, van Baren MJ,
Salzberg SL, Wold BJ, Pachter L:Transcript assembly and quantification by RNA-Seq reveals unannotated transcripts and isoform switching during cell differentiation.Nat Biotechnol2010,28(5):511–515. 61. List of housekeeping genes[http://www.tau.ac.il/elieis/HKG/] 62. Eisenberg E, Levanon EY:Human housekeeping genes, revisited.
Trends Genet2013,29(10):569–574.
63. Bolstad BM, Irizarry RA, Åstrand M, Speed TP:A comparison of normalization methods for high density oligonucleotide array data based on variance and bias.Bioinformatics2003,19(2):185–193. 64. Basak D, Pal S, Patranabis DC:Support vector regression.Neural Inf
Processing Letters Rev2007,11(10):203–224.
65. Harel O:The estimation ofR2and adjustedR2in incomplete data
sets using multiple imputation.J Appl Stat2009,36(10):1109–1118.
66. Knijnenburg TA, Wessels LF, Reinders MJ, Shmulevich I:Fewer permutations, more accuratep-values.Bioinformatics2009,
25(12):161–168.
67. Wang C, Tian R, Zhao Q, Xu H, Meyer CA, Li C, Zhang Y, Liu XS:
Computational inference of mRNA stability from histone modification and transcriptome profiles.Nucleic Acids Res2012,
40(14):6414–6423.
doi:10.1186/1756-8935-7-36
Cite this article as:Buddenet al.:Predicting expression: the
complementary power of histone modification and transcription factor binding data.Epigenetics & Chromatin20147:36.
Submit your next manuscript to BioMed Central and take full advantage of:
• Convenient online submission
• Thorough peer review
• No space constraints or color figure charges
• Immediate publication on acceptance
• Inclusion in PubMed, CAS, Scopus and Google Scholar
• Research which is freely available for redistribution