R E S E A R C H
Open Access
MK3 controls Polycomb target gene expression
via negative feedback on ERK
Peggy Prickaerts
1,3, Hanneke EC Niessen
1†, Emmanuèle Mouchel-Vielh
3†, Vivian EH Dahlmans
1,
Guus GH van den Akker
1, Claudia Geijselaers
1, Michiel E Adriaens
2, Frank Spaapen
1, Yoshihiro Takihara
4,
Ulf R Rapp
5, Frédérique Peronnet
3and Jan Willem Voncken
1*Abstract
Background:Gene-environment interactions are mediated by epigenetic mechanisms. Polycomb Group proteins constitute part of an epigenetic cellular transcriptional memory system that is subject to dynamic modulation during differentiation. Molecular insight in processes that control dynamic chromatin association and dissociation of Polycomb repressive complexes during and beyond development is limited. We recently showed that MK3 interacts with Polycomb repressive complex 1 (PRC1). The functional relevance of this interaction, however, remained poorly understood. MK3 is activated downstream of mitogen- and stress-activated protein kinases (M/SAPKs), all of which fulfill crucial roles during development. We here use activation of the immediate-early response geneATF3, abona fidePRC1 target gene, as a model to study how MK3 and its effector kinases MAPK/ERK and SAPK/P38 are involved in regulation of PRC1-dependentATF3transcription.
Results:Our current data show that mitogenic signaling through ERK, P38 and MK3 regulatesATF3expression by PRC1/chromatin dissociation and epigenetic modulation. Mitogenic stimulation results in transient P38-dependent H3S28 phosphorylation and ERK-driven PRC1/chromatin dissociation at PRC1 targets. H3S28 phosphorylation by itself appears not sufficient to induce PRC1/chromatin dissociation, norATF3transcription, as inhibition of MEK/ERK signaling blocks BMI1/chromatin dissociation andATF3expression, despite induced H3S28 phosphorylation. In addition, we establish that concomitant loss of local H3K27me3 promoter marking is not required forATF3 activation. We identify pERK as a novel signaling-induced binding partner of PRC1, and provide evidence that MK3 controlsATF3expression in cultured cells via negative regulatory feedback on M/SAPKs. Dramatically increased ectopic wing vein formation in the absence ofDrosophilaMK in aDrosophilaERK gain-of-function wing vein patterning model, supports the existence of MK-mediated negative feedback regulation on pERK.
Conclusion:We here identify and characterize important actors in a PRC1-dependent epigenetic signal/response mechanism, some of which appear to be nonspecific global responses, whereas others provide modular specificity. Our findings provide novel insight into a Polycomb-mediated epigenetic mechanism that dynamically controls gene transcription and support a direct link between PRC1 and cellular responses to changes in the
microenvironment.
Keywords:Polycomb, MAPKAPK3, MK3, ERK, epigenetic, feedback, dynamic
* Correspondence:[email protected] †Equal contributors
1Department of Molecular Genetics, GROW School for Oncology and
Developmental Biology, Maastricht University, Universiteitssingel 50, 6229ER, Maastricht, The Netherlands
Full list of author information is available at the end of the article
Background
Mitogen- and stress-activated protein kinase (M/SAPK) signaling pathways relay environment-to-gene informa-tion and enable physiologically appropriate cellular responses [1]. MK3 is an interaction partner of extracel-lular signal-regulated kinase (ERK) and P38 and is tar-geted by all three M/SAPK signaling cascades [2]; these phosphorylation cascades induce multiple responses, among which is altered gene transcription [3,4].
We previously demonstrated that mitogen-activated protein kinase-activated protein kinase 3 (MK3/3pK/ MAPKAPK3) binds Polycomb repressive complex 1 (PRC1), via the self-association motif (SAM)-domain of PHC [5]. Polycomb Group and Trithorax Group pro-teins maintain transcriptionally repressed and activated epigenetic states respectively and as such are part of an important cellular transcriptional memory system. Al-though PRC1-mediated transcriptional repression has long been considered a stable repressive state, increasing evidence indicates that PRC1 repression is a dynamic process [6,7]. Genome-wide chromatin association studies
have revealed changes in Polycomb/chromatin distribu-tion and transcripdistribu-tional reprogramming during lineage commitment and differentiation [8-10]. As M/SAPKs and MKs also play important roles in differentiation, develop-ment and cell proliferation, the physical association of PRC1 and MK3 suggests a functionally relevant connec-tion. We have previously established that PRC1/chromatin dissociation correlates with their phosphorylation status during cell cycle progression [11]. Subsequently, we showed that acute mitogenic and stress signaling also results in PRC1/chromatin dissociation [5]. The molecular mechanisms that underlie this dynamic relocation of PRC1 and the exact role of MK3 in signaling to chromatin remained unknown. We here hypothesized that M/SAPK-MK signaling imposes a molecular mechanism by which cells regulate PRC1/chromatin association and PRC1 tar-get gene expression in response to environmental cues. We used the previously identified PRC1 target geneATF3
to study PRC1-mediated transcriptional regulation [12].
ATF3 is an immediate-early response gene (IEG) [13]; relevantly, ERK and MK have been implicated in IEG
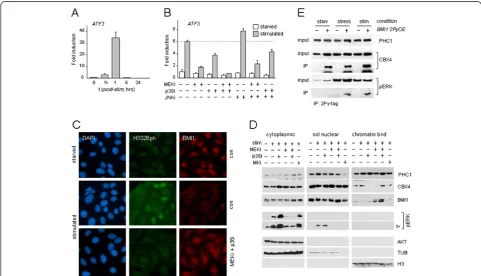
Figure 1PRC1 target gene expression is controlled by M/SAPKs. (A,B)PRC1 target geneATF3expression (mRNA) in mitogen-stimulated (FCS/TPA) TIG3 cells, in the absence or presence of kinase inhibitors; data ± SD.(C)H3S28ph and BMI1 staining in starved or mitogen-stimulated U2-OS cells; DAPI: nuclear counterstain.(D)Subcellular PRC1 protein distribution in starved and stimulated U2-OS cells; nuclear soluble and chromatin-bound fractions were proportionally loaded; nuclear fractions correspond to approximately three to four cytoplasmic equivalents. Cytoplasmic and nuclear fractions were always loaded on the same gel for direct quantitative comparison (corresponding sections are shown separately; representative experiment shown). AKT, TUB, H3: fractioning and loading controls (quantification chromatin-bound BMI1: compare Additional file 1: Figure S1C).(E)Induced interaction of pERK and BMI1 in response to mitogens (stim) or selenite (stress) in U2-OS cells; loading controls: PRC1 proteins CBX4 and PHC1; PCR1 interaction confirmed by BMI1/CBX4 co-immunoprecipitation (co-IP); +/−: transfectedBMI1-2Py
activation [14]. Therefore, mitogen-induced ATF3 activa-tion represents a suitable model to study the biological relevance of ERK/MK3/PRC1 signaling. Our current data establish that ATF3 expression is dynamically controlled by MAPK/MK/PRC1, and identify important players in an epigenetic switch-module in response to changes in the cellular microenvironment.
Results and Discussion
M/SAPK signaling controls PRC1 target gene transcription To determine how M/SAPKs are implicated in Polycomb-mediated repression, transcription of the PRC1 target gene ATF3 was measured in the presence or absence of kinase inhibitors. All cells were serum starved (G0/G1-ar-rest) prior to stimulation throughout this study, to avoid interference by late S/G2-associated PRC1/chromatin dis-sociation [11]. ERK, P38 and jun N-terminal kinase (JNK) are all phosphorylated in response to mitogenic stimula-tion (Addistimula-tional file 1: Figure S1A). Consistent with immediate-early response kinetics, ATF3 mRNA levels rapidly increase and peak at 60 minutes after stimulation (Figure 1A). P38 inhibition (p38i) and MEK/ERK inhib-ition (MEKi) both substantially and reproducibly reduce
ATF3 induction; the effect of ERK inhibition is consist-ently stronger than p38i (± 3- to 4-fold versus ± 1.5- to 2-fold, respectively); combining both inhibitors blocksATF3
expression completely; JNK inhibition (JNKi) slightly enhancesATF3induction (Figure 1B). Various PRC1 pro-teins cluster to pericentromeric heterochromatin-associated Polycomb Group nuclear bodies (PcG-NB) in several cancer cell lines [11,15,16]. Using PcG-NB/ chro-matin dissociation in U2-OS cells as a read-out for PRC1/ chromatin binding [5,11], we find that PcG-NB/chromatin dissociation correlates well with increased histone H3 phosphorylation at Ser28 (H3S28ph) in mitogen-stimulated control cells, in concordance with previous observations [5], and that combined MEKi/p38i blocks both events (Figure 1C). H3S28 is phosphorylated by nu-merous triggers and MAPKAPK-family kinases, including RSKs and MSKs [17,18]. Of note, immediate-early re-sponse genes (IEG) are controlled by MKs and local H3S28 phosphorylation [14,19]. In the context of mito-genic stimulation, we find that P38i alone can block H3S28ph and chromatin dissociation of the PRC1 protein BMI1, whereas BMI1/chromatin binding is largely retained when ERK signaling is interrupted (MEKi), with-out affecting H3S28ph (Additional file 1: Figure S1B). These results support the notion that P38 targets H3S28 and that ERK signaling may target PRC1/chromatin asso-ciation, and possibly PRC1 protein function and/or inter-action. To examine the effect of mitogenic stimulation on subnuclear distribution of PRC1 proteins (in the presence or absence of kinase inhibitors), cells were differentially extracted to yield cytoplasmic, soluble nuclear and
chromatin-bound fractions. We previously found that the PRC1 protein PHC1 undergoes a global chromatin redis-tribution in response to cell stress in contrast to some other PRC1 members [5]; as such, determination of total (that is, PcG-NB and global) PRC1 protein/chromatin as-sociation is pivotal. Of note: mitogenic stimulation differ-entially affects global PHC1/, CBX4/ (both increased) and BMI1/chromatin association (decreased), suggesting dif-ferential regulation of PRC1 members by M/SAPKs. Con-sistent with this, single inhibitor treatment (p38i or MEKi) clearly affects chromatin association of PRC1 proteins in distinct ways (Figure 1D). Combined inhibitor treatment of stimulated cells shows that more BMI1 remains chro-matin-associated, consistent with the immunofluorescence (IF) analysis (Figure 1D,C, Additional file 1: Figure S1C); also CBX4/ and PHC1/chromatin binding are increased under p38i/MEKi conditions. The fluctuation of CBX4 levels suggests a direct involvement of phosphorylation in relation to chromatin association. Besides differential phosphoregulation of PRC1 proteins by M/SAPKs, the above findings predicted an interaction between MAPK and PRC1, downstream of mitogenic signaling. Indeed, co-immunoprecipitation analyses confirm a signaling-induced interaction between pERK and PRC1 complexes (Figure 1E). The PRC1/pERK interaction is counteracted by P38 signaling, as more pERK co-precipitates in a PRC1-directed IP in p38i cells (Additional file 1: Figure S1D, compare Figure 1D), in support of cross-talk be-tween kinases at multiple levels. The combined data dem-onstrate that mitogenic signaling, via both activated P38 and ERK, converges at the level of PRC1/chromatin regu-lation and target-gene activation, and establish a relevant functional interaction between these signal transducers and PRC1.
Transcription correlates with PRC1 dissociation, not loss of H3K27me3
the reduced CBX8/chromatin association (Additional file 2: Figure S2B). In contrast to CBX8, PHC1 increases at all non-induced loci (Figure 2A, Additional file 2: Figure S2A). The contrasting chromatin-binding dynamics of CBX8 and PHC1 in response to signaling are in good agreement with our previous observation that PHC1/ chromatin binding appears to increase globally in the con-text of cell cycle progression or cell stress, whereas detec-tion of other PRC1 members in PcG-NB (like BMI1, CBX4 and RNF2) is reduced [5,11]. Of note, PHC/PRC1-core complex association was reported to be relatively weak [20]. In addition, purified PHC1 is known to reside in non-PRC complexes [21]. Combined, these results indi-cate that PHC1 occupation occurs without the need for simultaneous CBX8 binding, and further supports the no-tion of differential regulano-tion of PRC1-complex members.
The observation that both CBX8 and PHC1 removal cor-relate with ATF3 expression, whereas PHC1 is retained/ increased at the CDKN2A/INK4A locus (Figure 2A, Add-itional file 2: Figure S2A) suggests that multiple/all PRC1-core complex members may need to dissociate at crucial regulatory regions to allow active transcription. It is con-ceivable that signaling through M(S)APK/MK3/PRC1 changes the local epigenomic state from a repressed/ poised state [12,22,23] to a ‘de-repressed’and eventually fully transcriptionally active state through progressive loss of PRC1 members.
Consistent with a global mitogen-induced increase of H3S28ph, ChIP analysis shows increased H3S28ph en-richment at PRC1 targets as well as non-targets; this epi-genetic change occurs independent of transcriptional induction (Figure 2B, Additional file 2: Figure S2A). Re-markably, the unaltered H3K27me3 occupation at the
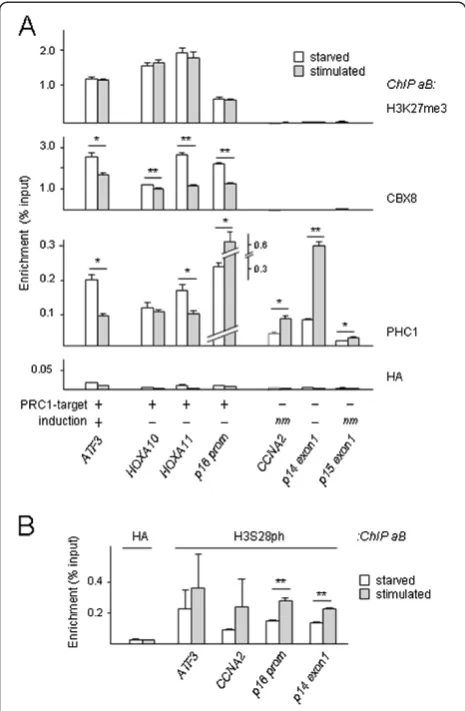
ATF3 promoter suggests that transcriptional activation of PRC1 target genes occurs without concomitant loss of H3K27me3 (Figure 2A). Thus, although PcG-NB/chro-matin dissociation and H3S28ph correlate well [5,24,25], H3S28ph by itself does not determine transcriptional status. In addition, our findings argue that local main-tenance of H3K27me3 does not obstruct transcriptional reactivation of PCR1 targets. The recently reported pres-ence of H3K27me3 marks on active promoters supports this notion [26]. Whether or not the H3K27me3 mark needs to be removed at reactivated genes remains contradictory at this point [24-26], and may, besides on models and tools used, depend on the subgenic location of epigenetic modifications (possibly in conjunction with other modifications). Consistent with this idea, repres-sive H3K27me3 marking correlates best with transcrip-tion at loci that display ‘blanketing’-type H3K27me3 enrichment, that is, gene body-wide (downstream of the transcription start site (TSS)) [26]. It is conceivable that H3K27me3 promoter marking defines a specific class of response factors, which are dynamically controlled by rapid removal of PRC1 complexes. Thus far, our H3S28ph analyses suggest that H3S28ph, like CBX8 dis-sociation, is a global event; despite being essential for PRC1 target gene activation, it is clearly not the sole de-termining factor and as such is unlikely to specify regu-lation only at PRC1 target genes. Co-occurrence of methylphosphoryl modifications on adjacent histone lysines and serines was proposed to act as a binary epi-genetic switch mechanism, by affecting chromobox-domain binding to histone-trimethyl marks [24,27-29]; Interestingly, also EZH2/chromatin dissociation at muscle-specific promoters during myogenesis appears driven by local H3K27 methyl/H3S28 phosphoryl modification [30,31]. The simultaneous detection of local H3S10ph and HP1 binding, however, seemingly challenges the strictness of the methylphosphoryl switch concept [32]. Irrespective Figure 2PRC1/chromatin dissociation, not loss of H3K27me3,
of the exact mechanism, our combined molecular epigen-etic analyses suggest PRC1 target gene activation does not require loss of H3K27me3 and point to chromatin dissoci-ation of multiple PRC1 proteins as an important event in transcription initiation.
MK3 negatively regulates ERK signaling
To determine the role of MK in PRC1 target gene regu-lation, we next studied the effects of MK inhibition or MK protein level modulation on ATF3 gene expression in TIG3 and U2-OS cells. MK inhibition (MKi) releases basal repression ofATF3in starved MKi cells and allows for more robust ATF3 mRNA induction; in contrast, treatment with MEKi or p38i, both suppress transcrip-tion (Figure 3A, Additranscrip-tional file 3: Figure S3A). Of note: MKi does not show an added effect on ATF3 mRNA synthesis in combination with other single or multiple kinase inhibitors, suggesting that MKs exert their effect
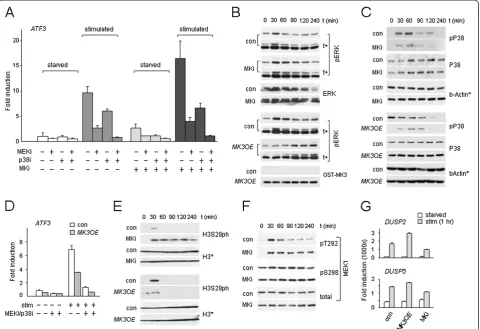
upstream of ERK and P38 signaling (Figure 3A). Thus, our data suggests a negative regulatory role for MKs in mitogenic signaling through MEK/ERK. In good agree-ment with this data, MK-deficient cells (by MKi or shRNA-mediated knockdown (shMK)) display sustained ERK1/2:T202/T204 phosphorylation (pERK; up to 90 to 120 minutes, compared to control cells) upon stimula-tion (Figure 3B, Addistimula-tional file 3: Figure S3B,C). Con-versely, MK3 overexpression (MK3OE) reduces both basal and induced ATF3 transcription, and, in combin-ation with MEKi/p38i, further represses expression (Figure 3D). As predicted, MK3OE delays ERK phos-phorylation, consistent with an inhibitory action of MK3 on ERK activity and reduced target-gene induction (Figure 3B,D, Additional file 3: Figure S3B). MK2 was re-cently found to stabilize P38 in a kinase domain-independent manner, that is, physical association of MK2 to P38 controls P38 stability [33]. Analogous with Figure 3MK3 is a negative regulator of ERK. (A,D)mRNA expression of PRC1 target geneATF3as a function of kinase inhibition(A)orMK3OE
(D)in TIG3 cells.(B,C, E, F)(p)ERK(B), (p)P38(C), H3S28ph(E)and (p)MEK(F)levels in starved and stimulated U2-OS cells in relation to MK function; t (min): time post-stimulation in minutes; *: loading controls for corresponding panels; t+: longer exposure. Samples corresponding to control and experiment (MK3OEor MKi) were always loaded on the same gel to enable direct quantitative analysis (corresponding sections are shown separately; representative experiment shown; quantification pERK profiles: compare Additional file 3: Figure S3B).(G)Mitogen-induced
this report, we detect a rise in P38 levels inMK3OEcells versus reduced P38 levels in shMKcells; relevantly, P38 levels remain unaltered in MKi cells (Figure 3C, Additional file 3: Figure S3D). Contrary to pERK, P38: T180/T182 phosphorylation (pP38) is reduced in
MK3OE cells as well as in shMK and MKi cells. Also JNK:T183/T185 phosphorylation (pJNK) is reduced by
shMK, whereas MK3OE correlated with enhanced JNK levels (Additional file 3: Figure S3E,F). Although the full extent of factors and mechanisms controlling M/SAPK phosphorylation is not clear at this point, these findings are in keeping with multiple complex regulatory cross-interactions between MKs and M/SAPKs [3,34].
Consistent with our IF analyses (compare Figure 1C, Additional file 1: Figure S1B), H3S28 shows rapid and transitory phosphorylation kinetics in response to mito-gens (Figure 3E). Relevantly, global H3S28ph is increased and sustained in MKi cells, whereas it is blunted in MK3OEcells (Figure 3E) in line with altered PRC1 target gene expression under these respective con-ditions (compare Figure 3A,D). This data demonstrates that H3S28 phosphorylation kinetics respond to MK3 activity, and support a regulatory role for MK3 in epi-genetic modulation of cell responses to environmental stimuli.
To gain further insight into the molecular mechanisms by which MK3 controls M/SAPK activity, we studied MEK, an ERK effector kinase. MEKpT292 and MEKpS298 were examined, as these two phosphoresidues are part of a mechanism that controls MEK activity [35]. Like pERK, MEKpT292 is also sustained in MK-deficient cells, sug-gesting that MK3 controls phosphatase activity directed toward upstream kinases (Figure 3F). Dual-specificity phosphatases (DUSPs) play important roles in feedback loops on phosphorylation cascades [36]. DUSP2 and
DUSP5induction meet the criteria of being dependent on mitogenic signaling and on MK, asMK3OEand MKi, en-hance and decreaseDUSPmRNA induction, respectively (Figure 3G). To validate the involvement of DUSPs in the negative regulatory network involving MK3, we used in-duction of EGR1 as a read-out for mitogen-induced ERK activity [37]. MKi cells display a stronger EGR1 induction (Additional file 4: Figure S4A), consistent with loss of negative regulation via ERK. To validate a role for phos-phatase activity in regulation of the ERK/EGR1 response, cells were pretreated with orthovanadate, a generic DUSPs inhibitor (DUSPi). Enhanced EGR1 expression in the pres-ence of DUSPi resembles that observed in MKi cells and supports a negative regulatory role for DUSPs in the MK3/ERK/EGR1 response (Additional file 4: Figure S4B); in line with reduced negative feedback in DUSPi cells, both pERK and pP38 are increased in response to mito-genic stimulation. Relevantly, also signaling-induced H3S28ph levels are enhanced significantly in the presence
of DUSPi, in agreement with a functional role for DUSPs in epigenetic regulation (Additional file 4: Figure S4B). Relevantly, the reduced ERK phosphorylation byMK3OE
is partially reversed by DUSP inhibition, suggesting that DUSP activity acts as part of a relay system in the regula-tory feedback of MK3 to MEK/ERK (Additional file 4: Figure S4C). Combined, the above findings support a negative regulatory role for MKs in MEK/ERK signaling, at least in part, via induction and/or activation of phosphatases.
To obtain independent proof for the functional relation-ship between MKs and M/SAPKs, we examined kinase interactions in Drosophila melanogaster. We first repro-duced a signaling-inrepro-duced interaction between Ph-p (PHC1/2 ortholog) and dMK2 (the onlyMK ortholog in
D. mel) in cultured insect cells (Additional file 5: Figure S5A). We next exploitedDrosophilawing vein patterning to probe for M/SAPK-MK interaction in vivo. Wing vein formation in the fruit fly is dependent on MAPKs [38-40]. As expected, gain-of-function (GOF) lines fordERK/rolled
(sd::Gal4 > UAS::rolled; D.melERK ortholog) show ectopic wing veins during wing imaginal disc development (Figure 4A,B). We here report that flies overexpressing D-p38b (sd::Gal4 > UAS::D-p38b; one of the D.mel P38 orthologs) also display enhanced ectopic vein formation (Figure 4A,B). Hence the ectopic vein phenotype can be used to gauge the effects of MK loss-of-function (LOF) on ERK/P38 pathway activity. To determine the effect of dMK2 on dERK and D-p38b, we crossed a transgenic RNAi-mediateddMK2-knockdown line (v3171) todERK -and D-p38b-GOF lines (see: Methods section, Additional file 5: Figure S5B). dMK2-LOF enhances the dERK-GOF ectopic vein phenotype (Figure 4A,B). In contrast,dMK2 -LOF suppresses the ectopic vein phenotype induced by D-p38b-GOF (Figure 4A,B). Importantly, this data is fully congruent with our in vitro findings in mammalian cells and supports the existence of a complex genetic network between MAPKs, SAPKs and MKs. In conclusion, our
in vivoexperiments substantiate a negative regulatory role ofdMK2ondERK-signaling in wing vein development. Conclusions
presence of PRC1/MK3 likely contributes to chromatin targeting of pERK and provides specific local regulation. PRC-complex members are emerging as proteins har-boring many different functions and binding partners [7]. We recently categorized ± 120 known phosphoryl-ation sites on a limited number of PRC proteins; many of these sites are predicted M/SAPK target sites and are likely to cooperate in gene regulation [41-44]. Although some phosphosites have been linked to PRC protein function [45-49], the biological relevance of the vast ma-jority of these phosphorylation events is currently un-known. Our findings pave the way for detailed mutational analysis of the functional consequences of post-translational modification of Polycomb proteins. The find-ings presented herein provide novel insight into differen-tial regulation of PRC1 members in response to signaling and add to the growing recognition that PRC1-mediated repression is a highly dynamic process.
Methods
Cell culture, viral infections
Human U2-OS osteosarcoma cells and TIG3 primary human fibroblasts expressing the murine ecotropic
(Sigma) preceding experiments. Expression of all plasmid constructs was verified by immunoblotting.
Cells were serum-starved at 0.1% FCS for 48 hours. Mitogenic stimulation was achieved by supplementing 15% FCS/100 ng/ml tetradecanoylphorbol acetate (TPA; Sigma) for 45 minutes or as indicated. Cells were pre-treated with kinase inhibitors: 30 minutes 10 μM MEK inhibitor (U0126; Promega, Madison, WI, USA), 30 min-utes 10μM MK inhibitor (MK2a Inhibitor; Calbiochem/ Merck, Darmstadt, Germany), 30 minutes 20μM p38 in-hibitor (SB202190; Calbiochem), 30 minutes 25μM JNK inhibitor (SP600125; Biomol, Plymouth Meeting, PA, USA), 30 minutes 85 μM etoposide (ETP; Calbiochem). MK2a was confirmed to inhibit MK3 (data not shown). Cells were preincubated with sodium orthovanadate for 30 minutes prior to mitogenic stimulation at indicated concentration; control cells were incubated with solvent. Sodium selenite (Sigma) -treated cells (90 minutes 0.2 mM) were used as a positive control. DrosophilaS2 cells were cultured at 25°C in Schneider medium with
10% FCS. The day before transfection, 5.106 cells were transferred in medium with 0.1% FCS. For transfection, 2μg of plasmid DNA were mixed with Effecten™ trans-fection reagent (Qiagen, Hilden, Germany) according to manufacturer’s instructions (1/10 DNA-Effecten™ratio). Forty-eight hours later, cells were either untreated, sti-mulated with 10% FCS/100 ng/ml TPA or 0.5 mM so-dium meta-arsenite for two hours at 25°C. For immunoprecipitation (IP) experiments, plasmids Act:: Myc-Ph and Act::EGFP-MAPKAP were co-transfected into S2 Drosophila cells grown in 0.1% FCS. IPs were performed as described (Mouchel-Vielh et al., 2011); IP antibodies are listed in Additional file 6: Table S1.
Expression constructs
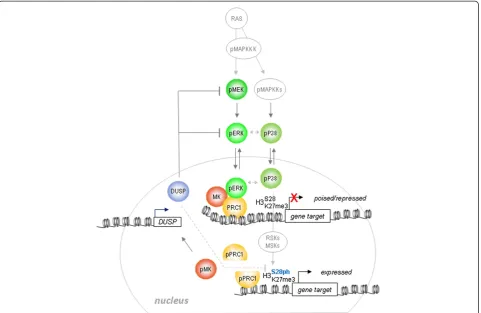
Retroviral vectors (pBMN-LZRS.ires.GFP, pBMN-LZRS. ires.NEO) expressing murine BMI1-2Py or GST-MK3 have been described elsewhere [5,11]. Retroviral systems were used as published [51,52]. RNA-interfering MK3 Figure 5Model for MAPK/MK regulation of PRC1 target genes.The PRC1/MK/ERK module represents a molecular switch mechanism: fine-tuning of converging P38 and ERK signals at the chromatin level triggers a potential methylphosphoryl switching module and a signaling-dependent disruption of the PRC1/chromatin association that permits gene activation. Transient H3S28ph, but not removal of H3K27me3, accompanies gene expression.
sequences were cloned into stable shRNA vectors [53]; targeting sequences: Additional file 7: Table S2.
The dMK2 cDNA was amplified from clone SD05481 (Drosophila Genomics Resource Center; for oligonucleo-tides: see Additional file 7: Table S2). The resulting amplicon was introduced into pENTR/D-TOPO™ (Invi-trogen, Carlsbad, CA, USA), then transferred through LR-recombination into T. Murphy’s vectors pAWG
(https://dgrc.cgb.indiana.edu/vectors). Similarly, a cDNA corresponding to the C-terminal part of Drosophila
Polyhomeotic-proximal gene (PhorPh-p) was amplified, introduced in pENTR/D-TOPO™, and subsequently transferred in pAMW (for oligonucleotides: see Additional file 7: Table S2) [54]. Ph sequences in the
Act::myc-Ph construct endoded the 346 C-terminal amino acids of the Ph-proximal protein (GenPept quali-fiers: NP_476871.2 GI:24639272) and included the SAM domain through which MK3 and PHC1/2 interact [5].
Chromatin immunoprecipitation (ChIP) assays
ChIPs on primary human fibroblasts were performed and analyzed essentially as described [12]. Cells were fixed for 10 minutes in 1% formaldehyde/phosphate buf-fered saline (PBS) and stopped by 5 minutes incubation in glycine (final concentration: 0.125 M). Fixed cells were washed twice with PBS and harvested in SDS buf-fer (50 mM Tris at pH 8.1, 100 mM NaCl, 0.5% SDS, and 5 mM EDTA), supplemented with protease inhibi-tors (aprotinin, antipain and leupeptin all at 5μg/ml and 1 mM PMSF). Cells were pelleted by centrifugation, and suspended in IP buffer (100 mM Tris at pH 8.6, 100 mM NaCl, 0.3% SDS, 1.7% Triton X-100, and 5 mM EDTA), containing protease inhibitors. Cells were dis-rupted by sonication, yielding genomic DNA fragments with a bulk size of 200 to 500 bp. For each IP, 1 ml of lysate was precleared by adding 35μl of blocked protein A beads (Protein A-Sepharose/CL-4B (GE Healthcare, Piscataway, NJ, USA); 0.5 mg/ml fatty acid-free BSA (Sigma); and 0.2 mg/ml herring sperm DNA in TE buf-fer), followed by centrifugation. 10 μl aliquots of pre-cleared suspension were put aside as input DNA and kept at 4°C. Samples were immunoprecipitated overnight at 4°C. HA antiserum was used as negative control. Im-mune complexes were recovered by adding 40 μl of blocked protein A or G beads (GE Healthcare) and incu-bated for 4 hours at 4°C. Beads were washed three times in 1 ml of mixed micelle buffer (20 mM Tris at pH 8.1, 150 mM NaCl, 0.2% SDS, 1% Triton X-100, 5 mM EDTA, and 5% w/v sucrose), twice in 1 ml of buffer 500 (50 mM HEPES at pH 7.5, 1% Triton X-100, 1 mM EDTA, and 0.1% w/v sodium deoxycholate), twice in 1 ml of LiCl detergent wash buffer (10 mM Tris at pH 8.0, 1 mM EDTA, 0.5% sodium deoxycholate, 0.5% NP-40, and 250 mM LiCl), and once in 1 ml TE buffer.
Immune complexes were eluted from beads in 250 μl elution buffer (1% SDS and 0.1 M NaHCO3) for 2 hours at 65°C (continuous shaking at 1000 rpm), and after cen-trifugation, supernatants were collected. 250 μl elution buffer was added to input DNA samples and these were processed in parallel with eluted samples. Cross-links were reversed overnight at 65°C, followed by 2 hours di-gestion with RNase A at 37°C and 2 hours proteinase K (0.2 μg/μl) at 55°C. DNA fragments were recovered using QIAquick PCR purification columns, according to manufacturer’s instructions (Qiagen, Hilden, Germany). Samples were eluted in 75μl EB buffer and then diluted 1:5 in TE buffer. Immunoprecipitated DNA was quanti-fied by real-time PCR (for ChIP antisera, primers: see Additional file 6: Tables S1, Additional file 7: Table S2). Each experiment was performed in triplicate. Results of one representative experiment are shown.
RNA isolation, cDNA synthesis, real-time (RT) PCR analysis For RT-PCR analysis, total RNA was isolated using Tri Reagent (Sigma) according to the manufacturer’s proto-col. Quantity and quality of the RNA were determined by 260/280 nm and 260/230 nm absorbance measure-ments, respectively, using the Nanodrop (Witec AG, Luzern, Switzerland). Total RNA (1μg) for each sample/ replicate was converted into first strand cDNA using the iScript™ cDNA synthesis kit (Bio-Rad, Hercules, CA, USA) according to the manufacturer’s instructions. Gene expression was determined by RT-PCR using the MyiQ™ thermal cycler (Bio-Rad) in combination with the IQ5 version 2.1 software (Bio-Rad). RT-PCR was performed on 25 ng of cDNA using the qPCR iQ™ Cus-tom SYBR™Green Supermix with fluorescein (Bio-Rad) and 300nM primer in 96-well plates (Bio-Rad). For each primer pair a standard curve was generated with a serial dilution of a cDNA pool. RT-PCR data was analyzed according to the relative standard curve method. All values were normalized to either beta-Actin(Additional file 2: Figure S2) or cyclophillin A (Figures 1,3, Add-itional file 1: Figure S1, AddAdd-itional file 3: Figure S3). The control condition is used as a reference. Primer sets for the selected genes were developed with Primer Express version 2.0 (Applied Biosystems, Foster City, CA, USA) using default settings (Additional file 7: Table S2).
Immunofluorescence
stored at 4°C in 70% ethanol (EtOH) or directly washed three times with PBS and used for immunocytochem-istry (IC). For detection of PRC1 proteins and histone modifications, cells were first permeabilized for 10 min-utes at RT in 0.2% Triton X-100 (TrX) in PBS. After ex-tensive washing in PBS/0.02% TrX, cells were incubated with primary antibody (Additional file 6: Table S1) for 1.5 to 2.5 hours in a prewarmed humidified chamber at 37°C, washed five times in PBS/0.02% TrX and incu-bated with fluorescently labeled secondary antibody for 60 minutes at 37°C. 4′-6-diamidino-2-phenylindole (DAPI) was co-incubated with secondary conjugated antibodies to counterstain cell nuclei. Plates were washed in PBS/0.02% TrX, rinsed in PBS and subse-quently dehydrated: 1 minute in 70% EtOH, two times 1 minute in 100% EtOH and air-dried. Cells were mounted in Vectashield (Vector Laboratories, Inc. Bur-lingame, CA, USA), analyzed using a Nikon TE200 Eclipse fluorescence microscope and photographed using a Nikon DXM1200 digital camera in combination with NIS-Elements 3.0 imaging software. All antibodies were diluted in blocking buffer (1% BSA, 5% FCS, 5% normal goat serum (NGS), in PBS/0.02% TrX). Second-ary antisera used were goat-anti-mouse Texas Red™ (TXRD; 1:100; Southern Biotech, Birmingham, LA, USA) and goat anti-rabbit fluorescein isothiocyanate (FITC; 1:100; Southern Biotech), to detect monoclonal and polyclonal primary antibodies respectively.
Protein isolation, differential extraction, immunoprecipitation (IP), immunoblotting (IB)
Protein extraction and immunoblotting (IB) were performed and analyzed as described previously with minor adjustments [2,5]. For extraction, cells were washed twice with cold PBS and lysed in RIPA buf-fer (50 mM Tris at pH 8.0, 150 mM NaCl, 0.1% SDS, 5 mM EDTA, 0.5% w/v sodium deoxycholate, and 1% NP-40) supplemented with protease and phosphatase inhibitors (5 mM benzamidine, 5 μg/ml antipain, 5μg/ml leupeptin, 5μg/μL aprotinin, 1 mM so-dium orthovanadate, 10 mM soso-dium fluoride, 10 mM pyrophosphate, 10 mM ß-glycerophosphate, 0.5 mM DTT, and 1 mM PMSF). Lysates were subjected to two freeze-thaw cycles in liquid nitrogen, followed by sonic-ation on ice with a probe sonicator (Soniprep 150; MSE, London, UK) for 12 cycli (1 sec ON, 1 sec OFF) with amp-litude 5. After 10 minutes centrifugation at 13200 rpm (4°C; Eppendorf centrifuge), the supernatant was trans-ferred to a fresh tube and protein concentration was determined using a BCA protein assay kit (Pierce/Thermo Fisher Scientific, Rockford, IL, USA) according to the manufacturer’s protocols on a Benchmark 550 microplate reader (Bio-Rad).
For differential extraction, cells were washed two times with cold PBS and scraped in lysis buffer (Tris HCl at pH 7.5, 150 mM NaCl, 0.5% Triton X-100, 1 mM EDTA; supplemented with inhibitors). After 30 minutes incubation on ice, nuclei are collected in the pellet by centrifugation (8000 rpm; 4°C) the supernatant is the cytoplasmic fraction. Nuclei are washed in lysis buffer and suspended in ELB buffer and incubated on ice for 10 minutes. Nuclear soluble (supernatant) and chromatin-bound fractions (pellet) are separated by centrifugation (13200 rpm; 4°C). After an additional wash in ELB buffer, the pellets were suspended in ELB buffer and sonicated.
For IP, cells were either cross-linked followed by cell lysis, or cells were lysed directly in ELB buffer (50 mM HEPES at pH 7.0, 250 mM NaCl, 5 mM EDTA, and 0.1% NP-40) supplemented with 5 mM benzamidine, 5 μg/ml antipain, 5 μg/ml leupeptin, 5 μg/ml aprotinin, 1 mM sodium vanadate, 10 mM sodium fluoride, 10 mM pyrophosphate, 10 mM ß-glycerophosphate, 0.5 mM DTT, and 1 mM PMSF. For cross-linking, cells were incubated in 1% formaldehyde (in PBS) for 10 min-utes at RT, fixation was stopped by addition of 2 M gly-cin to a final concentration of 0.125 M. After 5 minutes incubation, cells were washed twice in cold PBS and lysed in ELB buffer. IP was carried out as described [11,15]. Briefly, extracts were sonicated on ice, centri-fuged for 10 minutes at 4°C at 13200 rpm and superna-tants were transferred to a precooled tube; 10% of the supernatant was taken as input and stored at−80°C. Ap-propriate amount of antiserum (Additional file 6: Table S1) was added and tubes were rotated for 1 hour at 4°C on a spinning wheel. To precipitate immune complexes, washed protein G beads (Protein G Sepharose/4 Fast Flow; GE Healthcare) were added to the extracts and rotated for 3 to 4 hours at 4°C, followed by 3 minutes centrifugation at 3000 rpm at 4°C. Supernatant was col-lected as depleted fraction and stored at −80°C. Beads were washed four times in ELB buffer (with supple-ments) and stored dry at−80°C until IB analysis.
peroxidase-conjugated secondary antibodies for 1 hour at RT: goat anti-rat (7077; 1:2,000; Cell Signaling, Danvers, MA, USA), rat anti-mouse (P0260; 1:5,000; DAKO, Glostrup, Denmark) and donkey anti-rabbit (711035-152; 1:15,000; Jackson Lab, Bar Harbor, ME, USA), to detect monoclonal rat, monoclonal mouse and rabbit polyclonal primary antibodies respectively. Sig-nals were detected on autoradiograms using enhanced chemoluminescence (ECL; Pierce). Inten-sity of the bands was quantified with Quantity One software (Bio-Rad).
Drosophila lines
Drosophila melanogaster stocks and crosses were kept on standard media at 25°C. For crosses, five females were mated with five males; they were transferred each 48 hours in new tubes. The w1118line was used as con-trol line. The UAS::rolled line was a gift from Dr. K. Moses (University of Cambridge, Cambridge, UK); the
UAS::D-p38b was a gift from Dr. JM Gibert (University of Geneva, Geneva, Switzerland);UAS::rolled and UAS:: D-p38ballowdERKandD-p38boverexpression, respect-ively [38,56]. The v3171 line (w1118; MAPk-Ak2GD1597) that downregulates dMK2 by RNA interference, was purchased from the Vienna Drosophila RNAi Center (VDRC) [57]; it does not present any known off-target effects. Downregulation of dMK2 in third instar larvae was verified by real-time (RT) PCR using primers located outside the v3171 repeats (Additional file 5: Figure S5B) as described [41]. Results were normalized against rp49 or Spt6 (Additional file 7: Table S2). Trans-gene overexpression was achieved using the wing-specific Gal4 transgenic driver scalloped sd29.1 (called
sd::Gal4; BL-8609 line; Bloomington Drosophila Stock Center (BDSC), Bloomington, IN, USA)). All the trans-genic lines display Gal4-independentmini-white expres-sion that allows tracing of transgene transmisexpres-sion.
dMK2-LOF and hMK3-GOF transgenic flies were also crossed to mutant Polycomb lines to study a potential interaction of MK and PcGin vivo. NeitherhMK3-GOF nordMK2-LOF induce a discernablesexcomb-phenotype by themselves or in combination with established Pc1
and ScmD1 alleles in heterozygote crosses (data not shown). The most likely explanation for this lack of phenotype is that dMK2 may not play a role in anteroposterior (AP) patterning. In support of the latter, AP-axis abnormalities have not been reported in single or double MK2/3 knockout mice [34].
Additional files
Additional file 1: Figure S1.PRC1 target gene expression is controlled by ERK and P38.(A). MAPK and SAPK phosphorylation in response to mitogenic stimulation (stim) in U2-OS cells; specificity of response was
supported by distinctive phosphorylation profiles induced by two different stressors (ETP: etoposide, Se: selenite).(B)H3S28ph and PRC1 protein (BMI1) staining in G1-arrested (starved) or mitogen-stimulated U2-OS cells.(C)Quantification of chromatin-bound BMI1 levels (compare Figure 1D) in mitogen-stimulated cells pretreated with kinase inhibitors (indicated); BMI1 levels were normalized versus histone H3.(D) Interaction of pERK and BMI1; U2-OS/BMI2Py cells were stimulated with mitogen (stim) prior to IP; t+: longer exposure (IB: immunoblot; IP: immunoprecipitation). Parallel experiments with pP38 were inconclusive due to IB detection issues with applied antisera.
Additional file 2: Figure S2.PRC1/chromatin dissociation, not loss of H3K27me3, correlates with transcription.(A)mRNA expression of PRC1 target and non-target genes in TIG3 cells upon 0, 45 and 90 min of mitogen-stimulation.(B)Mitogenic stimulation induces BMI phosphorylation (upper panel; pBMI1) in TIG3 cells; cellular BMI1 and CBX8 protein (lower panel) levels remain unchanged under these conditions in support of changed PRC1/chromatin association rather than loss of protein (for example, degradation).
Additional file 3: Figure S3.MK3 is a negative regulator of ERK.(A) mRNA expression of PRC1 target geneATF3as a function of kinase inhibition in TIG3 cells (data as in Figure 3A) and U2-OS cells.(B) Quantification of pERK profiles (compare Figure 3B) in control versus
MK3OEcells (left panel) and in control versus MKi cells (right panel); pERK levels were normalized to beta Actin (b-Actin).(C-F)IB-analysis of (p)ERK (C), (p)P38 (D), (p)JNK (E) in resting or mitogen-stimulated (stim) control and MK-knockdown (shMK) cells and (F) in the context ofMK3OE; t (min): time post-stimulation in minutes. Samples corresponding to control (con) and experiment (MK3OEorshMK) were always loaded on the same gel to enable direct quantitative comparison; *: loading controls for all corresponding panels; t+: longer exposure.
Additional file 4: Figure S4.DUSP involvement in regulation of MK3/ ERK.(A)IB analysis of ERG1 in resting or mitogen-stimulated (stim) control (con) and MK-inhibited (MKi) cells; t (min): time post-stimulation in minutes. Samples corresponding to control and experiment (shMK) were always loaded on the same gel to enable direct quantitative comparison.(B)Cells were pretreated with DUSP inhibitor (DUSPi; concentration indicated) prior to mitogenic stimulation. IB detection of proteins as indicated.(C)Cells were pretreated with 50μM DUSPi prior to mitogen stimulation. Samples corresponding to control and experiment (MK3OE) were always loaded on the same gel (bottom panel) to enable direct quantitative comparison. Quantitative analysis of effects of DUSPi in control cells (con; left panel) andMK3OEcells (right panel); normalization pERK levels was done versus beta Actin (b-Actin).
Additional file 5: Figure S5.PRC1/MK/ERK module represents a molecular switch mechanism.(A)Functional interaction between dMK2 and Polyhomeoticin vitro: stress signaling-induced interaction of EGFP-tagged dMK2 (Drosophilaortholog of MK2/3) and Myc-tagged Ph (Drosophilaortholog of PHC1/2) in S2 cells. The Myc-Ph sequences comprised the C-terminal SAM domain [54]. Conditions tested: starved, mitogen-stimulated (FCS/TPA) and stressed (arsenite). IgG represents IgG-heavy and -light chains.(B)Reduced dMK2 expression in third instar
v3171larvae; normalization indicated.
Additional file 6: Table S1.Antibodies used for ChIP, ICC, IB and IP.
Additional file 7: Table S2.Primer sequences and targeting sequences.
Competing interests
The authors declare that they have no competing interests.
Authors’contributions
PP, EM-V, YT, URR, FP, JWV conceived of the study design; PP, HN, EM-V, GvdA, FS, VD, CG, MA, FP, JWV performed the experiments and analysis; PP, FP, and JWV drafted the manuscript. All authors read and approved the final manuscript.
Acknowledgements
materials, technical support and scientific discussions. Financial support: Dutch Science Organization (ZonMW-NWO): Research Support grant 908-02-040 (JWV); VIDI grant 016.046.362 (JWV), joint van Gogh grant (JWV, FP); tUL Grant (JWV); VSB Fonds scholarship (PP); Netherlands Genome Initiative (NGI) fellowship 050-72-422 (HN); UPMC and CNRS (FP).
Author details 1
Department of Molecular Genetics, GROW School for Oncology and Developmental Biology, Maastricht University, Universiteitssingel 50, 6229ER, Maastricht, The Netherlands.2BiGCaT Bioinformatics, Maastricht University, Universiteitssingel 50, 6229ER, Maastricht, The Netherlands.3Laboratoire de
Biologie du Développement UMR 7622, Centre National de la Recherche Scientifique, Université Pierre et Marie Curie-Paris 6, 9 Quai Saint-Bernard, 75005, Paris, France.4Department of Stem Cell Biology, Research Institute for Radiation Biology and Medicine, Hiroshima University, 1-2-3, Kasumi, Minami-ku, Hiroshima, Japan.5Department of Molecular Biology, Max Planck Institute of Biochemistry, Am Klopferspitz 18, D-82152, Martinsried, Germany.
Received: 4 April 2012 Accepted: 11 July 2012 Published: 7 August 2012
References
1. Keshet Y, Seger R:The MAP kinase signaling cascades: a system of hundreds of components regulates a diverse array of physiological functions.Methods Mol Biol2010,661:3–38.
2. Ludwig S, Engel K, Hoffmeyer A, Sithanandam G, Neufeld B, Palm D, Gaestel M, Rapp UR:3pK, a novel mitogen-activated protein (MAP) kinase-activated protein kinase, is targeted by three MAP kinase pathways. Mol Cell Biol1996,16:6687–6697.
3. Gaestel M:Specificity of signaling from MAPKs to MAPKAPKs: kinases’ tango nuevo.Front Biosci2008,13:6050–6059.
4. Shiryaev A, Moens U:Mitogen-activated protein kinase p38 and MK2, MK3 and MK5: menage a trois or menage a quatre?Cell Signal2010,
22:1185–1192.
5. Voncken JW, Niessen H, Neufeld B, Rennefahrt U, Dahlmans V, Kubben N, Holzer B, Ludwig S, Rapp UR:MAPKAP kinase 3pK phosphorylates and regulates chromatin-association of the Polycomb-group protein Bmi1. J Biol Chem2005,280:5178–5187.
6. Prezioso C, Orlando V:Polycomb proteins in mammalian cell differentiation and plasticity.FEBS Lett2011,585:2067–2077. 7. Simon JA, Kingston RE:Mechanisms of Polycomb gene silencing:
knowns and unknowns.Nat Rev Mol Cell Biol2009,10:697–708. 8. Azuara V, Perry P, Sauer S, Spivakov M, Jorgensen HF, John RM, Gouti M,
Casanova M, Warnes G, Merkenschlager M, Fisher AG:Chromatin signatures of pluripotent cell lines.Nat Cell Biol2006,8:532–538. 9. Bernstein BE, Mikkelsen TS, Xie X, Kamal M, Huebert DJ, Cuff J, Fry B,
Meissner A, Wernig M, Plath K, Jaenisch R, Wagschal A, Feil R, Schreiber SL, Lander ES:A bivalent chromatin structure marks key developmental genes in embryonic stem cells.Cell2006,125:315–326.
10. Mikkelsen TS, Ku M, Jaffe DB, Issac B, Lieberman E, Giannoukos G, Alvarez P, Brockman W, Kim TK, Koche RP, Lee W, Mendenhall E, O’Donovan A, Presser A, Russ C, Xie X, Meissner A, Wernig M, Jaenisch R, Nusbaum C, Lander ES, Bernstein BE:Genome-wide maps of chromatin state in pluripotent and lineage-committed cells.Nature2007,448:553–560.
11. Voncken JW, Schweizer D, Aagaard L, Sattler L, Jantsch MF, van Lohuizen M:
Chromatin-association of the Polycomb group protein BMI1 is cell cycle-regulated and correlates with its phosphorylation status.J Cell Sci
1999,112:4627–4639.
12. Bracken AP, Dietrich N, Pasini D, Hansen KH, Helin K:Genome-wide mapping of Polycomb target genes unravels their roles in cell fate transitions.Genes Dev2006,20:1123–1136.
13. Tarn C, Bilodeau ML, Hullinger RL, Andrisani OM:Differential immediate early gene expression in conditional hepatitis B virus pX-transformingversus nontransforming hepatocyte cell lines.J Biol Chem1999,274:2327–2336. 14. Ronkina N, Menon MB, Schwermann J, Arthur JS, Legault H, Telliez JB,
Kayyali US, Nebreda AR, Kotlyarov A, Gaestel M:Stress induced gene expression: a direct role for MAPKAP kinases in transcriptional activation of immediate early genes.Nucleic Acids Res2010,39:2503–2518. 15. Alkema MJ, Bronk M, Verhoeven E, Otte A, van’t Veer LJ, Berns A, van
Lohuizen M:Identification of Bmi1-interacting proteins as constituents of
a multimeric mammalian polycomb complex.Genes Dev1997,11:226– 240.
16. Saurin AJ, Shiels C, Williamson J, Satijn DP, Otte AP, Sheer D, Freemont PS:
The human polycomb group complex associates with pericentromeric heterochromatin to form a novel nuclear domain.J Cell Biol1998,
142:887–898.
17. Perez-Cadahia B, Drobic B, Davie JR:H3 phosphorylation: dual role in mitosis and interphase.Biochem Cell Biol2009,87:695–709.
18. Sassone-Corsi P, Mizzen CA, Cheung P, Crosio C, Monaco L, Jacquot S, Hanauer A, Allis CD:Requirement of Rsk-2 for epidermal growth factor-activated phosphorylation of histone H3.Science1999,285:886–891.
19. Drobic B, Perez-Cadahia B, Yu J, Kung SK, Davie JR:Promoter chromatin remodeling of immediate-early genes is mediated through H3 phosphorylation at either serine 28 or 10 by the MSK1 multi-protein complex.Nucleic Acids Res2010,38:3196–3208.
20. Cao R, Tsukada YI, Zhang Y:Role of Bmi-1 and Ring1A in H2A ubiquitylation and Hox gene silencing.Mol Cell2005,
20:845–854.
21. Hodgson JW, Argiropoulos B, Brock HW:Site-specific recognition of a 70-base-pair element containing d(GA)(n) repeats mediates bithoraxoid polycomb group response element-dependent silencing.Mol Cell Biol
2001,21:4528–4543.
22. Boyer LA, Plath K, Zeitlinger J, Brambrink T, Medeiros LA, Lee TI, Levine SS, Wernig M, Tajonar A, Ray MK, Bell GW, Otte AP, Vidal M, Gifford DK, Young RA, Jaenisch R:Polycomb complexes repress developmental regulators in murine embryonic stem cells.Nature2006,441:349–353.
23. Lee TI, Jenner RG, Boyer LA, Guenther MG, Levine SS, Kumar RM, Chevalier B, Johnstone SE, Cole MF, Isono K, Koseki H, Fuchikami T, Abe K, Murray HL, Zucker JP, Yuan B, Bell GW, Herbolsheimer E, Hannett NM, Sun K, Odom DT, Otte AP, Volkert TL, Bartel DP, Melton DA, Gifford DK, Jaenisch R, Young RA:
Control of developmental regulators by polycomb in human embryonic stem cells.Cell2006,125:301–313.
24. Lau PN, Cheung P:Histone code pathway involving H3 S28 phosphorylation and K27 acetylation activates transcription and antagonizes polycomb silencing.Proc Natl Acad Sci USA2011,108:2801–2806.
25. Gehani SS, Agrawal-Singh S, Dietrich N, Christophersen NS, Helin K, Hansen K:Polycomb group protein displacement and gene activation through MSK-dependent H3K27me3S28 phosphorylation.Mol Cell2010,39:886– 900.
26. Young MD, Willson TA, Wakefield MJ, Trounson E, Hilton DJ, Blewitt ME, Oshlack A, Majewski IJ:ChIP-seq analysis reveals distinct H3K27me3 profiles that correlate with transcriptional activity.Nucleic Acids Res2011,
39:7415–7427.
27. Hirota T, Lipp JJ, Toh BH, Peters JM:Histone H3 serine 10 phosphorylation by Aurora B causes HP1 dissociation from heterochromatin.Nature2005,
438:1176–1180.
28. Fischle W, Tseng BS, Dormann HL, Ueberheide BM, Garcia BA, Shabanowitz J, Shabanowitz J, Hunt DF, Funabiki H, Allis CD:Regulation of HP1-chromatin binding by histone H3 methylation and phosphorylation.Nature2005,
438:1116–1122.
29. Dormann HL, Tseng BS, Allis CD, Funabiki H, Fischle W:Dynamic regulation of effector protein binding to histone modifications: the biology of HP1 switching.Cell Cycle2006,5:2842–2851.
30. Hansen KH, Bracken AP, Pasini D, Dietrich N, Gehani SS, Monrad A, Rappsilber J, Lerdrup M, Helin K:A model for transmission of the H3K27me3 epigenetic mark.Nat Cell Biol2008,10:1291–1300. Epub ahead of print.
31. Stojic L, Jasencakova Z, Prezioso C, Stutzer A, Bodega B, Pasini D, Klingberg R, Mozzetta C, Margueron R, Puri PL, Schwarzer D, Helin K, Fischle W, Orlando V:
Chromatin regulated interchange between polycomb repressive complex 2 (PRC2)-Ezh2 and PRC2-Ezh1 complexes controls myogenin activation in skeletal muscle cells.Epigenetics Chromatin2011,4:16.
32. Vermeulen M, Eberl HC, Matarese F, Marks H, Denissov S, Butter F, Lee KK, Olsen JV, Hyman AA, Stunnenberg HG, Mann M:Quantitative interaction proteomics and genome-wide profiling of epigenetic histone marks and their readers.Cell2010,142:967–980.
34. Ronkina N, Kotlyarov A, Gaestel M:MK2 and MK3 - a pair of isoenzymes? Front Biosci2008,13:5511–5521.
35. Eblen ST, Slack-Davis JK, Tarcsafalvi A, Parsons JT, Weber MJ, Catling AD:
Mitogen-activated protein kinase feedback phosphorylation regulates MEK1 complex formation and activation during cellular adhesion.Mol Cell Biol2004,24:2308–2317.
36. Patterson KI, Brummer T, O’Brien PM, Daly RJ:Dual-specificity
phosphatases: critical regulators with diverse cellular targets.Biochem J
2009,418:475–489.
37. Wenzel K, Daskalow K, Herse F, Seitz S, Zacharias U, Schenk JA, Schulz H, Hubner N, Micheel B, Schlag PM, Osterziel KJ, Ozcelik C, Scherneck S, Jandrig B:Expression of the protein phosphatase 1 inhibitor KEPI is downregulated in breast cancer cell lines and tissues and involved in the regulation of the tumor suppressor EGR1 via the MEK-ERK pathway. Biol Chem2007,388:489–495.
38. Adachi-Yamada T, Nakamura M, Irie K, Tomoyasu Y, Sano Y, Mori E, Goto S, Ueno N, Nishida Y, Matsumoto K:p38 mitogen-activated protein kinase can be involved in transforming growth factor beta superfamily signal transduction in Drosophila wing morphogenesis.Mol Cell Biol1999,
19:2322–2329.
39. De Celis JF:Pattern formation in the Drosophila wing: the development of the veins.BioEssays2003,25:443–451.
40. Martin-Blanco E:p38 MAPK signalling cascades: ancient roles and new functions.BioEssays2000,22:637–645.
41. Mouchel-Vielh E, Rougeot J, Decoville M, Peronnet F:The MAP kinase ERK and its scaffold protein MP1 interact with the chromatin regulator Corto during Drosophila wing tissue development.BMC Dev Biol2011,11:17. 42. Niessen HE, Demmers JA, Voncken JW:Talking to chromatin:
post-translational modulation of polycomb group function.Epigenetics Chromatin2009,2:10.
43. Rao PS, Satelli A, Zhang S, Srivastava SK, Srivenugopal KS, Rao US:RNF2 is the target for phosphorylation by the p38 MAPK and ERK signaling pathways.Proteomics2009,9:2776–2787.
44. Srivastav RK, Schwede S, Klaus M, Schwermann J, Gaestel M, Niedenthal R:
Monitoring protein-protein interactions in mammalian cells by trans-SUMOylation.Biochem J2011,438:495–503.
45. Chen S, Bohrer LR, Rai AN, Pan Y, Gan L, Zhou X, Bagchi A, Simon JA, Huang H:Cyclin-dependent kinases regulate epigenetic gene silencing through phosphorylation of EZH2.Nat Cell Biol2010,12:1108–1114.
46. Fujisaki S, Ninomiya Y, Ishihara H, Miyazaki M, Kanno R, Asahara T, Kanno M:
Dimerization of the Polycomb-group protein Mel-18 is regulated by PKC phosphorylation.Biochem Biophys Res Commun2003,300:135–140. 47. Kaneko S, Li G, Son J, Xu CF, Margueron R, Neubert TA, Reinberg D:
Phosphorylation of the PRC2 component Ezh2 is cell cycle-regulated and up-regulates its binding to ncRNA.Genes Dev2010,23:2615–2620. 48. Roscic A, Moller A, Calzado MA, Renner F, Wimmer VC, Gresko E, Ludi KS,
Schmitz ML:Phosphorylation-dependent control of Pc2 SUMO E3 ligase activity by its substrate protein HIPK2.Mol Cell2006,24:77–89. 49. Wei Y, Chen Y-H, Li L-Y, Lang J, Yeh S-P, Shi B, Yang CC, Yang JY, Lin CY, Lai
CC, Hung MC:CDK1-dependent phosphorylation of EZH2 suppresses methylation of H3K27 and promotes osteogenic differentiation of human mesenchymal stem cells.Nat Cell Biol2011,13:87–94. 50. Serrano M, Lin AW, McCurrach ME, Beach D, Lowe SW:Oncogenic ras
provokes premature cell senescence associated with accumulation of p53 and p16INK4a.Cell1997,88:593–602.
51. Kinsella TM, Nolan GP:Episomal vectors rapidly and stably produce high-titer recombinant retrovirus.HumGene Ther1996,7:1405–1413. 52. Morgenstern JP, Land H:Advanced mammalian gene transfer: high titre
retroviral vectors with multiple drug selection markers and a complementary helper-free packaging cell line.Nucleic Acids Res1990,
18:3587–3596.
53. Brummelkamp TR, Bernards R, Agami R:A system for stable expression of short interfering RNAs in mammalian cells.Science2002,296:550–553. 54. Peterson AJ, Kyba M, Bornemann D, Morgan K, Brock HW, Simon J:A
domain shared by the Polycomb group proteins Scm and ph mediates heterotypic and homotypic interactions.Mol Cell Biol1997,17:6683–6692. 55. Hamer KM, Sewalt RG, den Blaauwen JL, Hendrix T, Satijn DP, Otte AP:A
panel of monoclonal antibodies against human polycomb group proteins.Hybrid Hybridomics2002,21:245–252.
56. Kumar JP, Moses K:EGF receptor and Notch signaling act upstream of Eyeless/Pax6 to control eye specification.Cell2001,104:687–697.
57. Dietzl G, Chen D, Schnorrer F, Su KC, Barinova Y, Fellner M, Gasser B, Kinsey K, Oppel S, Scheiblauer S, Couto A, Marra V, Keleman K, Dickson BJ:A genome-wide transgenic RNAi library for conditional gene inactivation in Drosophila.Nature2007,448:151–156.
doi:10.1186/1756-8935-5-12
Cite this article as:Prickaertset al.:MK3 controls Polycomb target gene
expression via negative feedback on ERK.Epigenetics & Chromatin2012
5:12.
Submit your next manuscript to BioMed Central and take full advantage of:
• Convenient online submission
• Thorough peer review
• No space constraints or color figure charges
• Immediate publication on acceptance
• Inclusion in PubMed, CAS, Scopus and Google Scholar
• Research which is freely available for redistribution