Geophysical Evaluation of Magnetic Data of Okenugbo Area,
Ago - Iwoye, Southwestern, Nigeria
1
Oladunjoye
H.T.
2
Olasunkanmi, N. K.
3
Olaleye, A.O
1Department of Physics,Olabisi Onabanjo University, Ago-Iwoye 2Deapartment of Chemical, Geological and Physical Sciences, Kwara State University, Malete. Nigeria 3Department of Earth Sciences, Ladoke Akintola University of Technology, Ogbomoso. Nigeria
Doi:10.5901/ajis.2014.v3n5p105
Abstract
The results of a magnetic study of the Okenugbo Area of Ago-Iwoye, Southwestern Nigeria are presented for the evaluation of the geostructural settings in the area to determine the competency of the basement for building constructions. The study area lies within Longitude N06°55.389ެ-N06°55.384ެ and Latitude E003°55.001ެ and E003°54.959ެ in the basement complex of Nigeria. Three magnetic profiles were established for the evaluation and the magnetic anomaly map, the regional geology and its analytic signal amplitude helped in identifying the nature and depth of the magnetic sources in the study region. The magnetic residual values range from -2400 nT to +1800 nT. The area shows magnetic closures of various sizes at the Western part of the study area trending West with prominence at the center and distributed East-West which has been interpreted as fractured or faulted zones. The depth estimate revealed the apparent depth to the causative body from the surface and the basement depth range from 4.3 to 21.3 m which agrees with other literatures. The study has revealed that the area is generally competent for high rise structures and industrial site while the faulted/fractured zones are prospective better locations for hydrogeological purposes.
Keywords: Geostructure, competency, anomaly, fracture, intrusion
1. Introduction
The alarming rate of structural failure such as roads, buildings, dam and bridges in Nigeria has become more intense. The need for pre-foundation studies can therefore not be overemphasized as it may constitute a significant potential hazard to the downstream people such as loss of valuable lives and properties that always accompany such failure Akanmu et al. 2007. The basement mapping and geophysical foundation study usually provides subsurface information that assists the construction engineers in location of the right site and design of foundation for different structures.
and inclination of the earth's magnetic field in the survey area.
The Analytic Signal Amplitude has been employed for analysis of the groundmagnetic data obtained in this study, to delineate subsurface linear geologic structures which could possibly reveal the distribution of fractures within the area. If the concealed bedrock that is suppose to serve as the foundation rock is faulted/fractured, it may lead to collapse of structures sited there. The Analytic signal method is very useful for delineating magnetic source location (Nabigbian, 1972, 1974.; Roest et al, 1992); the amplitude of the simple analytic signal peaks over magnetic contacts and could be used to determine the depth to the magnetic sources.
2. Location and Geology of the Study Area
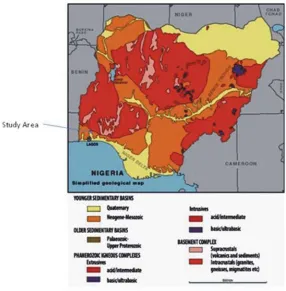
The study area is essentially a part of the basement complex regarded as Precambrian basement complex in the three major litho-petrologic components that make up the geology of Nigeria. The rocks present are mainly Granodiorite- porphyroblastic, Granite, Gneisses and Migmatite Gneisses, BiotiteGneisses and Biotite, Hornblende Gneiss (Rahaman, 1988). The Gneisses constitute the major rocks intended by the other groups of rocks while the minor rock types include pegmatite and quartz veins in the area. The study area lies between Longitude N06°55.389ެ-N06°55.384ެ and Latitude E003°55.001ެ and E003°54.959ެ respectively located in Okenugbo, by Fowoseje Comprehensive High School in Ago-Iwoye area of Ijebu, Ogun State.
Figure 1. Regional Map of Nigeria showing the study area (Modified after Ajibade et.al. 1972)
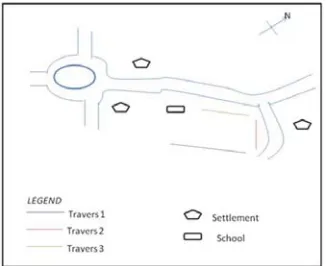
Figure 3: Accessibility Map of the Study Area showing the Magnetic Traverses
3. Materials and Method
The instrument used for the groundmagnetic survey is the Geometries Proton Precession Magnetometer, model G- 856 which produces an absolute and relatively high resolution of the field and displays measurement in digital lighted readout. Three traverses were established along the East-North, North – East and West- East directions with length variation within 500 m and 1000 m with 20 m inter-traverses spacing, in the study area. The instrument measure small, localized variations in the Earth’s magnetic field (Nicolas, 2007) presented as the Total Magnetic Intensity TMI of the area. To make accurate magnetic anomaly maps, temporal changes (diurnal variation) in the earth’s field during the period of the survey were monitored by selecting a base station, where the magnetic intensities are being measured at a stationary point. The regional magnetic field was removed from the TMI using SignProc computer software and recorded as the residual anomaly for each traverse. The Analytic Signal was further used to enhance the residual anomaly. The analytic signal or total gradient is formed through the combination of first order horizontal and vertical gradients of the magnetic anomaly. The analytic signal is independent of magnetization direction and the direction of the Earth’s magnetic field. (Milligan and Gunn, 1997). The function used in this method is the analytic signal amplitude (ASA) defined by:
ܣሺݔǡ ݕሻ ൌ ට൬ቀௗ்ௗ௫ቁଶቀௗ்ௗ௬ቁଶ ቀௗ்ௗ௭ቁଶ൰1 Where ௗ்
The analytic signal shapes were used to determine the depth to the magnetic source using the anomaly width at half the amplitude (Atchuta Rao, et. al., 1981 and Roest, et. al., 1992).
The eventual magnetic data were presented as magnetic profiles by plotting the magnetic values against station separations for each traverse. Magnetic contour map (2D plot) and surface map (3D plot) of Analytic Signal Amplitude were also constructed for more qualitative interpretation using Surfer 8 software.
4. Results and Discussion
The results obtained from the ground magnetic survey of the study area were presented in a qualitative and quantitative interpretation which involves the analysis of the basement topography with the magnetic contour and surface maps, magnetic profiles, and estimation of the depth to the top of the magnetic basement respectively.
4.1 Traverse 1
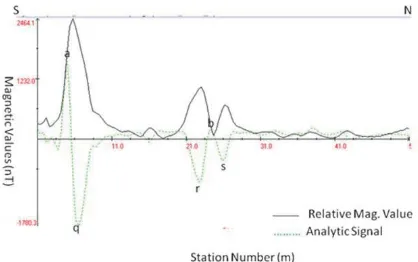
The traverse covers a total length of 1000 m (figure 3b) and trends in South to North direction. The profile generally shows high magnetic values which correspond to the location of undifferentiated basement rock that may include the gneisses which constitute the major rocks or pegmatite and quartz veins as the minor rocks in the area (Rahaman, 1989). The region of magnetic high can host high rise buildings as the basement rocks could serve as a strong foundation for them coupled with the observable lateritic caps in the area.
The traverse also shows relatively low magnetic values at station positions 5.5 (110 m), 22.5 (450 m) and 25.5 (510 m) represented as q, r & s respectively, which are interpreted as faults or fractures.
Figure 4a: Magnetic Anomaly along traverse 1
4.2 Traverse 2
Figure 4b: Magnetic Anomaly along traverse 2
4.3 Travers 3
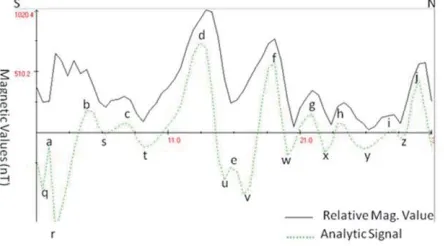
The traverse covers a total length of 620 m (figure 4c) and trends in South to North direction. The area has the magnetic lows and magnetic highs relatively distributed. The areas of magnetic lows (p, q, r, s, t, u, v, w, x, y & z) are locations observed to be zones of non-magnetic minerals like faults, crack or contact between two rocks but relatively prominent at point ‘y’ which shows wide fracture trend.
Figure 4c: Magnetic Anomaly along traverse 3
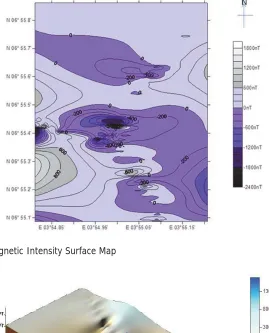
4.4 Magnetic Contour Map
The Residual magnetic contour map obtained from the analytic signal amplitude enhanced data generated from the magnetic values for the study area is as shown in figure 4. The map shows the areas of magnetic lows and magnetic highs analysed with colour variations: -240 nT to 600 nT (Deep to Sky Blue) and between 600 nT to 1800 nT (Dark to light Ash) respectively. The low magnetic distribution is observable at the Western part (deeper fracture or faulted zone) of the study area trending West with prominence at the center (deepest fracture or fault zone) and distributed East-West. These locations are not competent for high rise structures to avoid subsidence of the structures in future which may lead to loss of valuable lives and properties but are better sites for hydrogeological purposes. The magnetic highs zone are locations with magnetic rock intrusions competent for high rise structures and heavy machines.
Figure 4: The contoured map (2D plot).
Figure 8. 3D Magnetic Intensity Surface Map
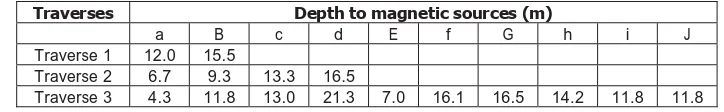
4.5 Depth Analysis
Table 1. Depth estimates of groundmagnetic traverses relative to the ground surface using Half-Width of the amplitude method.
Traverses Depth to magnetic sources (m)
a B c d E f G h i J
Traverse 1 12.0 15.5
Traverse 2 6.7 9.3 13.3 16.5
Traverse 3 4.3 11.8 13.0 21.3 7.0 16.1 16.5 14.2 11.8 11.8
5. Conclusion
The results of the geophysical evaluation of magnetic survey of Okenugbo area to determine the competency of the basement for building constructions were discussed in terms of quantitative and qualitative interpretations. The quantitative interpretation involves the estimation of the overburden thickness to the top of the magnetic basement, and is as shown on Table 1. It indicated varied basement topography with depth ranging from 4.3 to 21.3 m.
The qualitative interpretation revealed that the area is generally competent for high rise structures and industrial site while some locations are better sites for hydrogeological purposes which could be ascertained with other geosphysical methods.
References
Akanmu J.O., Eluwa O. and Ekpo I., (2007). Chronicles of river basin management in Nigeria. A journal presented at the international congress on river basin management. Correspondence email: (joakanmu@yahoo.com).
Ariyo, S. O., Adeyemi, G .O., and Oyebamiji A. O., (2009). Electromagnetic VLF Survey for Groundwater Development in a Contact Terrain; a Case Study of Ishara-remo, Southwestern Nigeria. Journal of Applied Sciences Research, 5(9), 1239-1246.
Badmus, B. S. and Olatinsu, O. B., 2009. Geophysical evaluation and chemical analysis of kaolin clay deposit of Lakiri village, southwestern Nigeria Journal of Physical Sciences Vol. 4 (10) pp. 592-606 Kehinde-Philips, O.O. (1992). Geological Map of Ogun state. In: Onakomaiya, S.O., Oyesiku, O.O. and
Segede, F.J (eds.). Ogun state Map. Nigeria: Rex Charles Publication. Pp. 6 -20.
Milligan, P. R. and Gunn, P. J. (1997) Enhancement and Presentation of Airborne Geophysical Data. J. Aust.Geology and Geophysics, v. 17, pp. 63-75.
Nabighian, M. N. (1972) The Analytic signal of two-dimensional magnetic bodies with polygonal cross sections: its properties and use for automated anomaly interpretation. Geophysics, v. 37, pp. 507– 517.
Nabighian, M.N., 1974, Additional comments on the analytic signal of two-dimensional magnetic bodies with polygonal crosssection, Geophysics, 39, 85-92.
Nicolas O.M., 2008. ‘The magnetic method’ Presented at Short Course III on Exploration for Geothermal Resources, organized by UNU-GTP and KenGen, at Lake Naivasha, Kenya.
Rahaman, M.A., 1988. Recent advances in the study of the Basement Complex of Nigeria. In: Oluyide, P.O., Mbonu, W.C., Ogezi, A.E., Egbuniwe, I.G., Ajibade, A.C. and Umeji A.C. (eds.). Precambrian Geology of Nigeria, G.S.N,. pp. 11-41.
Rahman MA (1989). Review of the Basement Geology of Southwest, Nigeria. Geol. Nigeria pp. 943-959. Roest, W.R., J. Verhoef and M. Pilkington (1992): Magnetic interpretation using the 3D analytic signal,
Geophysics, 57, 116-125.