R E S E A R C H A R T I C L E
Open Access
How should we teach tree-thinking? An
experimental test of two hypotheses
Sarah L Eddy
*, Alison J Crowe, Mary Pat Wenderoth and Scott Freeman
Abstract
Background:Phylogenies are ubiquitous in college-level biology textbooks, yet many college students continue to struggle to interpret them correctly. Multiple activities and frameworks for teaching phylogenies have been proposed to address this problem. In an introductory biology course for majors, we tested two contrasting hypotheses about the best way for students to learn the basic principles of‘tree-thinking’.
Methods:We constructed two 30-minute, pencil-and-paper-based guided group activities: one focused on using a character matrix to build a tree and one focused on analyzing an existing tree. Groups of three students completed one of these activities during one class session of a large lecture course. All students completed an identical assessment the night of the activity.
Results:We confirmed that students in the two groups were of equal academic ability, and found that students in the ‘build your own tree’treatment performed significantly better on the assessment than students in the‘analyze an existing tree’treatment. We also had first-year graduate students in a Biology PhD program complete the assessment, without doing the activity beforehand. The scores of undergraduates who had done a modified version of the tree building activity were indistinguishable from those of the graduate students.
Conclusion:We recommend simple tree-building activities be a standard part of training for tree-thinking in introductory biology.
Keywords:Tree-thinking, Reading trees, Phylogeny, Active learning, Scientific teaching
Background
Student acceptance of evolution is influenced by their un-derstanding of the history of life (Nadelson and Southerland 2010). Comprehending long-term evolution-ary change, in turn, requires a grasp of speciation, the ori-gin of major innovations, and deep evolutionary time. Unfortunately, students often come to biology with naïve ideas about the evolution of species. For example, many students believe that new species appear when one species evolves into another, rather than when one lineage splits in two (Novick and Catley 2007). This misconception can lead to confusion and a de-valuing of the available evidence for evolution (Padian and Angielczyk 2007). One way to address these naïve student understandings is to teach treethinking at the introductory level. Phylogenetic trees -representations of evolutionary relationships among a set
of taxa - can be used in the classroom to illustrate the pat-terns and timescale of evolutionary change (Catley and Novick 2009; Mead 2009).
Because of their usefulness in depicting patterns of evolutionary relationships, phylogenies permeate the sci-entific literature and biology textbooks (Catley and Novick 2008). Unfortunately, many students find them difficult to interpret and have trouble determining which features of trees contain pertinent information and which do not (Sandvik 2008; Halverson 2011). Some of the most commonly reported misconceptions about trees include:
interpreting species relatedness using branch tip proximity (Baum et al.2005; Meir et al.2007); orienting time incorrectly relative to the tree (for
example, identifying some tips as ancestors) (Meir et al.2007; Omland et al.2008);
* Correspondence:sleddy@uw
Department of Biology, University of Washington, Box 355320, Seattle WA 98195, USA
counting intervening nodes to determine relatedness (Meir et al.2007);
identifying lineages that split off earlier in time or that have fewer extant taxa as more basal or primitive (Crisp and Cook2005; Omland et al. 2008); and
believing that no evolutionary change occurs on a straight line (Novick and Catley2007; Meir et al.2007).
In addition to identifying multiple student misconcep-tions about trees, these studies also documented that some college-level students do not know how to use trees to determine relationships. In cases like this, students will simply ignore the tree and instead rely on their prior knowledge of the characteristics of the organisms involved (Gregory 2008; Halverson et al. 2011). The overall conclu-sion from these studies is that students do not enter col-lege biology courses understanding how to read trees correctly. They need instruction and deliberate practice.
Many researchers have proposed strategies for teaching students how to read trees. Some of these approaches focus on how the trees themselves should be represented in the classroom and in textbooks. For example, student understanding is improved by drawing trees as brackets rather than diagonal lines (Novick and Catley 2007; Baum and Offner 2008) and including synapomorphies on the branches (Catley et al. 2010; Novick et al. 2010a).
Other educators have focused on designing activities to develop students’tree-thinking skills. These activities involve the students either building trees or analyzing existing trees. The majority of published activities fo-cusing on phylogenies require students to build trees based on a given dataset (Gendron 2000; Singer et al. 2001; Goldsmith 2003; Julius and Schoenfuss 2006; Lents et al. 2010). Although not explicitly stated, these interventions appear to be based on the hypothesis that students will understand phylogenies better if they learn by building them. In contrast to this hypothesis, Halverson (2011) argues that the skills necessary to build trees are different from the skills necessary to read trees, and that combining the two tasks adds an unnecessary layer of complexity to the already difficult problem of interpreting trees. Through interviews and analysis of stu-dent assignments, Halverson found that stustu-dents develop tree-reading skills prior to tree-building skills. This phil-osophy, of having students analyze existing trees prior to building them, is reflected in the design of Catley and Novick’s (2012) activity.
We proposed to test whether a student’s initial ability to read and interpret trees is best-developed in the context of tree reading or tree building. Should students be intro-duced to tree-thinking by analyzing an existing tree, as proposed by Halverson et al. (2011), or creating a tree based on evidence?
Establishing tree-thinking benchmarks
Two of the challenges in studies like this one are deter-mining how best to measure student achievement and how to determine when an intervention leads to ‘good enough’achievement. Pre-/post-tests can evaluate student learning gains, but these gains need to be compared to a relevant benchmark to evaluate an intervention’s educa-tional impact. Although learning gains observed in other studies offer one potential benchmark, cross-study com-parisons can be difficult. Many factors can create variation in the magnitude of gains documented in pre-/post-test-ing, including the topic being tested and the time interval between the pre- and post-test. In the literature on phy-logenies, several alternative benchmarks have been employed to put student gains into context. Novick et al. (2010b) compared gains in tree-thinking between (a) 2.5 hours of lecture instruction on reading phylogenies and (b) simply adding synapomorphies to tree diagrams. They found that adding synapomorphies to a tree led to the same gains in student learning as the lecturing. Although appropriate for their study design, (because they were test-ing a visualization vs. instruction), in general it is not useful to contrast learning gains from a lecture with re-sults from an activity. Education research has already established that exercises where students are actively en-gaged lead to greater average learning gains than listening to lecture (Dirks 2011; Ruiz-Primo et al. 2011). Thus, ex-periments based on teaching a topic through a particular activity versus a lecture confound the impact of active learning with the effect that researchers may be most in-terested in: whether a particular conceptual approach to teaching the topic (for example, building trees) helps stu-dents more than an alternative one (for example, analyzing trees). Therefore, a more informative comparison is to evaluate learning gains from contrasting activities. This method allows researchers to evaluate competing hypoth-eses about how students learn best for a specific topic, within the constructivist context of an active learning ex-ercise. Perry et al. (2008) employed this method to com-pare learning gains in tree-thinking between two activities: a computer simulation and a pencil-and-paper activity and found the two methods produced equivalent learning gains.
training. Three readily assessable options for bench-marks to compare introductory biology students’ under-standing to could be:
1. Advanced undergraduate understanding. Performance of students in upper-level biology classes could be used as a benchmark. The only tree-thinking study looking at upper level college students found that, as compared to introductory student, these upper division students showed only small improvements in their tree-thinking skills (Meir et al.2007).
2. Expert level understanding. A few studies in the three-thinking literature have compared student performance (after one term of phylogeny instruction) to the understanding displayed by researchers in the field (Halverson et al.2011; Novick and Catley2007). No students reached the expert level of understanding in either study, which may not be surprising given the disparity in training and experience. Expert-level understanding may simply be setting the bar too high.
3. First year graduate students’understanding. We propose that a more realistic comparison would be first-year graduate students. Although this comparison has not been previously made in the phylogeny literature, physics education researchers have frequently used the level of understanding exhibited by entering graduate students as a benchmark (for example, Shaffer and McDermott2005). This‘target’is ambitious compared to upper level undergraduates but is educationally relevant for instructors preparing students for graduate or professional school.
The purpose of this study is to assess whether tree-building or tree-analyzing leads to greater student progress on these learning objectives. To evaluate the level of student understanding recorded after our tree-thinking intervention, we compared student tree-thinking skills between the two treatments and to those of first-year graduate students.
Methods
Course description and activity design
Phylogenies are introduced in the first quarter of a three-quarter introductory sequence for biology majors at the University of Washington. The initial course, Bio180, covers evolution, Mendelian genetics, and ecol-ogy, along with a brief survey of the diversity of life. Each week students attend four 50-minute lectures and one 2-hour lab. The course is offered every quarter; 600-700 students enroll each term during the academic year.
This study spanned two quarters - Spring and Fall of 2011 - each of which had a different instructor. To con-trol for instructor differences, we made comparisons
within each quarter only. The majority of students in the course were sophomores, and approximately 15% of stu-dents each term were enrolled in the Education Oppor-tunity Program (EOP), meaning that they had been identified by the Admissions Office as economically or educationally disadvantaged.
Tree-thinking guided group activities
For students who are just being introduced to tree-thinking, our learning objectives are similar to those suggested by Baum et al. (2006) and address several common misconcep-tions about interpreting phylogenies. After our intervention, we wanted our students to be able to:
Use trees to determine ancestor-descendant
relationships and degrees of relatedness among taxa;
Map where particular traits evolved on the branches
of trees and diagnose homoplasy;
Use shared, derived characters to place taxa on a tree; Recognize that traits do not necessarily evolve in a
progressive manner;
Recognize that a species cannot be considered
higher or lower than others (tree-vs. progressivist/ ladder-of-life thinking);
Recognize that extant traits can be considered basal, but that extant species cannot.
In the classic backwards design tradition (McTighe & Wiggins 1999), these learning outcomes were used to design our post-intervention assessment and the two guided group activities that would be used in class.
The initial guided group activities were based on exam questions, clicker questions, and problems for informal group work that one of the authors (SF) had used in sev-eral previous iterations of the course. The scenarios and questions were modified based on input from students, teaching assistants, and the instructor, and then re-written for inclusion in the guided group activities. The activities were completed by small groups of students (2-3) who worked through a single 8½ × 11 sheet of questions, copied both sides. Each activity started with a set of unique questions that guided the students through their assigned task (either building or analyzing a tree). Students then used the tree the built or analyzed to complete a set of short answer questions shared across the two activities focused on common misconceptions about interpreting trees - including how to determine relative relatedness and whether one species can be more advanced or primitive than another.
Activity 2: Analyzing Trees. Students in this treatment mapped morphological characters on an existing tree representing six major groups of chordates (Additional file 1: Supplement 2). They also were asked to draw an alternative representation of the tree which maintained the given relationships.
Experiment 1: is student ability to interpret phylogenies maximized by introducing tree-thinking through building a tree or analyzing an existing tree?
In Spring 2011, students were assigned an initial reading assignment on phylogenies from the textbook required for the course. In class, the instructor briefly introduced tree-thinking in an approximately 10-minute mini-lecture. Students (n= 314) in the lecture hall were then instructed to work in groups of two to three on one of the two randomly-assigned tree-thinking activities. The activ-ities took approximately 30 minutes for students to complete. During the activity, teaching assistants (one TA per 50 students) and the instructor walked around the room and engaged student groups who had questions. After students turned in their activities, the instructor ended the class session with a 10-minute wrap-up lecture. Students earned two course points for participating in the exercise (approximately 0.25% of their final grade). Stu-dents were not given feedback on their activity answers before the post-class assessment (but were provided a key to the activities after the assessment was due). Activities were later scored for correctness, but this score did not in-fluence student grades.
Assessment development and implementation
The night of the classroom activities, students com-pleted a post-activity assessment consisting of eight multiple-choice questions (Additional file 1: Supplement 3). We used a night of assessment to isolate the impact of the in-class activityversus any influence of additional reading or instruction in other class sessions or labs. This assessment was intended as a formative assessment that provided students an opportunity for deliberate practice on concepts that one of the authors (SF) had observed to be challenging in previous terms and that have been identified in the literature (Baum and Offner 2008). The questions were written with the intent of documenting whether students had mastered the key concepts of tree-thinking, not to identify students of varying ability. (Stated another way, we hoped that the majority of students would get the questions right after instruction). The assessment questions developed were examined for content validity by three additional in-structors who have taught tree-thinking in introductory and upper-level biology courses. These instructors con-firmed that all the questions addressed their associated learning goals.
In this assessment, students used an existing tree to make conclusions about relative relatedness, location of synapomorphies, homology vs. homoplasy, and whether any species were more advanced or primitive than another. Students earned two course points for completing this as-sessment (approximately 0.25% of their final grade) and the majority of students did so (87.9% of the class).
Statistical analyses
In addition to qualitative measures, assessment validity and reliability were explored using item response theory. To document construct reliability, a Person Separation Reli-ability Index (analogous to Cronbach’s alpha; Bond and Fox 2001) was calculated in Winsteps (Linacre 2012). Per-son Separation Reliability measures the replicability of the ordering of persons (by ability) if they were given another instrument measuring the same construct (in this case tree-thinking skills). To test the assumption that each question was valid, we assessed item fit (Bond and Fox 2001) using the eRM package in R (Mair and Hatzinger 2007). Item fit measures whether each item is measuring the same construct as the rest of the items on the exam (that is, tree-thinking skills vs. reading comprehension or some other skill). SignificantP values for item fit indicate an item is not measuring tree-thinking. To explore the relative challenge of the assessment questions, we created Wright Maps using the eRM package in R. This also allowed us to determine how well our questions were able to parse out differences in student ability and to rank the questions by difficulty (Lim et al. 2009).
We analyzed two aspects of student achievement in this experiment. Our first goal was to assess whether students, with minimal instructor contribution (approxi-mately 10 minutes of lecture), could correctly reason through questions on the in-class activity that addressed common misconceptions about reading phylogenies. To do so, we quantified the proportion of student groups that correctly answered each question on the two activ-ities. Exam scores in this course typically range from 65% to 72%, so on average we would expect about 70% of the class to be able to answer each question in the ac-tivities correctly. To evaluate whether students did well or poorly on the activity questions, we used a more con-servative threshold of 80%. Our cutoff is more stringent because the clicker literature demonstrates that student responses improve when they are allowed to discuss their answers with each other over when they work alone (Smith et al. 2011) and the activities encouraged students to work together on the questions.
types. The first two questions on the post-activity assess-ment had students place a clade on a tree similar to the tree-building activity, which could have biased the assess-ment results in favor of the tree building activity. To con-trol for this potential bias towards the building trees activity, we ran a second analysis with a reduced set of as-sessment questions that did not include questions 1 and 2. Student scores on the post-activity assessment were highly left skewed, bounded on both sides (ranging only from 0 to 8 or 0 to 6) and discrete (no partial credit was given for incorrect answers). Thus, we could not meet the data normality assumption of most parametric tests. We therefore employed a proportional-odds logistic gression, which is an extension of standard logistic re-gression (Moutinho and Hutcheson 2011; Antione and Harrell 2000), implemented in R with the package MASS (Venables and Ripley 2002). For our full analysis with eight questions, this regression models the effect of our explanatory variables (including activity type and student ability - described more below) on our ordered, categorical-response variable (the total number of ques-tions on the assessment answered correctly) through a series of seven dichotomous comparisons: getting one question correct versus two, three, four, five, six, seven, or eight questions correct; getting one or two questions correct versus three, four, five, six, seven, or eight cor-rect, and so on. (There were no 0s on the assessment, so the 0versus8 comparison was not included). The effect of the explanatory variables is then averaged across all seven comparisons. The betas in this model can thus be interpreted as the effect that a change in the explanatory variable has on the log-odds that the score on the assess-ment will be in a higher rather than lower category (for example, eight correct vs. seven). The same test was performed with the reduced set of six questions.
To control for potential differences in the academic abil-ity of students assigned to the two activabil-ity types, we in-cluded the predicted grade for each student in the course, calculated from college GPA and SAT scores (see Freeman 2007), as an explanatory variable along with the activity type (building or analyzing a tree). We were particularly
interested in documenting whether EOP students
performed better or worse than non-EOP students on this task, so EOP status was the third explanatory variable in-cluded in the model. This comparison was of interest be-cause EOP students historically perform worse on assessments in this course than non-EOP students, but classroom activities like the activities tested here have been shown to reduce the achievement gap (Haak et al. 2011).
We used a likelihood ratio test to determine the signifi-cance of our explanatory variables. This test compares a full model, including the variable of interest, to a model without the variable of interest but retaining the other two explanatory variables. For example, we compared a full
model with EOP status, predicted grade and activity type to a reduced model with just EOP status and predicted grade. If this reduced model was a significantly worse fit to our data, then we concluded that the variable of interest was significant (Fox and Weisberg 2011). This test was implemented in R using the car package (Fox and Weisberg 2011).
Experiment 2: is a student’s ability to interpret
phylogenies after the tree-building activity comparable to that of a graduate student in biology?
This experiment occurred in Fall 2011. As in Spring 2011, students (n= 491) were instructed to read a chap-ter on phylogenies before class; they also took a reading quiz focused on tree vocabulary and basic concepts be-fore class. At the start of the class session, the instructor introduced tree-thinking with a clicker question and then students worked in groups to complete a modified version of the tree-building activity (Additional file 1: Supplement 4). The decision to focus on the tree-building activity was made based on the results from Ex-periment 1.
Assessment
The night of the classroom activity, students completed an assessment consisting of 13 multiple-choice questions each worth 1 point (Additional file 1: Supplement 5). Eight of the questions were identical to those found in the Spring 2011 assessment. Five new questions were added in fall, drawn from a tree-thinking concept inven-tory developed by Naegle (2009). The addition of these five questions was done to increase our ability to dis-criminate between students of different ability levels (a response to our Spring 2011 results). Students earned two points for completing the assessment (0.25% of their final grade). In Spring 2012, 12 biology graduate stu-dents completing their first year of graduate school com-pleted the same 13-question assessment. These graduate students were from a heterogeneous biology department with four students in molecular, cellular, and develop-mental biology, seven in evolution, ecology, and conser-vation biology, and one from physiology, behavior, and biomechanics. These graduate students were blind to the purpose of the experiment.
Statistical analyses
scores from a pooled sample containing both graduate and undergraduate scores and calculated a median for that sample. This sampling method was iterated 100,000 times to create a distribution of median scores. From this distribution we calculated a median and 95% confi-dence interval for the pooled scores. If <5% of the sam-ples had a median equal to or more extreme than the graduate student median, then we would conclude that the graduate student median was significantly different than the undergraduate median at the P = 0.05 level. Conversely, if >95% of the draws had graduate students lower than undergraduates, this would imply that under-graduates may have significantly outperformed the graduate students. We assessed differences in total score on the assessment as well as on each of the 13 questions.
Results
Experiment 1: is student ability to interpret phylogenies maximized by introducing tree-thinking through building a tree or analyzing an existing tree?
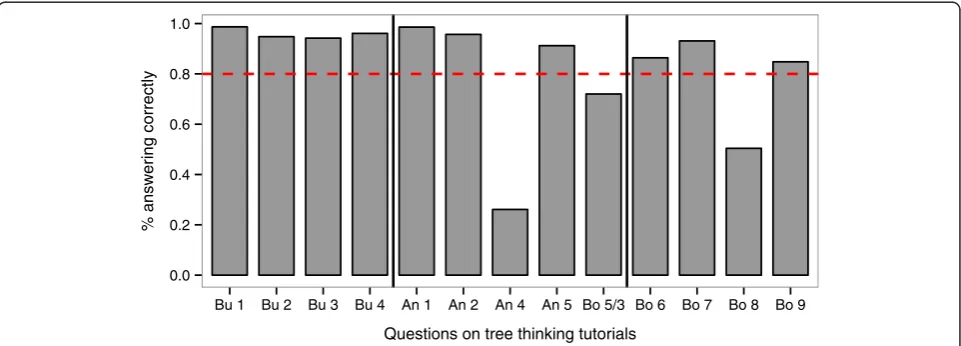
In Spring 2011, 167 students (87 groups) completed the building version while 147 students (69 groups) com-pleted the analyzing version of the tree-thinking activity. Each activity had a set of unique and a set of shared questions. Over 80% of the student groups that did the building-trees activity answered all of the questions unique to that worksheet - questions focused on actually building the phylogeny - correctly (Figure 1). On the questions unique to the analyzing-trees activity, results were mixed. Over 80% of the groups were able to suc-cessfully map characters onto the tree and reorient the tree (Figure 1), but only 26% correctly identified related-ness on the provided tree. The shared questions in the
activities focused on common misconceptions about trees. Over 80% of all student groups were able to an-swer three of the five questions correctly (Figure 1), but they struggled with questions asking them to evaluate rela-tive relatedness (72% answered correctly) and how long species have been evolving (50% answered correctly).
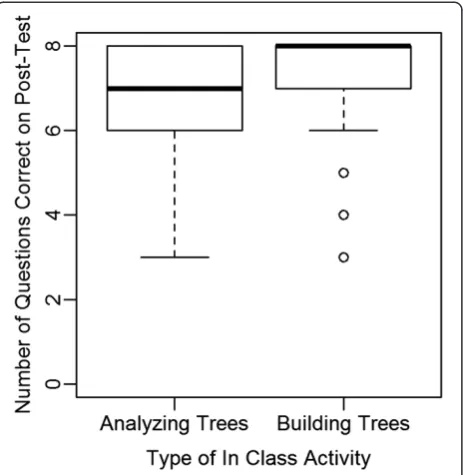
A total of 276 students completed the post-activity assess-ment. The median grade was 8/8 questions correct for stu-dents (n = 143) who participated in the tree-building activity; the median grade was 7/8 for students (n = 133) who completed the analyzing a tree activity (Figure 2). From item fit scores, all the questions appeared to measure the same construct (that is, were not influenced by outside factors like reading comprehension or other challenges un-related to tree thinking; Additional file 1: Table S1) and thus were useful questions. We had a relatively low Person Sep-aration Reliability index (0.34 for the group analyzing a tree and 0.44 for the group building a tree) implying that we had too few questions and too many students of high ability to closely parse out student ability (Bond and Fox 2007; see Additional file 1: Figure S1 and Additional file 1: Figure S2). This is not surprising, given that we were hoping students would master these concepts after the intervention. For the reduced assessment, that excluded the first two questions biased towards the building-trees activity, the median grade for the students in the tree-building activity was 6/6 and for students in the tree-analyzing activity was 5/6.
In the full assessment, only activity type and predicted grade significantly improved the fit of the model (χ2 = 8.85, P = 0.003, and χ2 = 30.6, P < 0.001 respectively). Including EOP status in our model had no significant impact on fit (χ2= 0.296,P= 0.59). Predicted grade had the largest effect on the number of questions answered correctly on the post-activity assessment (β = 0.94 ±
0.0 0.2 0.4 0.6 0.8 1.0
Bu 1 Bu 2 Bu 3 Bu 4 An 1 An 2 An 4 An 5 Bo 5/3 Bo 6 Bo 7 Bo 8 Bo 9
Questions on tree thinking tutorials
% answ
e
ring correctly
0.18; Figure 3). Specifically, a one-point increase on a 4-point grade scale in predicted grade meant that a stu-dent was 2.6 times more likely to answer one additional question correctly on the post-test assessment (all else being held equal). In comparison, completing the tree-building activity rather than the tree-analysis activity meant that a student was 2.0 times as likely to answer one additional question correctly on the post test (β= 0.68 ± 0.23; Figure 3). Thus, the increase in student score on the post-activity assessment attributable to completing the tree-building activity rather than the tree-analyzing activity was equivalent to a 0.66 increase in predicted grade.
A similar pattern is observed on the reduced assess-ment. Of the three explanatory variables tested, only ac-tivity type and predicted grade significantly improved the fit of the model (χ2= 6.7, P = 0.01, andχ2 = 28.6,
P < 0.001 respectively). Including EOP status in our model had no significant impact on fit (χ2 = 0.49,
P = 0.48). Predicted grade had the largest effect on the number of questions answered correctly on the post-activity assessment (β = 0.90 ± 0.18). Just as in the full assessment, with a 1-point increase in predicted grade, a student was 2.5 times as likely to answer an additional question correctly on the assessment. Completing the
Figure 2Student scores on an identical eight-question post-activity assessment.Students were randomly assigned to either an Analyzing Trees or Building Trees activity.
tree-building activity rather than the tree-analysis activ-ity meant that a student was 1.8 times as likely to answer one additional question correctly on the six-question post-test (β=0.60 ± 0.23).
Experiment 2: is a student’s ability to interpret
phylogenies after the classroom intervention comparable to that of a graduate student in biology?
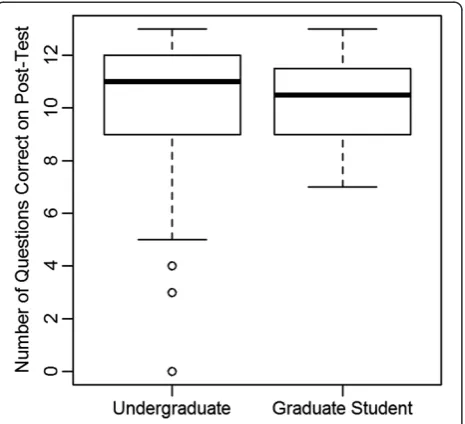
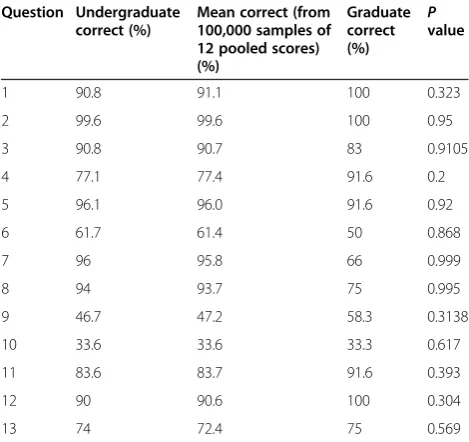
In Fall 2011, 491 undergraduates and 12 graduate students completed a modified version of the post-activity assess-ment with 13 questions (each worth 1 point). The under-graduates completed the tree-building activity prior to the assessment; the graduate students did not. This assess-ment had a higher Person Reliability Index (0.69) and was better able to distinguish students by their ability (Additional file 1: Figure S3). The median graduate stu-dent score on the assessment was 80.7 ± 4.3% (Figure 4). The median undergraduate score was 84.6 ± 0.64%. Using a randomization test to account for the large difference in sample sizes, we found that the scores of the graduate stu-dents and undergraduate stustu-dents were not significantly different (Figure 4b,P= 0.373). The median of the median score for all 10,000 draws of 12 students was 80.7 ± 0.0002% which is the same as the median of the graduate student scores. Overall, the graduate student median score was greater than the pooled sample in only 62.7% of the 100,000 draws. Also, undergraduate scores on individual questions were never significantly lower than graduate student scores (allP>0.20; Table 1). The higher medians and highPvalues reported in Table 1 for questions 7 and 8 suggest that the undergraduates may actually have had
a better understanding of at least two of the concepts tested - that two taxa may be equally closely related to a third taxon, and that groups that retain some ancestral traits are not lower than groups with derived versions of those traits (see Additional file 1: Supplement 5).
Discussion
In this study, student performance on a tree-thinking as-sessment improved when they completed a tree-building
versus a tree-analyzing activity in class, and student scores on an assessment after a tree-building activity were statistically indistinguishable from those of a group of first-year graduate students in biology. Thus, our find-ings do not support Halverson’s (2011) hypothesis that asking students to build trees when they are initially in-troduced to phylogenies complicates the task and re-duces their ability to read trees. The data reported here support the hypothesis that building trees actually im-proves student understanding of how to read trees and further reinforces the efforts that several authors have made to create introductory activities based on building trees (Gendron 2000; Singer et al. 2001; Goldsmith 2003; Julius and Schoenfuss 2006; Lents et al. 2010).
Why is creating trees from data so beneficial? Our hy-pothesis is that it forces students to grapple with what each element in a tree diagram actually represents, as recommended by Baum and Offner (2008). As a result, stu-dents begin interpreting trees through an evolutionary lens rather than simply as a diagram (Novick and Catley 2007; Novick et al. 2010a, b). This ability can help them parse the information available in a tree and determine which infor-mation is biologically relevant. Thus, reading phylogenies may be a similar problem to interpreting schematics in physics (Chi et al. 1981) or mathematic problems (Silver 1979), where experts readily parse out which aspects of the figure/question are relevant for problem solving because they know and understand the concepts underlying the problem, while novices are distracted by superficial features. Although cognitively more challenging than reading trees (Halverson 2011), the extra effort necessary to build trees may be worthwhile if this exercise helps students grasp the underlying biological concepts of trees more readily.
A second key finding of our study is that, with min-imal instruction prior to the activity - a reading assign-ment and approximately 4 minutes devoted to a clicker question - introductory biology students are able to suc-cessfully tackle challenging questions about trees. In addition, as the activity presented in this paper replaced lecture, teaching tree-thinking via an activity did not re-quire any additional course time over the time tradition-ally allocated to it in the course. This course structure, where the activity replaces lecture, differentiates our ac-tivity from all but one of the previously published phyl-ogeny activities (Goldsmith 2003). In the other cases,
activities were conducted in lab or as a supplement to lecture instruction (Gendron 2000; Singer et al. 2001; Julius and Schoenfuss 2006; Catley and Novick 2010; Lents et al. 2010). On average, the activity introduction takes 4 to 10 minutes and the activity itself 30 minutes, which leaves at least 10 minutes of a standard class period for a wrap-up discussion. This discussion can be focused on any remaining student misconceptions, or questions raised through the activity. We have identified four areas our undergraduates, and some graduate stu-dents, still struggle with and suggest that they would be ideal to explore in the closing discussion:
assessing relationships between species with many
intervening nodes;
understanding that extant species are not more
primitive or advanced than other extant species; realizing that relative branching order does not
necessarily represent the chronological sequence in which clades appear; and
recognizing that overall similarity is not necessarily correlated with relatedness.
Teaching tree-thinking almost purely through an activity is possible because students come to class having already read about phylogenies in their textbook. Daily reading
quizzes that cover basic vocabulary and concepts adminis-tered before class (Additional file 1: Supplement 6) help insure that students complete the required reading. These quizzes take no extra class time and are easily graded by a standard class management system. Without this kind of enforced accountability, it is common for only 25% of stu-dents in introductory courses to actually complete a given reading assignment (Burchfield and Sappington 2000). But with reading quizzes, 64% to 100% of students do the reading (Ruscio 2001; Johnson and Kiviniemi 2009). We emphasize the importance of this sort of accountability because it ensures that students come to class prepared to tackle the more difficult concepts involved with tree-thinking.
This study is an example of what we call ‘second-gen-eration’ biology education research. Second-generation research is based on the realization that active learning is more effective than passive lecture - a conclusion based on a large body of research (Dirks 2011; Ruiz-Primo et al. 2011). We argue that it is time for re-searchers to focus on questions about how to teach specific topics in biology by testing alternative hypoth-eses or assessing the relative value of different active learning techniques. In this study we explored whe-ther two different frameworks for teaching phylogenies were equally effective. By using the same mode of instruction in this case, paperandpencil activities -we -were able to demonstrate that the effect -we saw was due to the difference in the conceptual framework of in-struction, and not the mode of delivery. We also assessed the educational significance of the intervention by comparing the performance of undergraduates after the intervention to a meaningful reference - the perfor-mance of first-year graduate students. Grounding results in this way can allow researchers to assess how useful an intervention has been in furthering student understanding.
Conclusions
The phylogenies education literature demonstrates that a second generation framework can successfully focus re-search effort on the intricacies of student learning. By delving into the particular challenges of a topic they have determined, for example, which representation are most intuitive (Novick and Catley 2007; Baum and Offner 2008), which concepts are particularly challenging for stu-dents (Meir et al. 2007; Omland et al. 2009; Naegle 2009), and what type of active learning is most effective for a par-ticular topic (Perry et al. 2009). In addition, this study has demonstrated that introducing phylogenies by having stu-dents build trees is more effective than having them analyze pre-existing phylogenies. In summary, as demon-strated by the growing body of literature of teaching phy-logenies, we contend that second-generation research is Table 1 Percentage of undergraduate and graduate
students that correctly answered each question on the post-activity assessment
Question Undergraduate correct (%)
Mean correct (from 100,000 samples of 12 pooled scores) (%)
Graduate correct (%)
P
value
1 90.8 91.1 100 0.323
2 99.6 99.6 100 0.95
3 90.8 90.7 83 0.9105
4 77.1 77.4 91.6 0.2
5 96.1 96.0 91.6 0.92
6 61.7 61.4 50 0.868
7 96 95.8 66 0.999
8 94 93.7 75 0.995
9 46.7 47.2 58.3 0.3138
10 33.6 33.6 33.3 0.617
11 83.6 83.7 91.6 0.393
12 90 90.6 100 0.304
13 74 72.4 75 0.569
both stimulating and fruitful - not only for tree-thinking, but across the entire breadth of biology.
Additional file
Additional file 1: Table S1.Fit statistics for eight-question assessment used in Spring 2011. Scores depend on students taking assessment, so presented separately for Analyzing and Building groups. In the Analyze treatment all the students answered question 2 correctly, so fit statistics could not be calculated.Figure S1.Person-Item Map for eight-question assessment for students in the Analyzing a Tree Treatment. Questions are sorted by their relative difficulty. No students got question 2 wrong and so it was not placed on this figure.Figure S2.Person Item Map for eight-question assessment for students in the Building a Tree Treatment. Questions are sorted by their relative difficulty.Figure S3.Wright Map of 13-question assessment. Questions are sorted by their relative difficulty. Supplement 1:Tree-building activity (Spring 2011 version).Supplement 2:Tree-analysis activity (Spring 2011 version).Supplement 3:Spring 2011 Assessment.Supplement 4:Tree-building activity (Autumn 2011 version).Supplement 5:Tree-thinking assessment (Autumn 2011 version).Supplement 6:Tree-thinking Reading Quiz (Autumn 2011 version).
Competing interests
The authors declare that they have no competing interests.
Authors’contributions
SE did all data analysis and figure preparation and contributed to manuscript preparation. AC, MPW, and SF contributed to experimental design, data collection, and manuscript preparation, and SF wrote the assessment questions. All authors read and approved the final manuscript.
Acknowledgements
We are grateful to Roddy Theobald for statistical advice, Veronica Di Stilio for permission to perform an experiment in her class, the 1st-year graduate students in the University of Washington’s Department of Biology for completing the tree-thinking assessment, and John Parks, Dozie Okoroafor, and Mikhail Koval for logistical support. The project was funded by the National Science Foundation (DUE-0942215).
Received: 9 April 2013 Accepted: 10 April 2013 Published: 19 June 2013
References
Antione, G, & Harrell, FE. (2000). Ordinal response regression models in ecology. Journal of Vegetation Science, 11(5), 617–626.
Baum, DA, & Offner, S. (2008). Phylogenies and tree-thinking.American Biology Teacher, 70(4), 222–229.
Baum, DA, Smith, SD, & Donovan, S. (2005). The tree-thinking challenge.Science, 310(5750), 979–980.
Baum, DA, Smith, SD, Donovan, SS (2006). Comment on Tree-thinking (Science Online, 22 March).AAAS Science. Magazine: Published E-Letter responses, 310, 979-980. [http://www.sciencemag.org/content/310/5750/979.short/ reply#sci_el_3420]. Accessed 21 August 2012.
Bond, TG, & Fox, CM. (2001).Applying the Rasch Model: Fundamental measurement in the Human Sciences. Mahwah, NJ: Lawrence Erlbaum Associates. Burchfield, C, & Sappington, J. (2000). Compliance with required reading
assignments.Teaching of Psychology, 27(1), 58–60.
Catley, KM, & Novick, LR. (2012). Phylogenetics Laboratory: Reconstructing Evolutionary History Instructors' Guide and Answer Key (version 2.2).Unpublished laboratory instructors' guide. Nashville, TN:Department of Psychology and Human Development, Vanderbilt University. [http://www.vanderbilt.edu/peabody/novick/ evol_diagrams.html]. Accessed 21 August 2012.
Catley, KM, & Novick, LR. (2009). Digging deep: Exploring college students’knowledge of macroevolutionary time.Journal of Research in Science Teaching, 46(3), 311–332. Catley, KM, & Novick, LR. (2008). Seeing the wood for the trees: An analysis of
evolutionary diagrams in biology textbooks.BioScience, 58(10), 976–987.
Catley, KM, Novick, LR, & Shade, CK. (2010). Interpreting evolutionary diagrams: When topology and process conflict.Journal of Research in Science Teaching, 47(7), 861–882.
Chi, MTH, Feltovich, PJ, & Glaser, R. (1981). Categorization and representation of physics problems by experts and novices.Cognitive Science, 5(2), 121–152. Crisp, MD, & Cook, LG. (2005). Do early branching lineages signify ancestral traits?
Trends in Ecology and Evolution, 20(3), 122–128.
Dirks, C (2011). The current status and future direction of biology education research. National Research Council Commissioned Paper. [http://sites.nationalacademies. org/dbasse/bose/dbasse_080124#.UbjWi5xroZ5]. Accessed 21 August 2012. Fox, J, & Weisberg, S. (2011).An R Companion to Applied Regression(2nd ed.).
Thousand Oaks, CA: Sage.
Gendron, RP. (2000). The classification and evolution of caminalcules.American Biology Teacher, 62(8), 570–576.
Goldsmith, DW. (2003). The Great Clade Race: presenting cladistic thinking to biology majorsand general science students.American Biology Teacher, 65(9), 679–682.
Gregory, TR. (2008). Understanding evolutionary trees.Evolution: Education and Outreach, 1(2), 121–137.
Halverson, KL, Pires, CJ, Abel, SK. (2011). Exploring the complexity of tree thinking expertise in an undergraduate systematics course.Science Education, 95(5), 794–823.
Halverson, KL. (2011). Improving tree-thinking one learnable skill at a time. Evolution: Education and Outreach, 4(1), 95–106.
Johnson, BC, & Kiviniemi, MT. (2009). The effect of online chapter quizzes on exam performance in an undergraduate social psychology course.Teaching of Psychology, 36(1), 3–37.
Julius, ML, & Schoenfuss, HL. (2006). Phylogenetic reconstruction as a broadly applicable teaching tool in the biology classroom: The value of data in estimating likely answers.Journal of College Science Teaching, 35(7), 40–45. Lents, NH, Cifuentes, OE, & Carpi, A. (2010). Teaching the process of molecular phylogeny and systematics: a multi-part inquiry-based exercise.CBE-Life Sciences Education, 9(4), 513–523.
Lim, SM, Rodger, S, & Brown, T. (2009). Using Rasch analysis to establish construct validity of rehabilitation assessment tools.International Journal of Therapy and Rehabilitation, 16(5), 251–260.
Linacre, JM. (2012).Winsteps® Rasch measurement computer program. Beaverton, OR: Winsteps.com. Accessed 8 March 2012.
Mair, P, & Hatzinger, R. (2007). Extended Rasch modeling: The eRm package for the application of IRT models in R.Journal of Statistical Software, 20(9), 1–20. Mead, LS. (2009). Transforming our thinking about transitional forms.Evolution:
Education and Outreach, 2(2), 310–314.
Meir, E, Perry, J, Herron, JC, & Kingsolver, J. (2007). College students’misconceptions about evolutionary trees.American Biology Teacher, 69(7), e71–e76.
McTighe, J, & Wiggins, G. (1999).The Understanding by Design Handbook. Alexandra, VA: Association for Supervision and Curriculum Development. Nadelson, LS, & Southerland, SA. (2010). Examining the interaction of acceptance
and understanding: How does the relationship change with a focus on macroevolution?Evolution: Education and Outreach, 3(1), 82–88. Novick, LR, & Catley, KM. (2007). Understanding phylogenies in biology: The
influence of a Gestalt perceptual principle.Journal of Experimental Psychology: Applied, 13(4), 197–223.
Novick, LR, Catley, KM, & Schreiber, EG. (2010a).Understanding Cladograms: An Introduction to Tree Thinking (version 3) (Unpublished instructional booklet). Nashville, TN: Department of Psychology and Human Development, Vanderbilt University.
Novick, LR, Catley, KM, & Funk, DJ. (2010b). Characters are key: the effect of synapomorphies on cladogram comprehension.Evolution: Education and Outreach, 3(4), 539–547.
Omland, KE, Cook, LG, & Crisp, MD. (2008). Tree thinking for all biology: the problem with reading phylogenies as ladders of progress.BioEssays, 30(9), 854–867. Padian, K, & Angielczyk, KD. (2007).“Transitional”forms versus transitional
features. In AJ Petto & LR Godfrey (Eds.),Scientists Confront Intelligent Design and Creationism(pp. 197–230). New York, NY: Norton.
Perry, J, Meir, E, Herron, JC, Maruca, S, & Stal, D. (2008). Evaluating two approaches to helping college students understand evolutionary trees through diagramming tasks.CBE-Life Sciences Education, 7(2), 193–201. Ruiz-Primo, MA, Briggs, D, Iverson, H, Talbot, R, & Shepard, LA. (2011). Impact of
undergraduate science course innovations on learning.Science, 331(6022), 1269. Ruscio, J. (2001). Administering quizzes at random to increase students’reading.
Sandvik, H. (2008). Tree thinking cannot be taken for granted: challenges for teaching phylogenetics.Theory in Biosciences, 127(1), 45–51.
Shaffer, PS, & McDermott, LC. (2005). A research-based approach to improving student understanding of the vector nature of kinematical concepts. American Journal of Physics, 73(10), 921–931.
Silver, EA. (1979). Student perception of relatedness among verbal problems. Journal for Research in Mathematics Education, 10(3), 195–210.
Singer, F, Hagen, JB, & Sheehy, RR. (2001). The comparative method, hypothesis testing andphylogenetic analysis - an introductory laboratory.American Biology Teacher, 63(7), 518–523.
Smith, MK, Wood, WB, Krauter, K, & Knight, JK. (2011). Combining peer discussion with instructor explanation increases student learning from in-class concept questions.CBE-Life Sciences Education, 10(1), 55–63.
Venables, WN, & Ripley, BD. (2002).Modern Applied Statistics with S(4th ed.). New York, NY: Springer.
doi:10.1186/1936-6434-6-13
Cite this article as:Eddyet al.:How should we teach tree-thinking? An
experimental test of two hypotheses.Evolution: Education and Outreach
20136:13.
Submit your manuscript to a
journal and benefi t from:
7Convenient online submission
7Rigorous peer review
7Immediate publication on acceptance
7Open access: articles freely available online
7High visibility within the fi eld
7Retaining the copyright to your article