Does Industry Affect the Cash Flow Statement Presentation Format?
Xiaojie Christine Sun1, PhD, Yang Xu2, PhD & Lijuan Zhao1, Ph.D.
1 Department of Accounting, College of Business and Economics, California State University, Los Angeles, Los
Angeles, CA 90032, USA 2
College of Business and Administration, University of Colorado Colorado Springs, Colorado Springs, CO 80918, USA
Correspondence: Lijuan Zhao, Ph.D., Department of Accounting, College of Business and Economics, California State University, Los Angeles, Los Angeles, CA 90032, USA
Received: April 4, 2018 Accepted: April 24, 2018 Online Published: April 29, 2018
doi:10.5430/afr.v7n3p1 URL: https://doi.org/10.5430/afr.v7n3p1
Abstract
The statement of cash flows of a business can be presented byusing either the direct method (DM) or the indirect method (IM). In United States, only a small portion of businesses use the DM. Compared to the IM, the DM has been shown to provide incremental information in predicting future cash flows. Furthermore, the DM can also improve the ability to compare the individual component of cash receipts and cash payments among similar companies over a period of time. This study finds that firms choosing the DM tend to be in high tech industries.
Keywords: direct method, indirect method, high-tech industries
1. Introduction
Statement of Financial Accounting Standards No. 95 (SFAS 95) allows firms to use either direct method (DM) or indirect method (IM) to present the statement of cash flows. In US, only a small group of business is using DM. Compared to IM, DM has been shown to provide incremental information in predicting future cash flows and improving the comparative ability of individual component of cash receipts and cash payments across similar firms over times (Krishnan and Largay 2000; Orpurt and Zang 2009; Richardson 1991). However, Chief Accountant of Standard and Poor’s, Neri Bukspan, estimated that only less than five firms in fortune 500 select to use DM disclosure. American Institute of Certified Public Accountants conducted a survey about DM and IM to prepare the statement of cash flows and found that “only six to eight companies out of 600 large public and private companies polled go direct.” One alleged reason for firms to avoid DM is the high cost caused by disclosing DM cash flows. Given the high costs caused by DM, what kind of firms will be more likely to use DM to present the statement of cash flows? Therefore, the purpose of this study is trying to answer this question.
2. Literature Review
SFAS 95 was passed in late 1987 and became effective in July 15, 1988. Before the SFAS 95, the Accounting Principles Board Opinion No. 19 (APB 19) required firms to disclose the changes in financial position, which was often called “funds statement.” IM disclosure reflects lots of disclosure requirements in the APB 19. Therefore, the supporters of IM claimed that IM was more consistent with what was used in the past. APB 19 required firms to disclose the main sources and uses of capital of chances in financial position, including the disclosure of funds from operations. However, there were many criticisms of APB 19. The major criticism was that the funds were not well defined. Some firms defined fund as working capital, but others defined it as cash. In addition, APB 19 required firms to disclose the funds from operations, but did not clearly define the operations. Accordingly, there was serious inconsistency among firms in presenting the funds statement. Since the funds statement was criticized, there was a shift from focusing on working capital to cash flows during the late 1970’s and early 1980’s. In 1981, FASB issued an exposure draft on reporting income, cash flows and financial position and defined the fund as cash instead of working capital. Finally, the SFAS 95 was passed in 1987 and became effective in July 15, 1988. “The primary purpose of a statement of cash flows is to provide relevant information about the cash receipts and cash payments of an enterprise during a period” (SFAS 95, para 4).
believed that interest and dividends paid were the cost of financing and should be included in financing activities. Similarly, interest and dividends received were the returns from investments and should be classified as investing activities. However, SFAS 95 classified interest paid, interest received and dividends received as operating activities and dividends paid as financing activities.
Another disagreement among board members was whether to use DM or IM to report the cash flow from operations. Most commercial lenders advocated requiring use of DM because the detailed information disclosed by DM would help them assess firms’ ability to pay off debts. However, preparers and providers of financial statements strongly supported IM. They claimed that IM was less costly to use and it was more consistent with what was used in the past. SFAS 95 was finally passed only by a vote of 4 to 3 and two board members claimed that by “permitting the continued use of the indirect method, the Board has foregone the opportunity to make a significant contribution to the quality of financial reporting and to enhanced user understanding of cash flows from operating activities” (para. 34).
In October 16, 2008, FASB and ISAB issued a joint discussion paper titled “Preliminary Views on Financial Statement Presentation”. The purpose of the discussion paper is to seek the comments on whether the financial statement presentation format proposed improve the usefulness of information provided by business and help users make decisions. The discussion paper indicates that an entity should disclose the cash receipts and payments from the operating activities (DM), rather than just adjusting net income (losses) to the net operating cash flows (IM). DM is more consistent with the proposed purpose of the presentation format of financial statements than IM. They also state that “Presenting cash receipt and cash payment line items in the operating category provides a more useful disaggregation of cash flow information. In addition, a direct method presentation helps users relate information about operating assets and liabilities and operating income and expenses to operating cash receipts and payments” (FASB 2008, paragraph S12).
FASB initially planned to finalize the standard about DM and IM by the end of 2011. However, due to the flooding comments letter that FASB received, the project has been postponed. During that time, FASB received more than 300 comments letter about the DM and IM presentation format. About 50 percent comments favored the DM, about 30 percent support IM and about 20 percent still prefer the choice between the two. Brahmasrene et al. (2004) conducted a survey to examine the preferences in cash flow statement format. They compared the preferences among different groups and different industries. Overall, the results show that most of users prefer the IM. However, investors and analysts show a greater preference for the DM than managers’ group. They also find the different preference in different industries. Therefore, in this paper, we try to explore which industry may prefer to use DM. The next section will compare the DM and IM.
There is a long-term debate over the benefits and costs of DM disclosures and IM disclosures. SFAS 95 allows using either method. However, the purpose of the statement of cash flows is to provide the information about cash receipts and cash payments. Therefore, most creditors suggest the board to use DM because it is more consistent with the purpose of cash flow statements. DM and IM only provide different information for operating activities, for financing and investing activities, the information is same. In this section, this study summarizes the advantages and disadvantages of DM and IM.
(1) DM
sources of operating cash receipts and payments made, which will be useful in forecasting future operating cash flows. DM also helps users understand the cash flow data and assist in analyzing the cash flows. The decomposed operating cash flow information is more useful than the total number in revealing firms’ ability to generate sufficient cash to pay debts. SFAS 95 states that “the primary purpose of a statement of cash flows is to provide relevant information about the cash receipts and cash payments of an enterprise during a period” (SFAS 95, para 4). Therefore, DM is more consistent with the purpose of the statement of cash flows. The DM information is valuable to evaluate firms’ ability to generate future cash flows, to meet dividend and debt obligations, which assists investors and creditors access the liquidity, financial flexibility and solvency of an entity. However, DM has been criticized to be more costly to implement.
(2) IM
IM explains why the net cash flows from operating activities are different from net income; it is less costly and more convenient to implement. However, the IM format has been criticized to confuse users. For example, the expenses adding back to the cash flows from operating activities, such as depreciation expense, suggest that expenses are a source of cash as well.
DM provides the information about the cash receipts and cash payments of a firm during a period, such as cash received from customers and cash paid to the suppliers. Conversely, IM starts with the net income (or net losses) and makes adjustments to calculate the cash flows from operating activities. IM links the cash flows from operating activities to the results in accrual accounting income statements. The CFA Institute claimed that even a skilled analyst cannot reconstruct DM items based on the information provided by IM (CFA-Institute 2007), which indicate that computing the DM components is not a simply mechanically work. Various studies also provide evidences that DM items cannot be accurately reconstructed by the information disclosed by IM.
3. Hypothesis
As discussed in previous sections, both DM and IM are allowed to prepare the statement of cash flows. If the DM is selected, the reconciliation to IM must be presented. Thus, DM, as one of the media for voluntary disclosure, can be used by firms to voluntarily provide additional operating cash flow information. Managers have incentives to voluntarily disclose DM information only when this information is useful to assess firms’ value and influence firms’ stock price (Dye 1985). For example, Dye (1985) and Chen et al. (2002) show that when firms’ current earnings are less informative or future earnings are uncertain (such as high tech firms), managers are more likely to voluntarily disclose more information to supplement the less information contained in the current earnings and help investors assess firms’ value. In addition, Brahmasrene et al. (2004) conducted a survey about the preference of different statement of cash flows’ format. They found that different industry also had different preference for the DM and IM. Different firms or industries may have different motives to disclose DM cash flows. High tech is a special industry with high uncertainty of future earnings. In general, it is more difficult to forecast future performance for high tech firms. Since the DM has been shown to provide useful information to predict firms’ future performance, accordingly, high tech firms may be more likely to use DM. Based on this logic, this study expects that high tech firms are more likely to disclose DM cash flow information because the additional information disclosed by DM helps investors evaluate the firms’ ability to generate cash in the future. Following Francis and Schipper (1999), this study use Compustat SIC codes to define the high tech firms. If the SIC codes of firms are 283 (Drugs), or 357 (Computer and office equipment), or 360 (Electrical machinery and equipment excluding computers), or 361 (Electrical transmissions and distribution equioment), or 362 (Electrical industrial apparatus), or 363 (Household applicances), or 364 (Electical lighting and wiring equipment), or 365 (Household audio, video equipment and audio receiving), or 366 (Communication equipment), or 367 (Electric components, semiconductors), or 368 (Computer hardware), or 481 (Telephone communications), or 737 (Computer programming, software, data processing), and 873 (Research, development and testing services), then firms are high tech firms, otherwise firms are low tech firms. The first hypothesis can be stated as follows:
Hypothesis: High tech firms are more likely to disclose DM cash flow information.
4. Sample Selection
This study collects the sample of firms choosing DM in Lexis/Nexis. This study uses the following key words to search in the database to identify the firms that use DM:
-Direct method
-Cash collection from customers
-Cash received from customers
-Cash receipts from customers
-Cash paid to suppliers
-Cash payments to supplier
-Cash paid for interest
-Cash paid for tax
After searching in Lexis/Nexis, this study firstly find that 548 firms use DM over the fiscal years 1989 through 2009. Due to the data constrains on COMPUSTAT, 208 firms were eliminated. In addition, financial and utility firms with SIC codes between 6,000 and 6,999 and between 4,900 and 4,999 were excluded from the sample. Therefore, the final full sample consists of 217 DM firms from 1989 to 2009. Table 1 summarizes the sample selection.
Table 1. Sample Selection and Distribution
Number of Firms
Initial DM sample identified from Lexis/Nexis for fiscal years from 1989 to 2009
548
Less:
Compustat data requirements (208)
Financial industry (123)
Final DM sample 217
DM: Direct Method
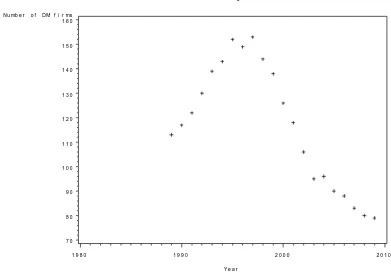
The total IM sample includes 18,716 firm-year observations over the sample period. Panel B of Table 2 presents the frequency and proportion of IM firms. Figure 1 shows the changes of DM firms from 1989 to 2009. Figure 1 indicates that the number of DM firms has been increasing from 1989 but largely decrease after 2002.
Figure 1. DM firm-year observations from 1989 to 2009 Nu mb e r o f DM f i r ms
7 0 8 0 9 0 1 0 0 1 1 0 1 2 0 1 3 0 1 4 0 1 5 0 1 6 0
Y e a r
Consistent with Figure 1, Panel A of table 2 shows the similar pattern of the changes of DM firms. Table 2 documents the DM sample distribution by year and industries.
Table 2. Descriptive Analysis of Firms using DM
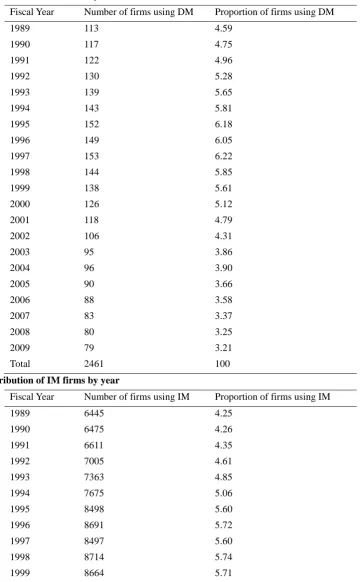
Panel A: Distribution of DM Firms by Year
Fiscal Year Number of firms using DM Proportion of firms using DM
1989 113 4.59
1990 117 4.75
1991 122 4.96
1992 130 5.28
1993 139 5.65
1994 143 5.81
1995 152 6.18
1996 149 6.05
1997 153 6.22
1998 144 5.85
1999 138 5.61
2000 126 5.12
2001 118 4.79
2002 106 4.31
2003 95 3.86
2004 96 3.90
2005 90 3.66
2006 88 3.58
2007 83 3.37
2008 80 3.25
2009 79 3.21
Total 2461 100
Panel B Distribution of IM firms by year
Fiscal Year Number of firms using IM Proportion of firms using IM
1989 6445 4.25
1990 6475 4.26
1991 6611 4.35
1992 7005 4.61
1993 7363 4.85
1994 7675 5.06
1995 8498 5.60
1996 8691 5.72
1997 8497 5.60
1998 8714 5.74
1999 8664 5.71
2001 7679 5.06
2002 7274 4.79
2003 6987 4.60
2004 6785 4.47
2005 6574 4.33
2006 6320 4.16
2007 6014 3.96
2008 5835 3.84
2009 5480 3.61
Total 151821 100
Panel C: Distribution of DM firms by industry
SIC Industry Frequency Percent
08 Forestry & Wood Products 1 0.30
10 Metal mining 6 2.88
12 Bituminous Coal, Lignite Mng 1 0.32
13 Crude Petroleum and Natural Gas 12 4.81
14 Chem, Fertilizer Mineral Mng 1 0.32
15 Building construction 2 0.64
16 Heavy Construction 1 0.32
20 Food products 5 1.60
22 Textiles 3 0.96
23 Apparel 3 0.96
24 Lumber and wood products 1 0.32
25 Household furniture 4 1.28
26 Paper mills 2 0.64
27 Newspaper publishing 3 0.96
28 Chemicals 13 5.45
29 Petroleum Refining 4 1.28
30 Rubber and tires 3 1.60
32 Cement, Hydraulic 3 0.96
33 Furnaces and steel works 3 0.96
34 Metal cans 1 1.60
35 Machinery and computer equipment 16 5.13
36 Electrical and industrial apparatus 13 4.81
37 Motor vehicles 5 1.60
38 Lab apparatus and measurement instruments 13 4.17
39 Games,Toys,Child Vehicles,Except Dolls 2 0.96
42 Trucking 2 0.64
44 Water transportation 2 0.64
48 Radio, phone, and television communications 14 5.13
50 Wholesale (durable goods) 8 2.88
51 Paper products 2 1.28
53 General merchandise stores 3 0.96
54 Grocery stores 3 1.60
55 Auto dealers 1 0.32
56 Family clothing stores 1 0.32
57 Furniture stores 1 0.32
58 Eating and Drinking Places 2 1.28
59 Miscellaneous retail 12 3.85
70 Hotels and motels 3 1.28
73 Computer Programming Service 26 9.94
79 Recreational activities 3 0.96
80 Health services 2 0.96
82 Schools 1 0.32
87 Engineering services 6 2.24
89 Services, NEC 1 0.32
99 Nonclassifiable establishment 2 1.28
Total 217 100.00
Panel A and Panel B of Table 2 reports the frequency and proportion of DM and IM firms. Panel A shows that the percentage of firms using DM has increased from 4.59 percent in 1989 to 6.22 percent in 1997. However, since 1998, the percentage of DM firms has declined from 5.85 percent in 1998 to 3.21 percent in 2009. As mentioned in Orpurt and Zang (2009), this study was not able to identify why the number of DM firms has been changed over the time.
Panel C of Table 2 reports the distribution of firms using DM by industries. These industries are identified by two digits SIC code. Panel B indicates that there is a wide variation in the proportions of firms using DM across industries. For example, chemicals industries (28), Machinery and computer equipment (35), Electrical and industrial apparatus (36), Radio, phone and television communications (48), Computer programming services (73), and Engineering services (87) industries have the highest proportion to use DM. These industries are defined as high tech industries in this study and Panel B is consistent with the first hypothesis that high tech firms are more likely to use DM to prepare the statement of cash flows.
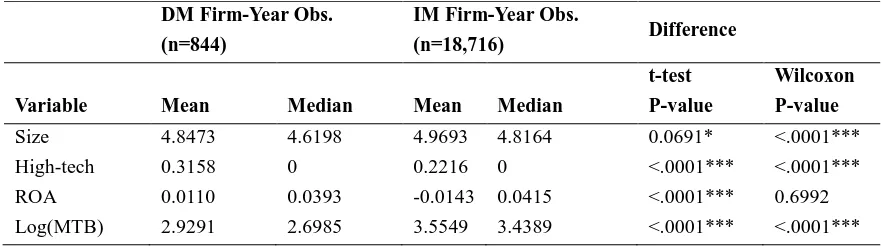
Descriptive statistics is presented in Table 3. The primary differences between DM and IM group in full sample are firm size, high-tech or low-tech and market-to-book ratio. The t-test and Wilcoxon rank-sum test are both significant at less than 1 percent, which indicate that overall DM firms are smaller, lower market-to-book ratio, and in high-tech industries. The results that smaller firms are more likely to use DM are also consistent with current literature (Hunt et al. 2008; Orpurt and Zang 2009).
Table 3. Mean and Median Comparison for Variables Used in Logit model--Full Sample
DM Firm-Year Obs.
(n=844)
IM Firm-Year Obs.
(n=18,716) Difference
Variable Mean Median Mean Median
t-test
P-value
Wilcoxon
P-value
Size 4.8473 4.6198 4.9693 4.8164 0.0691* <.0001***
High-tech 0.3158 0 0.2216 0 <.0001*** <.0001***
ROA 0.0110 0.0393 -0.0143 0.0415 <.0001*** 0.6992
Log(MTB) 2.9291 2.6985 3.5549 3.4389 <.0001*** <.0001***
4. Conclusions
IAS 7 and SFAS 95 recommend firms use DM to present the statement of cash flows, but a large percent of firms are still choosing IM because firms claim that their current accounting systems do not collect DM cash flow information. Therefore, it will be more costly to use DM. Existing study has investigated the different information provided by DM and IM and shows that DM information is more useful in forecasting future cash flows. In addition, DM cash flow disclosure is easy to read and understand. This study looks into the high tech firms and low tech firms to investigate the industry effect. Future earnings of high tech firms are usually uncertain, and it would be difficult to forecast future cash flows for high tech firms. Thus, high tech firms will be willing to disclose DM cash flow information to investors to indicate their ability to generate cash in the future.
References
AICPA. (1971). Accounting Principles Board Opinion No. 19, Reporting Changes in Financial Position.
Brahmasrene, T., C. D. Strupeck, & D. Whitten. (2004). Examing Preferences in Cash Flow Statement Format. The CPA Journal.
Chen, S., M. L. DeFond, & C. W. Park. (2002). Voluntary disclosure of balance sheet information in quarterly earnings announcements. Journal of Accounting and Economics, 33(2), 229-251. https://doi.org/10.1016/S0165-4101(02)00043-5
Dye, R. A. (1985). Disclosure of nonproprietary information. Journal of Accounting Research, 23(1), 123-145. https://doi.org/10.2307/2490910
Francis, J., & K. Schipper. (1999). Have Financial Statements Lost Their Relevance? Journal of Accounting Research, 37(2), 319-352. https://doi.org/10.2307/2491412
Hunt, A. K., L. M. Lovata, & M. L. Costigan. (2008). Charateristic of companies using different cash flow methods.
Advances in Accounting, Finance and Economics, 1(2), 1-10.
Krishnan, G. V., & J. A. Largay. (2000). The predictive ability of direct method cash flow information. Journal of Business Finance & Accounting 27(1&2), 215-245. https://doi.org/10.1111/1468-5957.00311
Orpurt, S., & Y. Zang. (2009). Do direct cash flow disclosures help predict future operating cash flows and earnings?
Accounting Review, 84(3), 893-935. https://doi.org/10.2308/accr.2009.84.3.893
Sengupta, P. (1998). Corporate disclosure quality and the cost of debt. Accounting Review, 73(4), 459-474.
Skinner, D. J. (1993). The investment opportunity set and accounting procedure choice : Preliminary evidence.
Journal of Accounting and Economics, 16(4), 407-445. https://doi.org/10.1016/0165-4101(93)90034-D
Smith, G. R., Jr., & R. J. Freeman. (1996). Statement of cash flows: The direct vs. indirect method debate continues. Government Finance Review 12(1).
Stott, D. M. (2000). An empirical evaluation of the alternative operating cash flow presentation methods. Ph.D., Washington State University, United States -- Washington.
Tasker, S. C. (1998). Bridging the information gap: quarterly conference calls as a medium for voluntary disclosure.
Review of Accounting Studies, 3(1),137-167. https://doi.org/10.1023/A:1009684502135
Verrecchia, R. E. (1990). Information quality and discretionary disclosure. Journal of Accounting and Economics, 12(4), 365-380. https://doi.org/10.1016/0165-4101(90)90021-U
Watts, R. L., & J. L. Zimmerman. (1978). Towards a positive theory of the determination of accounting standards.
Accounting Review, 53(1), 112-134.
Zey, M. (1998). Rational choice theory and organizatinal theory: a critique. Sage Publications. https://doi.org/10.4135/9781483326863