Distributed Fiber Optical Technology for Damage
Identification of Engineering Structure
https://doi.org/10.3991/ijoe.v14i06.8695
Xiaoma Dong!!", Liqiang Zhou
ZheJiang Industry Polytechnic College, ShaoXing, China
Abstract—To conduct optical fiber monitoring rock slide model test and optical fiber monitoring of steel concrete interface slip model test, the large tri-axial shear test of geotechnical engineering was used. First, the data of sliding distance and optical loss and their dynamic range were obtained. Second, the slide distance and fiber loss relation curve and the fitting equation were worked out. Finally, the typical applications of optical fiber sensing technology in Rock Engineering (high slope engineering, rock foundation of Dam Engineering) slope stability and geological disaster monitoring were put forward. The results showed that optical fiber sensing was very sensitive, and the loss value was 30 to 50dB. The dynamic range of rock slide monitoring fiber was 3 to 3.5mm, and the dynamic range of the interface slip monitoring fiber was 1.6mm. Thus, the sensing system can detect the sliding process of the interface between the con-crete and the steel plate. It provides some reference for the sliding monitoring of the composite materials.
Keywords—Optical fiber sensing technology; sliding distance-fiber loss; engi-neering structure damage
1
Introduction
Structural fracture damage occurs mostly inside the component, which is generally difficult to be observed by the naked eye. The damage caused by the reduction of stiffness is partial, macro feature structures (such as deformation etc.) or function did not change significantly in the general case, when the damage extended to a certain extent it will trigger sudden catastrophic events, causing major losses. The damage identification of such problem in the internal structure is a hard nut to crack. In addi-tion, the accidents of high slope landslide and rock slip and the steel-concrete compo-site structure are applied more and more widely in modern large-scale civil engineer-ing. The main form of failure is the interface slip between steel and concrete. How to monitor the internal sliding damage of this type is a new problem facing damage identification.
self-evident. The study of the related identification methods will play a key role in im-proving the reliability and safety of the structure. In addition, internal damage detec-tion for important and old buildings, such as large bridges and workshops, and rein-forcement and prolongation of service life based on test results are also a concern for civil engineering sector.
2
State of the art
The basic idea of damage identification in engineering structure is as follows. When the structure is damaged, the stiffness and bearing capacity of the correspond-ing parts decrease, which leads to the change of the dynamic characteristics of the structure. Chapeleau X et al. [1] applied the distributed optical fiber sensing technolo-gy to the pavement crack detection. By comparing the vibration information of un-damaged structure and damage structure, the location of damage and the degree of damage are determined. Using the distributed optical fiber sensing technology, Piao, C. et al. [2] detected the abnormality of the grouting shaft wall. The basic process is as follows. The finite element modeling and finite element modal analysis are carried out for the original design of the structure. Rajan, G. et al. [3] used optical fiber sens-ing technology to evaluate the physical properties of dental resin composites. The modal and frequency of the structure are predicted as the dynamic information under the undamaged state of the structure. The experimental modal analysis is carried out on the actual structure with damage, and the modal parameters are obtained as the information to be checked. Based on distributed optical fiber sensing technology, Giannoccaro, N. I. [4] used a new tactile optical device to detect small incision dam-age. The structural dynamic characteristics obtained from the test were compared with those predicted by mathematical models, and the location and degree of damage were determined. The numerical simulation method is usually combined with the dynamic test. Su, H. et al. [5] pointed out that the integrity and safety of dike projects are ob-jectively undermined by crossing culverts and other hydraulic structures, especially earth-rock junctions.
and prolong the service life (more than 20 years), the waterproof ointment of the cable core can be filled between the loose sleeves.
Optical detector (optical detector) is the terminal of optical fiber system. It is an optical signal receiving device. It is an active device that transforms the optical signal into the electrical signal. Optical detection of optical fiber system adopts photon de-tector. The principle is to transform photon energy into electric field and current by means of semiconductor with specific structure, and its quantum efficiency is 80~90%. Barrias, A. et al. [6] found that the singular area of internal temperature in buildings would not be detected inevitably because of a large layout spacing of ther-mistor thermometers and other reasons. Fiber optic sensing is developed with the development of optical communication and the development of IT industry. Many of the devices of optical fiber sensing are common to optical communication in order to reduce the cost by using the advantage of batch quantization. In optical fiber sensing, sensing optical fiber directly transforms environmental signals—monitoring and measuring (such as temperature) into optical signals, that is, optical waveguides in sensing fibers directly accept the modulation of environmental physical quantities.
Masoudi and Newson [7] pointed out that the distributed optical fiber sensing is a unique sensing technology that traditional electric sensing technology does not have. It can measure the physical field along fiber laying path. Lim, K. et al. [8] used a distributed optical fiber sensor to monitor the pressure and stiffness changes in the tube. In recent years, a large number of studies have been carried out to detect the condition of large buildings, dams, bridges and other structures with distributed opti-cal fiber sensing. It is possible to monitor the sliding of the rock mass by embedding the borehole or backfilling cement mortar into the rock mass. Tejedor, J. et al. [9] proposed a machine learning method for pipeline monitoring system based on distrib-uted acoustic sensing. Before sliding, the loss curve detected by OTDR is basically flat. Once sliding occurs, the fiber embedded in the rock will bend and form loss. Lomotowski, G. and Bere!-Pawlik, E. [10] pointed out that due to the loss caused by sliding, the backscatter signal detected by OTDR has a sudden drop. Therefore, the width of the slide can be determined according to the size of the loss, and the position of the slide can be determined by the location of the loss point on the optical fiber. Distributed optical fiber sensing and monitoring technology are able to get the contin-uous distribution of measured information in space and time. It is very suitable for condition monitoring of complex structure such as linear submarine pipeline, oil well and large civil engineering structure.
3
Optical fiber micro bending loss sensing principle
3.1 The light guiding principle of optical fiber
Modern physics believes that the nature of light is the "two wave particle dualism", namely, in different conditions it either fluctuates or shows corpuscular property, when it fluctuates, we call it optic wave and when it demonstrates the latter property, we call it photon beam. Light is mainly manifested in optic wave. It can be described by Maxwell’s electromagnetic wave equation. When light is emitted and is interacting with other substances, light shows particle property and follows quantum theory. According to the wave optics, light is an electromagnetic wave.
One of the basic principles of light conduction is that the properties of light in dif-ferent optical media (velocity, direction) change accordingly. The conduction velocity of light in the vacuum is 300 thousand km/s, and the velocity is reduced when it is conducted through other media. The degree of slowing down the speed of light in a medium is expressed by the refractive index of the medium, that is, as shown in (1).
!
=
" #
(1)In the formula, n is the refractive index, c is the vacuum speed (km/s) and v is the speed of light, the medium (km/s).
3.2 Light loss
Total reflection creates the basic condition for light transmitting in long distance through optical fiber. The basic structure of optical fiber can restrain the light injected into the optical fiber in the optical fiber, and avoid the loss of optical power at the core cladding interface. However, there are two other reasons that lead to the loss of light power in the process of light conduction, which decreases with the increase of the conduction distance and it is called light attenuation or loss. The transmission loss of optical fiber includes two kinds of intrinsic loss and non- intrinsic loss. The intrin-sic loss of the material is caused by the intrinintrin-sic properties of the material, which is not related to the external environment. The source of the intrinsic loss includes: ma-terial absorption and mama-terial scattering.
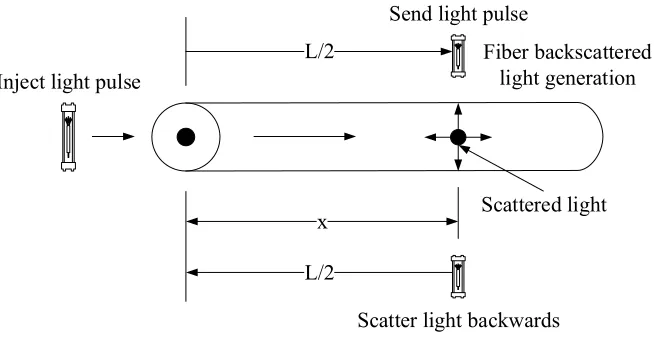
The distributed optical fiber sliding sensor is based on the Rayleigh scattering loss of [160 ~ 162]. Rayleigh scattering loss is caused by the non-directional conduction of light in the optical fiber. The scattering loss includes 3 types: Rayleigh (Rayleigh) scattering; Raman (Raman) scattering; Brillouin (Brillouin) scattering.
x
L/2
L/2
Inject light pulse
Send light pulse
Fiber backscattered
light generation
Scattered light
Scatter light backwards
Fig. 1. Fiber scattered light
Rayleigh scattering is the most important scattering, and Rayleigh scattering loss plays an important role in the total optical fiber loss. The basic characteristics of Ray-leigh scattering light: the frequency and wavelength of RayRay-leigh scattering light are the same as those of the optical waveguide; the light power of Rayleigh scattering light is proportional to the 4th power of the wavelength.
The position of the scattering point can be determined by accurately measuring the time interval of the incident time of the incident light pulse to the backscattered light, as shown in formula (2):
!
!
=
" #
!
(2)This is the principle of the optical radar. In formula (2), X is the light path of the scattering point to the optical fiber entrance.
3.3 Distributed optical fiber slide sensing technique
The principle of optical fiber sensing is that environmental factors acting on optical fiber will affect the transmission of optical waveguides in the optical fiber, and we can perceive environmental parameters by detecting the change of optical wave-guides. The distributed optical fiber sensing of rock mass sliding can detect the con-tinuous distribution of random cracks. The optical fiber crack sensing method is the intensity modulated optical time domain method modelled on the micro bending mechanism. The detected optical information carrier is Ray Leigh scattering. It be-longs to intrinsic scattering and exists everywhere in the core, thus providing optical information along the whole fiber.
( )
( ) ( )
{
!( )
( )
}
" #$%
&
!
" # $ %
& ! = ' ! ! ! ( %
(
&"! !$ +! !$'#)!$ (3)In the formula, P (x) is the backward light power, X is the distance along the opti-cal fiber, S (x) is the scattering acquisition ratio, the "s is the scattering coefficient, Vg is the optical group velocity in the optical fiber, and "f and "b are forward and back-ward attenuation coefficients respectively. OTDR is the optical radar, and there is a simple correlation between the distance X and the positive and reverse transmitting time of light, as in the formula (4):
!
"
!"
=
# $
(4)Normally, for the same fiber, we have "f="b=" and S is a fixed value, light loss value grows exponentially, as shown in formula (5):
( )
! !"# $(
)
" # = $! " !# (5)
A is a constant. Although the value of " generally changes with the value of "s, the
integral
( )
! !
! "!
!
"#
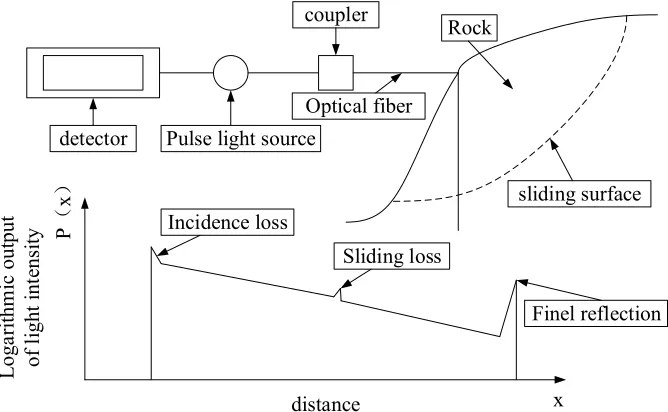
is still very small and its error is very small.The sliding of the rock layer causes the micro bend of fiber buried under, increas-ing the loss; the change of the light power is detected by the OTDR and is located. The basic optical layout and light attenuation waveforms of the distributed optical fiber sliding sensing with OTDR are used in Figure 2.
Pulse light source detector
coupler
Optical fiber
Rock
sliding surface Incidence loss
Finel reflection Sliding loss
distance x
P
x
Loga
rit
hm
ic
out
put
of l
ight
int
ens
ity
Distributed optical fiber sliding sensing is based on single mode optical fiber. When embedded in, it is arranged diagonally or orthogonally with the possible sliding rock layer. Once the level slipped, the fiber will bend slightly. As a sensing mecha-nism, the light loss is aggravated by the micro bending, and the back light is used as the information carrier, and it is perceived and located by OTDR.
The distributed optical fiber sliding sensing system consists of sensing optical fi-ber, transmission optical cable, passive device, optical demodulator, PC, and special software.
4 Distributed optical fiber sensing sliding model test
4.1 Tools for the experiment
In order to simulate the complex deformation state of the actual sliding structure, the triaxial compression experiment is adopted. This ensures that the sensing fiber in the whole process is in a state of embedment, and it is close to the actual structure to the maximum extent. The experiment machine is a SZ-40 type large triaxial compres-sor, which can add the maximum confining pressure of 2.5MPa and the maximum compression stroke of 60mm. Before the experiment, the optical fiber is first used to detect each fiber by fiber optic conductance. In experiment, we use optical power meter to observe the loss of AI9201A type observation fiber, in order to observe the relationship between the change of optical fiber loss and the sliding displacement.
4.2 Experiment methods
The confining pressure of the triaxis test is uses #2=#3. The specimen is a cylindri-cal concrete structure, and the design strength is C40. In the cylindricylindri-cal specimens of the upper and lower circular section pressure induced crack to structure along the direction of slip, so as to realize the monitoring of optical fiber sensing sliding in-duced by sliding plane when sliding, trying to find changes in fiber loss in a slip fail-ure process.
When preparing the specimen, considering that the optical fiber is damaged, 5 par-allel and continuous optical fiber distributed layout modes are adopted, and the optical fiber also adopts different diameter sizes, namely, 2 of 900µm, 2 of 600µm and an-other one, 250µm. The induction seam is uses the organic glass sheet. In the concrete pouring, the lubricating oil is applied to the upper and lower surfaces of the sheet in order to achieve the effect of sliding along the induced seam. A circular tube made of
pieces are made, so 2 PVC tubes prepared, also 2 groups of sensing fibers (5 for each group), and 2 induced seam panels made of organic glass. See Table 1 for detail.
When the fiber is arranged in the PVC tube, the concrete is poured after the pass is made through. The concrete type is No. C40, and the guarantee rate of strength is 98%. For the use of ordinary No. 425 cement, the relevant parameters are shown in Table 2. When the cement and sand are poured in, the PVC tube is inclined so that the induced seam plate remains horizontal. When the amount of concrete in the PVC tube reaches to the plane of the induced seam plate, the PVC tube is gradually straightened up. At the same time, the concrete is added to the straight edge, and at the same time, it should be vibrated. When the concrete in the tube inundated the inducer plate grad-ually, the PVC tube is gradually placed vertically. Until the whole tube is filled with concrete, the PVC tube is then placed on the electric cutting vibration table for 5 minutes, and 2 specimens are poured with water to keep shape.
Table1. Sensing fiber number table
Number 1 2 3 4 5
Fiber optic
parameter $900µm $900µm %600µm %600µm %250µm
Table2. Specimens with the ratio parameters
Parameters Water cement ratio Per unit water use Sand content concrete proportion (volumetric method)
Concrete parameter 0.41 190 33% C0: S0: G0: W0=1.0:1.64:3.41:0.52
4.3 Test on the model
When the fiber is arranged in the PVC tube, the concrete is poured after the pass is made through. The concrete is No. C40, and the guarantee rate of strength is 98%. It uses ordinary No. 425 cement. When the cement and sand are poured in, the PVC tube is inclined so that the induced seam plate remains horizontal. When the amount of concrete in the PVC tube reaches to the plane of the induced seam plate, the PVC tube is gradually straightened up. At the same time, the concrete is added to the straight edge, and at the same time, it should be vibrated. When the concrete in the tube inundated the inducer plate gradually, the PVC tube is gradually placed vertical-ly. Until the whole tube is filled with concrete, the PVC tube is then placed on the electric cutting vibration table for 5 minutes, and 2 specimens are poured with water to keep shape.
The triaxial compression test process was carried out after 28 days of maintenance. The test steps are as following:
The peripheral coarse aggregate used in the experiments is screened (the maximum particle size of not more than 20mm). At the same time, the final check before the fiber test is carried out.
The fiber is extracted from the specimen into the upper pressure discus, and is wrapped up in plastic hose to avoid damage.
The optical fiber is wrapped in a plastic tube and then penetrated into the drainage hole of the base of the triaxial instrument.
Wrap the coarse aggregate with a wire cage around the specimen.
And then operate according to the triaxial test procedure, specifics are omitted. Add pressure and operate according to the triaxial test regulations, see The Rock Test Regulations of Water Conservancy and Hydropower Projects.
4.4 Fiber loss monitoring and statistics analysis
After installing the specimen according to the triaxial experimental procedure, we first conduct a fiber optic conductivity detection. It is found that the 250µm optical fiber of the 1 specimen is damaged during the installation. It is also found that the No. 4 fiber of the 2 specimen is broken and the rest of the fiber is intact. The loss observa-tion is based on the AI9201A type of optical power meter. In order to facilitate obser-vation, we should reduce the step length during the test so as to observe the relation-ship between the power loss in the process of specimen failure and find out the law for the change.
When the specimen is installed in the triaxial instrument and the final passage is detected, the 600µm fiber of the 1 specimen is founded damaged in the installation.
The slip causes the fiber to produce two micro bends. Considering that there are only two sets of power meters in the optical fiber observation, 2 perfect fibers are selected for loss detection. When the loss of fiber is observed, the pressure step should be minimized. The loss changes are recorded on time during the observation.
It is found that the attenuation of optical fiber power is very sensitive to the slip de-formation of the structure. Before the axial compression begins, the attenuation in-creases with the increase of the slip distance.
During the triaxial compression test of No. 1, because the weight of gravel around the specimen pulled down the rubber membrane, resulting in the closed confining pressure. This led to ambient pressure leakage 10 minutes after the start of the test, that is, the ambient pressure water was emitted from the optical fiber through the hole (drainage hole), and it had a certain initial speed from the flow rate of the water, which was considered to be the ambient pressure leakage. At the same time, the pres-sure gauge also shows that the confining prespres-sure output is zero, so it is considered that the test piece 1 is a uniaxial compression test without confining pressure.
0.0 0.5 1.0 1.5 2.0 2.5 0
10 20 30 40 50 60 70 80
Lose
dB
Sliding distancemm
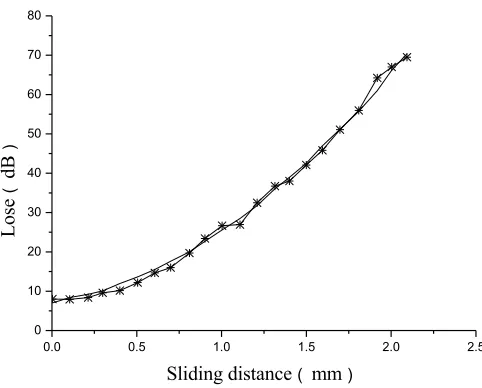
Fig. 3. Loss change of 1 internal slide 2 sensing fiber
0.0 0.5 1.0 1.5 2.0 2.5
0 10 20 30 40 50 60 70 80
Lo
se
dB
Sliding distancemm
Fig. 4. Loss change of 1 internal slide 3 sensing fiber
A semi empirical formula for calculating the attenuation value is presented on the basis of the relationship between the observed data and the variation of the measured data between the slip distance and the loss.
( )
( )
!"# $%
In the formula, &1 and &2 are constant, !! as the sliding distance (the unit is mm), ' as the included angle between the sliding surface (if it is a circular arc then take the tangent point that suggests the sliding trend) of fiber and rock (usually obtuse angle).
The -&1tg' in formula (6) is the contribution of the shearing to light attenuation, and &2/sin' is the contribution of the tensile effect to the light attenuation. When the
parameter ' is small, the shear force is the influence that affects the sliding rock mass, the value of -&1tg' is thus bigger; when ' is larger, tensile force of fiber mainly affects the sliding rock by the sliding force exerted, so the -&1tg' value is larger. The ob-served attenuation values are results of joint action of the shearing and tensile force.
The coefficient &1 and &2 in the formula (6) can be obtained by the least square method. If Figure 3 and 4 are introduced to the formula (6) and starts the least square fitting. After fitting the sensing data of 2 sliding optical fibers, we can draw a conclu-sion that the coefficient &1 and &2 are close to each other. We can get the data fitting of &1 and &2 in pairs using formula (6) in several groups of experiments, and get the values of multiple groups of &1 and &2 respectively, and then we can get the average value. By calculating these values produced thereof , we can have the correlation between light loss A and sliding distance ! and between A and ', the included angle, the ideal model will thus be obtained.
5 Distributed optical fiber sensing interface slip monitoring model test
The application of steel-concrete composite bridge panel is becoming more popu-lar. This is thanks to the bonding performance safety and durability of the structures with steel concrete interaction and steel-concrete interface. Therefore, it is of practical significance to monitoring the interface slip damage. This paper tested the steel-concrete interface slip using the distributed optical fiber sensing. The equipment used in the test, the test process and the concrete specimen pouring are the same as that of the previous rock mass sliding monitoring model test.
5.1 Experiment method
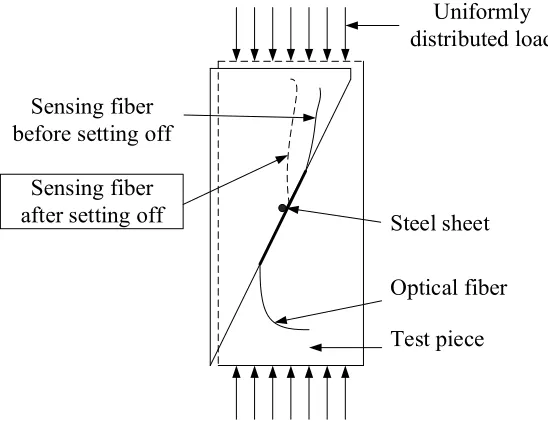
In order to simulate the sliding of the steel-concrete interface. The specimen is em-bedded in the concrete with a steel sheet (about 3mm), and the direction of the steel plate and the concrete slip is roughly parallel. The fiber is arranged on the surface of the steel plate and is tightly attached to the steel plate. At this point, the micro bend-ing loss of the fiber reflects the slidbend-ing process of the interface between the upper concrete and the steel plate.
5.2 Choose the type of fiber optic and laying methods
Concrete Fixed steel wire Optical fiber
Sliding distance
Micro bending Steel plate
Optical fiber Micro bending loss
Fixed steel wire
Fig. 5. Layout of interface slip model of optical fiber sensing interface
Uniformly
distributed load
Steel sheet
Optical fiber
Test piece
Sensing fiber
after setting off
Sensing fiber
before setting off
Fig. 6. A schematic diagram of optical fiber interface sliding sensing model test
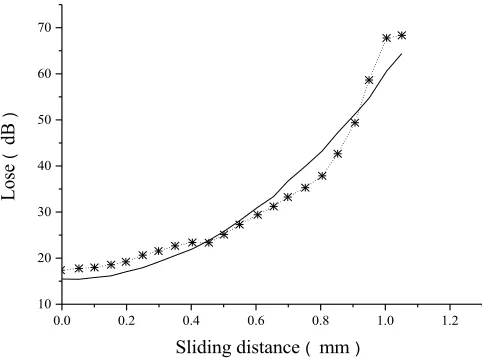
5.3 Experiment results
0.0 0.2 0.4 0.6 0.8 1.0 1.2 10
20 30 40 50 60 70
Lo
se
dB
Sliding distancemm
Fig. 7. Specimen 2 slip No. 1 sensing fiber loss changes
In bridge and other engineering, steel plate concrete composite structure is applied widely, the problem of steel plate concrete fastness directly relates to the lifespan of the structure. The optical fiber sensor can be embedded in the steel concrete interface to monitor the slip state.
6
Conclusion
On the basis of the analysis of mechanics and optics principle of optical fiber sens-ing, distributed optical fiber slide sensing and interface slip sensing technology are put forward, which can be used for rock slide and steel-concrete interface slip moni-toring. Through this study, the following conclusions are drawn.
(1) The triaxial model tests of optical fiber slide sensing and optical fiber interface slip have been carried out. The data of the corresponding relation between the slip and the loss of light are obtained. It showed a regular change; the measurement value is reasonable and credible.
(2) The structure shows that optical fiber sensing is very sensitive, and the loss value is 30 to 50dB. The dynamic range of rock slide monitoring fiber is 3 to 3.5mm, and the dynamic range of the interface slip monitoring fiber is 1.6mm.
7
References
[1]Chapeleau X, Blanc J, Hornych P, et al. Assessment of cracks detection in pavement by a distributed fiber optic sensing technology. Journal of Civil Structural Health Monitoring, 2017, vol. 7(2), pp. 1-12.
[2]Piao, C., Yuan, J., Shi, B., Lu, H., Wei, G., & Gu, C. Application of distributed optical fi-ber sensing technology in the anomaly detection of shaft lining in grouting. Journal of Sen-sors, 2015, vol. 1, pp. 1-8.
[3]Rajan, G., Shouha, P., Ellakwa, A., Bhowmik, K., Xi, J., & Prusty, G. Evaluation of the physical properties of dental resin composites using optical fiber sensing technology. Den-tal Materials, 2016, vol. 32(9), pp. 1113-1123. https://doi.org/10.1016/j.dental.2016.06.015 [4]Giannoccaro, N. I., Massaro, A., Spedicato, L., & Lay-Ekuakille, A. Detection analysis of
small notches damages using a new tactile optical device. IEEE/ASME Transactions on Mechatronics, 2015, vol. 20(1), pp. 313-320. https://doi.org/10.1109/TMECH.2014. 2301638
[5]Su, H., Yang, M., Zhao, K., & Wen, Z. Blind source separation model of earth-rock junc-tions in dike engineering based on distributed optical fiber sensing technology. Journal of Sensors, 2015, pp. 1-6. https://doi.org/10.1155/2015/281538
[6]Barrias, A., Casas, J. R., & Villalba, S. A review of distributed optical fiber sensors for civil engineering applications. Sensors, 2016, vol. 16(5), pp. 748. https://doi.org/10.3390/ s16050748
[7]Masoudi, A., & Newson, T. P. Contributed review: distributed optical fibre dynamic strain sensing. Review of Scientific Instruments, 2016, vol. 87(1), pp. 111-112. https://doi.org/10.1063/1.4939482
[8]Lim, K., Wong, L., Chiu, W. K., & Kodikara, J. Distributed fiber optic sensors for moni-toring pressure and stiffness changes in outofround pipes. Structural Control and Health Monitoring, 2016, vol. 23(2), pp. 303-314. https://doi.org/10.1002/stc.1771
[9]Tejedor, J., Macias-Guarasa, J., Martins, H. F., Pastor-Graells, J., Corredera, P., & Martin-Lopez, S. Machine Learning Methods for Pipeline Surveillance Systems Based on Distrib-uted Acoustic Sensing: A Review. Applied Sciences, 2017, vol. 7(8), pp. 841. https://doi.org/10.3390/app7080841
[10]Lomotowski, G., & Bere!-Pawlik, E. A method of measuring moving element displace-ments in micro-hydraulic valves with the use of optical fibers. Journal of Theoretical and Applied Mechanics, 2014, vol. 52(3), pp. 781-791.
8
Authors
Xiaoma Dong and Liqiang Zhou are with ZheJiang Industry Polytechnic College, ShaoXing, 312000, China.