Role of charcoal addition on infiltration processes and soil water
content characteristics of a sandy loam soil
Karolina Villagra-Mendoza
1*, Edgar Ortiz-Malavassi
2, Ralf Otterpohl
3 (1. School of Agricultural Engineering, Instituto Tecnológico de Costa Rica, 30102, Cartago, Costa Rica;2. School of Forestry, Instituto Tecnológico de Costa Rica, 30102, Cartago, Costa Rica;
3. Institute of Wastewater Management and Water Protection, TUHH-Hamburg University of Technology, 21073, Hamburg, Germany)
Abstract: Terra preta (TP) is a soil amendment which is enriched with powdered charcoal, with nutrient sources from organic residues, and that constitutes a resource to improve soils for sustainable land use systems (Glaser, 2007). Terra preta-dark soil is inspired by the highly successful historic practice of soil building in the Amazon and other parts of the world. This work involves a relatively unexplored topic: the comprehension of infiltration processes and soil water content characteristics in a sandy loam soil combined with different fractions of terra preta amendments. This analysis contributes to a better understanding of the relationship between fractions of charcoal in terms of terra preta content and soil water holding capacity. First, a physical and hydraulic characterization was performed on soil samples with different charcoal content. Then, they were exposed to a rain simulation experiment under controlled conditions. A descriptive statistical analysis was applied for a quantitative evaluation of the results. It was found that as the fraction of terra preta increased, infiltration and percolation rates decreased, but water holding capacity increased. This can influence water ponding at the surface, leading to runoff formation. However, the effect on water holding capacity is an opportunity, integrated to other sustainable practices, to overcome drought effects and reduce the need for irrigation.
Keywords: charcoal, infiltration, sandy loam, sustainable farming, terra preta, water holding capacity
Citation: Villagra-Mendoza, K., E. Ortiz-Malavassi, and R. Otterpohl. 2017. Role of charcoal addition on infiltration processes and soil water content characteristics of a sandy loam soil. Agricultural Engineering International: CIGR Journal, 19(1): 9–15.
1 Introduction
Land degradation reduces soil productivity, disrupts
water renewal and does often cause poverty and even
famine. Drylands are expanding and it is expected that
they will cover half of the global land surface by the end
of the century (Huang et al., 2016). Many dryland regions
such as Mediterranean areas, Africa, China, Asia, and
South America are the most sensitive facing climate
change and are prompt to suffer soil desertification and
degradation in the near future. Therefore, there is a need
to look for sustainable farming practices aimed to water
and soil conservation.
Received date: 2016-04-01 Accepted date: 2017-01-16
* Corresponding author: Karolina Villagra-Mendoza, School of Agricultural Engineering, Instituto Tecnológico de Costa Rica, 30102, Cartago, Costa Rica. Email: kvillagra@itcr.ac.cr. Tel: (506)2550-2876, Fax: (506)2550-2271.
In the Amazonian region, black and very fertile soils of anthropogenic origin known as “terra preta” have been studied. These soils are rich in charcoal content, and other
nutrients such as nitrogen, phosphorus, potassium, and
calcium (Glaser et al., 2001; Nadejda et al., 2012). Terra
preta was originally produced by incorporating large
amounts of burned residues into the soil together
with nutrient-rich materials such as human and animal
manure (rich in phosphorus and nitrogen), mammal and
fish bones (rich in phosphorus and calcium), ash residues
or plant biomass such as biomass wastes, compost, algae,
etc. (Glaser, 2007). This mix eventually turns into a
substrate which typically contains 70 times more charcoal
and three times more soil organic matter, nitrogen, and
phosphorous than untreated soils (Glaser, 2007). The
formation of this amendment is self-regenerative and
when inserted in degraded soil, it can remain stable for a
terra preta is a resource for sustainable land management,
by contributing to the restitution of organic matter and
other essential nutrients in degraded soils (Glaser, 2007).
The practice of converting biowaste into Terra preta can
also play an important role in returning what remains of
food and fodder into soil (Factura et al., 2010).
Previous studies have focused on chemical and/or
biochemical characteristics of terra preta soils, with
emphasis, for example,on nutrient content and availability,
ion exchange, and structural stability (Lima et al., 2002;
Glaser et al., 2002; Glaser, 2007; O´Grady and Rush,
2007; Ferreira Cunha et al., 2009; Novotny et al., 2009).
Some studies have found a positive correlation between
soil organic matter and soil properties such as water
retention, available water holding capacity, and structural
stability (Glaser et al., 2002). Also, macro porosity, total
porosity, and saturated hydraulic conductivity increase
with higher organic matter content (Mbagwu, 1989). A
study of charcoal addition to soils with different textures,
made by Tryon in 1948, showed that on coarse textures
(e.g. sand) the soil water retention was improved in
comparison to loamy and clayey soils, which presented
no changes in soil water retention with charcoal
addition (Glaser et al., 2002). Effects of incorporating
compost on soil physical characteristics have also been
studied (Aggelides and Londra, 2000; Khan Eusufzai and
Fujii, 2012; Whelan et al., 2013). Incorporation of
organic matter in the form of compost has shown to
improve soil hydraulic properties such as hydraulic
conductivity, macro porosity, and water retention.
Aggelides and Londra (2000) claimed different degrees
of improvement depending on soil textures. For instance,
soil properties in loamy soils were better in comparison to
those in clayey soils for an equal amount of added
compost. These authors reported a decrease of up to 20%
on soil density and an increase up to 30% on total
porosity for loamy soils. In the case of clayey soils, the
increase on total porosity was below 10%. Saturated
hydraulic conductivity increased up to 95% and 168% in
loamy and clayey soils, respectively. Wang et al. (2009)
claimed a negative correlation between the hydraulic
conductivity and organic matter content in coarse soils,
which suggests that a reduced ability of wetting in sandy
soils occurs due to its un-aggregated structure.
The objective of this work is to contribute to the
understanding of water dynamics in a sandy loam soil
with added charcoal, i.e., sandy loam soil combined with
different fractions of terra preta amendment. A
descriptive statistical analysis is presented, where water
content dynamics, infiltration characteristics, and water
holding capacity are compared for soil samples with
different fractions of terra preta, compost (based on
household waste), and a pure sandy loam soil.
2 Materials and methods
When water enters in contact with the soil-
represented as soil moisture θ from either rainfall or irrigation important processes take place that influence
changes in the soil water content (dθ/dt). Infiltrated water
(Inf) penetrates through the soil surface and becomes part
of the water content of the soil; interflow (Intf) moves
parallel to the surface into the first layers under
unsaturated soil conditions; percolation (Perc) moves
deeper into the lower soil layers; evapotranspiration (Eva)
generates a loss of moisture from the direct surface; and
capillary uprise (CU) increases soil moisture through the
upward movement of fluids by capillarity. All these
processes are summarized in the well-known water
balance Equation (1):
( ) [ ( ) ( )] ( ) ( )
d
Inf t Intf t Perc t Eva t CU t
dt
(1)
In this work, evapotranspiration and capillary uprise
effects were minimized in the experimental setup and
assumed zero in the analysis. Infiltration was calculated
by Equation (1), and soil water content and percolation
were measured with the following procedure.
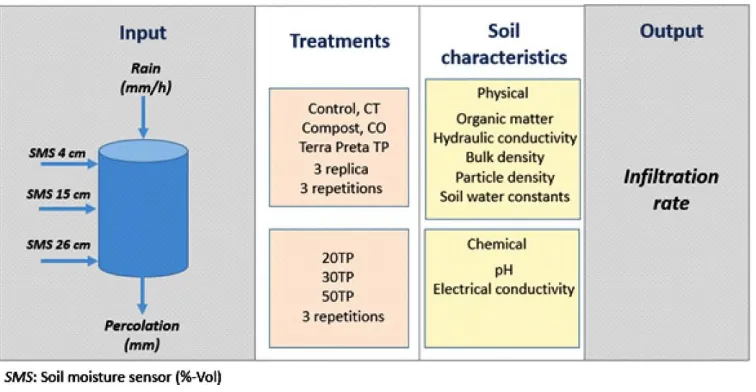
The soil and amendments used for the experiments
were classified in two groups. Group I consisted of three
blocks, each block containing three cylinders filled with
different treatments: sandy loam (defined as control, CT),
compost (based on household waste with 10% charcoal,
CO), and terra preta (identified as TP). Averaged rain
intensities of 22 mm h-1 were simulated in this case.
Group II, consisted of three blocks with cylinders filled
with the same sandy loamy soil and three different
sandy loam (20 TP), 30% terra preta and 70% sandy loam
(30 TP), 50% terra preta and 50% sandy loam (50 TP).
Averaged rain intensities of 15 mm h-1 were simulated for
group II samples. Soil and amendments were packed in
cylinders with a height of 30 cm and a diameter of 20 cm.
The analysis of variance was performed following the
experimental design of split plots in space and time:
evaluation of soil moisture for different fractions of terra
preta amendment soil (factor A), with three different soil
depths (factor B) for a rainfall simulation period (factor C)
(Figure 1).
Figure 1 Representation of the experimental procedure Three soil moisture sensors were installed (in each
packed cylinder) 4, 15, and 26 cm depth. Soil moisture
was registered every 3 s before, during, and after the rain
simulation event. Percolation was collected at 5 min
intervals and the water column height, at the surface, was
measured with the same time interval as percolation.
A physical characterization of the soil samples was
carried out in order to support the experimental analysis.
Samples for bulk density were weighted before and after
drying at 105°C for 24 h. The dimensions of the cylinders
used to take the samples had a height and diameter of
50 mm (DIN 18125-1, 2010). For organic matter, samples
were dried at 105°C for 24 h, pulverized with a mortar,
and weighted before and after heating up to 550°C for a
period up to reach a constant weight, according to the
norm [DIN 18128, 2002]. Soil moisture retention was
obtained by the suction-plate method, following the norm
(ASTM D2325-68, 2000; ASTM D6836-02, 2008).
Electrical conductivity (EC) and pH were measured
for the amendment soils (CO, TP, 20TP, 30TP and 50TP),
according to (ASTM-D4972, 2013), in order to
corroborate soil stability. The pH was neutral for all
treatments and EC ranged from 0.05 up to 0.34 dS m-1 as
terra preta fraction increased.
The non-parametric Kruskal Wallis test and the
parametric analysis of variance of the soil moisture -for
the treatments CT, CO, TP, 20TP, 30TP and 50TP were
carried out with a significant test level of 0.05. The
statistical software R (R-project, 2015) was used for the
descriptive analysis of the soil water content of all
treatments.
3 Results and discussion
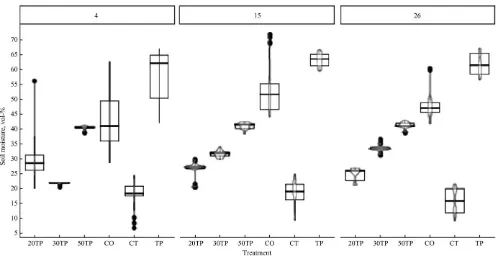
The soil moisture data distribution at three different
depths is shown in Figure 2. As organic matter content
increases by the addition of terra preta amendment soil,
soil water content not only increases, but also presents
less variation of the soil moisture distribution. In Figure 2,
the control treatment (sandy loam, CT) displays the
lowest median soil moisture values at all depths, whereas
the terra preta (TP) treatment shows the highest ones.
Treatments 20TP, 30TP and 50TP show the narrowest
soil moisture distribution. Outliers at the bottom bound
indicate that the initial soil water conditions were below
field capacity at the beginning of the experiment. Outliers
at the top bound indicate saturated soil conditions at the
end of the experiment. For most treatments during the
near wilting point up to saturation. At a depth of 26 cm,
medians tend to stay slightly higher with respect to field
capacity values. This is attributed to a delayed percolation
in presence of organic matter.
Figure 2 Blox-plot for median comparison of all treatments showing soil moisture data distribution at three different depths Some treatments showed a higher variation of the soil
moisture distribution at the surface and at the center of
the soil profile. The rain impact near to the surface is
linked to a relatively high soil moisture variation for all
treatments.
As terra preta was added to the sandy loam soil, soil
moisture constants increase (Table 1) and median values
of treatments 20TP and 30TP move towards the high
bound of CT. Before starting the rainfall simulation, all
treatments were set to soil moisture values close to
wilting point. After experiments were performed, soil
moisture values for treatments 20TP and 30TP tend to
move higher than field capacity.
Table 1 shows that the available water content,
obtained by the suction-plate method for treatments CT
and with different fractions of terra preta (20TP, 30TP,
50TP). For the treatments of Compost (CO) and Terra
Preta (TP), soil water content was measured directly in
the packed soil cylinders using soil moisture sensors due
to their particle composition. As the fraction of terra preta
increases, intervals between wilting point and field
capacity increase slightly improving water available for
plants.
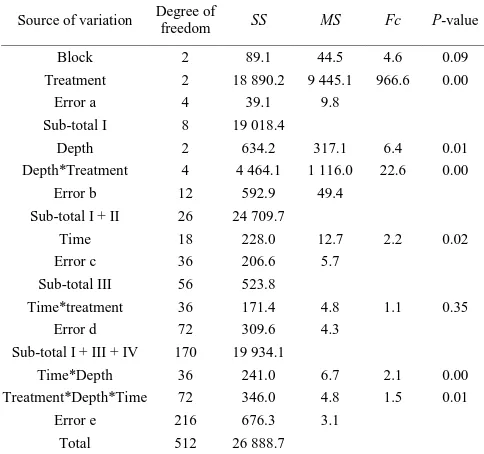
Since there is evidence of a non-normality
distribution of the residuals and heterogeneous variance
of the treatments, the non-parametric Kruskal Wallis test
was used to analyze the variance (Table 2). With a
p-value lower than 0.05, the median ranks of the soil
water content between treatments are significantly
different. Tables 3 and 4 show the results of the
parametric analysis of variance (ANOVA) for the soil
moisture for the treatments CT, CO, TP, and 20TP, 30TP,
50TP, respectively. Both parametric and non-parametric
tests provide similar results in terms of differences of the
soil water content between treatments; therefore, the
parametric analysis is chosen for further difference
analysis, mainly due to its robustness.
Table 1 Soil moisture constants for the studied treatments obtained by the suction-plate method
Treatment
Available moisture, vol-%
Saturated soil moisture, vol-% (0.0 pF*)
Field capacity, vol-% (2.54 pF1)
Wilting point, vol-% (4.2 pF1)
Control2 5 47 19 14
Compost3 10 53 43 33
Terra Preta3 3 63 60 57
20TP2 12 58 26 14
30TP2 14 63 29 15
50TP2 16 69 40 24
Note: 1pF stands for units of y-axis of the soil retention curve, pF=0.0~.001 bar,
pF=2.54~0.33 bar and pF=4.2~15 bar; 2water content values obtained with
pressure plates; 3water content values obtained directly in the soil packed
Table 2 Kruskal Wallis test for the analysis of variance for the soil moisture (95% of confidence)
Treatment N Median Ave. rank
20TP 171 26.56 241.4 30TP 171 31.29 296.9 50TP 171 40.85 541.0 CT 99 11.92 59.3 CO 9 46.57 642.3 TP 99 62.48 749.2 Overall 809 405.0
H=711.47 DF=5 P=0.000
Note: N: number of elements; Median: median values of soil moisture; Ave rank: averaged rank of data from all groups; DF: degree of freedom; H: test statistics,
P: p-value.
Table 3 Analysis of variance (ANOVA) of the soil moisture for the treatments CT, CO and TP (95% of confidence)
Source of variation Degree of
freedom SS MS Fc P-value Block 2 2 241.8 1 120.4 6.3 0.06 Treatment 2 118 345.4 59 172.7 334.6 0.00
Error a 4 707.3 176.8 Sub-total I 8 121 293.6
Depth 2 1 031.0 515.5 3.1 0.08 Depth*Treatment 4 3 180.3 795.1 4.8 0.02
Error b 12 1 985.7 165.5 Sub-total I + II 26 127 490.6
Time 10 998.6 99.9 12.9 0.00 Error c 20 153.7 7.7
Sub-total III 32 3 393.1
Time*treatment 20 83.2 4.2 0.7 0.83 Error d 40 250.1 6.2
Sub-total I + III + IV 98 122 779.1
Time*Depth 20 740.9 37.0 8.4 0.00 Treatment*Depth*Time 40 162.8 4.1 0.9 0.60
Error e 120 527.3 4.4 Total 296 130 407.1
Note: SS: sum of squares; MS: mean squares; Fc: test statistics.
Table 4 Analysis of variance (ANOVA) of the soil moisture for the treatments 20TP, 30TP and 50TP (95% of confidence)
Source of variation Degree of
freedom SS MS Fc P-value Block 2 89.1 44.5 4.6 0.09 Treatment 2 18 890.2 9 445.1 966.6 0.00
Error a 4 39.1 9.8 Sub-total I 8 19 018.4
Depth 2 634.2 317.1 6.4 0.01 Depth*Treatment 4 4 464.1 1 116.0 22.6 0.00
Error b 12 592.9 49.4 Sub-total I + II 26 24 709.7
Time 18 228.0 12.7 2.2 0.02 Error c 36 206.6 5.7
Sub-total III 56 523.8
Time*treatment 36 171.4 4.8 1.1 0.35 Error d 72 309.6 4.3
Sub-total I + III + IV 170 19 934.1
Time*Depth 36 241.0 6.7 2.1 0.00 Treatment*Depth*Time 72 346.0 4.8 1.5 0.01
Error e 216 676.3 3.1 Total 512 26 888.7
Note: SS: sum of squares; MS: mean square; Fc: test statistics.
From Tables 3 and 4, the significant differences of the
soil moisture between treatments; and treatment and
depths, are further analyzed, using Figure 1. The t-student
test (with α/2) and the standard error were used for
determination of the confidence intervals for mean
moisture values.
Figure 2 depicts the differences of soil moisture in
three different depths (4, 15, and 26 cm). At 4 cm, there
are significant differences between treatments, ranging
from lower soil moisture values in treatment CT to higher
moisture values for treatment TP. Most of the treatments
tend to keep similar moisture conditions between depths
of 15 and 26 cm, evidencing a slow water movement
down, product of a slow percolation rate. An exception is
observed for treatment CT where moisture decreases
slightly at 26 cm.
The violin plot in Figure 2 also provides information
of the soil moisture distribution for the treatments at three
different depths. The width at each point represents the
frequency of the soil moisture. At 4 cm-depth all
treatments show a rapid movement of soil moisture from
dry values up to saturation. At a depth of 15 and 26 cm,
the treatments with sandy loam soil mixed with different
fractions of terra preta amendment soil (20TP, 30TP and
50TP) show more homogeneity and frequency of
moisture values near the median, than the other
treatments (CT, CO, TP). Bimodality, at 26 cm-depth for
treatments CT and CO, is more evident. This can be
influenced by percolation which initiates earlier (Table
5).
Table 5 shows that the obtained infiltration and
percolation rates, and maximum surface water depth.
Averaged initial soil moisture at field capacity was set for
all treatments. Simulated rainfall was configured at
relative low intensities in order to understand the
behavior of the soil water dynamics at low water input.
Time differences between peak infiltration and
peak-percolation were divided into two groups: group 1
(~20-30 min) conformed by CT, CO, and 20TP
treatments; and group 2 (~70-85 min and more) with
30TP, 50TP, and TP treatments. A higher fraction of terra
preta amendment, translates in a delayed initiation of
50TP treatments were 24%, 26%, and 44% less than the
rates observed for sandy loam soil (CT), respectively.
Peak percolation rates for 20TP, 30TP, and 50TP
correspond to 11%, 77%, and 38% less than the rate for
sandy loam, respectively. With regard to the water input
in group 1, although treatment 20TP was exposed to less
rain intensity than treatment CT, it had a similar
peak-percolation rate delayed by 10 min. Although CT
and CO had a similar time difference between
peak-percolation and peak-infiltration rate, the ratio
peak-percolation-rate: peak-infiltration-rate is higher for
CT, and even higher for 20TP. Therefore, with treatment
20TP water content percolates more and starts percolation
at similar time interval as the treatment CT. Treatment
30TP, in group 2, shows a small ratio
peak-percolation-rate: peak-infiltration-rate, initiating
percolation at 45 min and reaching a
peak-percolation-rate at 85 min. This treatment showed a
better water holding capacity than 20TP, although
maximum ponded rate was higher for treatment 30TP
than 20TP. Treatment 50TP shows a great delay for
initiation of percolation but also great accumulation of
water at the surface. As organic matter in terms of
content of charcoal increases, peak-ponding-rate
increases, as well as water holding capacity in terms of
percolation delay.
Table 5 Infiltration and percolation dynamics
Treatment TPI, min PIR, mm h-1 TPP, min PPR, mm h-1 PIn, min TD*, min TTP, min PPoR, mm In, mm h-1
CT 5 23.1 25 28.0 20 20 10 13.0 22 CO 5 24.0 30 5.0 30 25 15 12.2 22 TP 5 22.0 >90 0.0** >90 >85 10 21.6 22 20TP 5 17.6 35 25.0 20 30 10 7.2 15 30TP 5 17.0 85 6.4 45 80 10 18.9 15 50TP 25 13.0 95 17.3 70 70 10 18.0 15 Note: *Time difference is the difference between time to peak percolation and time to peak infiltration. ** Corresponds to the percolation rate during the rainfall event, percolation was observed hours after the rainfall event ended. TPI: Time to peak infiltration; PIR: peak infiltration rate; TPP: Time to peak percolation; PPR: Peak percolation rate; PIn: Percolation initiation; TD: Time difference; TTP: Time to ponding; PPoR: Peak ponded rate; In: Simulated rain intensity.
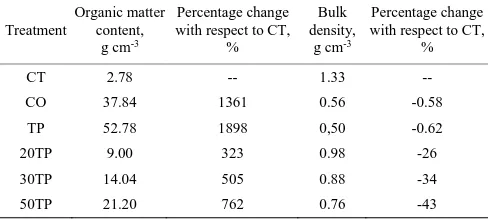
Table 6 summarizes the obtained values for organic
matter content and bulk density of the TP treatments with
respect to the reference CT treatment. Fractions from
20% up to 50% of terra preta increase organic matter
content from about 300% up to 760% and reduce bulk
density. The increase of organic matter enhance the water
holding capacity (effect observed in Table 5). The
enhancement of soil physical properties leads to better
plant grow conditions, however, it also depends on water
input. Large amount of water may induce to ponding at
the surface, which could be problematic due to soil
erosion if not combined with other countermeasures such
as good vegetation coverage.
Table 6 Organic matter content and bulk density
Treatment
Organic matter content,
g cm-3
Percentage change with respect to CT,
%
Bulk density,
g cm-3
Percentage change with respect to CT,
% CT 2.78 -- 1.33 -- CO 37.84 1361 0.56 -0.58 TP 52.78 1898 0,50 -0.62 20TP 9.00 323 0.98 -26 30TP 14.04 505 0.88 -34 50TP 21.20 762 0.76 -43
4 Conclusions
In this work, a descriptive statistical analysis was
performed in order to explore the water dynamics of
sandy loam soil samples mixed with different quantities
of charcoal as a terra preta amendment. Quantitative
information on how infiltration and percolation processes
behave was gathered. Experimental data show that soil
water retention improves as soil organic matter content
increases. Treatment 30TP has a better percolation:
infiltration ratio than 20TP, and higher ponded depth. If
combined with best farming practices such as vegetation
cover, treatment 30TP could give a solution to a better
water holding capacity.
Increase of charcoal, as terra preta amendment, of a
mineral soil (sandy loam with 2.78% of organic matter
content) reduces surface infiltration and percolation rates.
As the organic matter content increases, time-to-peak
percolation appears later in time, even long after the
rainfall event ended. Slower infiltration rates increase
formation. Nonetheless, low percolation rates enhance the
soil water holding capacity, since the water displacement
to deeper soil layers takes place much slower.
Acknowledgements
The experimental study of this work was carried out
at the Institute of River and Coastal Engineering at the
Hamburg University of Technology (TUHH), Germany.
Special thanks to the Laboratory of Geotechnics, at the
TUHH, for the support on the analysis of the physical and
hydraulic soil parameters. This work received funding
from the IPSWaT Program supported by the Ministry of
Education and Research (BMBF) of Germany.
References
Aggelides, A. M., P. A. Londra. 2000. Effects of compost produced from town wastes and sewage sludge on the physical properties of a loamy and clay soil. Bioresource Technology, 71(3): 253–259.
ASTM D6836-02. 2008. Standard test methods for determination of the soil water characteristic curve for desorption using a hanging column, Pressure Extractor, Chilled Mirror Hygrometer, and/or Centrifuge. United States: ASTM International.
ASTM D2325-68. 2000. Standard test method for capillary-moisture relationships for coarse- and medium-textured Soils by porous-Plate Apparatus. United States: ASTM International.
ASTM-D4972. 2013. Standard test method for pH of soils. United States: ASTM International.
DIN 18125-1 (Deutsches Institut für Normung e.V.). 2010. Baugrund, Untersuchung von Bodenproben-Bestimmung der Dichte des Bodens-Teil 1: Laborversuche. (Foundation, study of soil sample - for the determination of soil density-part 1: Laboratory test). Germany: Beuth Verlag..
DIN 18128 (Deutsches Institut für Normung e.V.). 2002. Baugrund, Untersuchung von Bodenproben-Bestimmung des Glühverlustes (Foundation, study of soil sample - for the determination of loss on ignition) . Germany : Beuth Verlag. Factura, H., T. Bettendorf, C. Buzie, H. Pieplow, J. Reckin, and R.
Otterpohl. 2010. Terra Preta sanitation: re-discovered from an ancient Amazonian civilisation. Water Science & Technology, 61(10): 2673–2679.
Cunha, T. J. F., B. E. Madari, L. P. Canellas, L. P. Ribeiro, V. D. M. Benites, and G. D. A. Santos. 2009. Soil organic matter and fertility of anthropogenic dark earths (Terra Preta do Índio) in the Brazilian Amazon basin. Revista Brasileira De Ciencia
Solo, 33(1): 85–93.
Glaser, B., L. Haumaier, G. Guggenberger, and W. Zech. 2001. The “Terra Preta” phenomenon: a model for sustainable agriculture in the humid tropics. Naturwissenschaften, 88(1): 37–41.
Glaser, B., J. Lehmann, and W. Zech. 2002. Ameliorating physical and chemical properties of highly weathered soils in the tropics with charcoal- a review. Biology and Fertility of Soils, 35: 219–230.
Glaser, B. 2007. Prehistorically modified soils of central Amazonia: a model for sustainable agriculture in the twenty-first century.
Philosophical Transactions of the Royal Society B Biological
Sciences, 362(1478): 187–196.
Huang, J., H. Yu, X. Guan, G. Wang, and R. Guo. 2016. Accelerated dryland expansion under climate change. Nature Climate Change, 6(2): 166–171.
Eusufzai, M. K., and I. K. Fuji. 2012. Effect of organic matter amendment on hydraulic and pore characteristics of a clay loam soil. Open Journal of Soil Science, 2(4): 372–381. Lima, H. N., C. E. R. Schaefer, J. W. V. Mello, R. J. Gilkes, and J.
C. Ker. 2002. Pedogenesis and pre-Colombian land use of ‘‘Terra Preta Anthrosols’’ (‘‘Indian black earth’’) of Western Amazonia. Geoderma, 110(1-2): 1–17.
Mbagwu, J. S. C. 1989. Effects of organic amendments on some physical properties of a tropical Ultisol. Biological Wastes, 28(1): 1–13.
Nadejda, A., M. García, C. Wendland, F. Klimek, M. Ronteltap, and P. Lens. 2012. A Concept for a sustainable sanitation chain based on the semi centralized production of Terra Preta for Moldova. In 4th International Dry Toilet Conference. Tampere Finland, 22-24 August.
Novotny, E. H., M. H. B. Hayes, B. E. Madari, T. J. Bonagamba, E. R. D. Azevedo, A. A. D. Souza, G. Song, C. M. Nogueira, and A. S. Mangrich. 2009. Lessons from the Terra Preta de Índios of the Amazon Region for the utilisation of charcoal for soil amendment. Journal of Brazilian Chemical Society, 20(6): 1003–1010.
O´Grady, R., and R. Rush. 2007. The Terra Preta phenomenon. Managing the Carbon Cycle. Workshop in Katanning. Australia, 21-22 March.
R-project. 2015. The R project for Statistical Computing. Available at: www.r.project.org.
Wang, T., D. Weding, and V. Zlotnik. 2009. Field evidence of a negative correlation between saturated hydraulic conductivity and soil carbon in a sandy soil. Water Resources Research, 45(7): 831–839.