Vibration spectroscopic technique for species identification based
on lipid characteristics
Gao Fei
,
Han Lujia
,
Liu
Xian
*(Biomass and Bioresource Utilization Laboratory, College of Engineering, China Agricultural University, Beijing 100083, China)
Abstract: Due to the widespread of adulteration of lipid in food and feed industry, the quality and safety of lipid are of public concern gradually. Firstly, the current article presents theory and mechanism of species identification of lipid by spectroscopic technique. Potential of near-infrared reflectance spectroscopy (NIR), Fourier transform infrared spectroscopy (FT-IR), and Fourier transform Raman spectroscopy (FT-Raman) applied to species identification of lipid were summarized. In addition, the relationship between lipid and spectroscopy as well as the recent advances of species identification of lipid were discussed. Research showed that FT-IR and FT-Raman spectroscopies possessed more efficient potential for species identification of lipid. Finally, prospects for future lipid detection and relative practical application, and combination of spectroscopy and other technique were further discussed.
Keywords: feedstuff, fatty acid, NIR, FT-IR, FT-Raman spectroscopy DOI: 10.3965/j.ijabe.20171003.3144
Citation: Gao F, Han L J, LiuX. Vibration spectroscopic technique for species identification based on lipid characteristics. Int J Agric & Biol Eng, 2017; 10(3): 255–268.
1 Introduction
In recent years, the adulteration of lipid has been widespread in the food and feed industry[1]. Replacing higher value oil with lower grade, cheaper, and more easily available substitutes not only affect the quality and the commercial value of oil-based products but cause the health problems to customer[2]. Meanwhile, devious food producers would obtain huge economical profits by unfair competition[2-4]. Besides, mixing animal fats into vegetable sources also concern to certain groups of consumers due to religious obligations and health complications[1]. For instance, the consumption of food products containing lard is prohibited for Muslim
Received date: 2016-12-02 Accepted date: 2017-03-12 Biographies: Gao Fei, PhD candidate, research interest:
agriculture engineering, Email: [email protected]; Han Lujia, PhD, Professor, research interest: agriculture engineering, Email: [email protected].
*Corresponding author: Liu Xian, PhD, Assistant Professor,
research interest: agriculture engineering. College of Engineering, China Agricultural University, P. O. Box 190, 17 Qinghua Donglu, Beijing 100083, China. Tel: +86 10 62738546, Fax: +86 10 62736778; Email: [email protected].
composition to that of the original oil and fat.
In recent years, the common methods for detecting adulteration in oil and fat are gas chromatography[7,8], high-performance liquid chromatography[9], polymerase chain reaction[10], electronic nose[11], and differential scanning calorimetry[12]. Although above methods have been proved suitability and accuracy for identification, they are time-consuming and need technical expertise[13]. Therefore, spectroscopy methodology as non-destructive, fast and reliable analytical technique is expected to overcome such problems, especially in combination with chemometrics techniques[14,15].
The vibrational spectroscopy, including infrared spectroscopy (IR) and Raman spectroscopy techniques, is an emerging analytical technique to make qualitative or quantitative analysis of oil and fat[16-18]. Those spectral technologies possess the advantage of simplicity and rapidity of sample preparation as well as the relatively cost effective. Bands at specific frequency in IR and Raman spectra are characteristics of functional groups that constitute the components in samples. The IR spectrum is obtained by a change in the molecular dipole moment during vibration, while the Raman spectrum is obtained by a change in polarizability during the vibration[19,20]. For instance, the C=O and O–H stretching, polar functional groups, have strong absorption in the IR spectrum, while the C=C stretching, non-polar functional group, has strong Raman scattering in Raman spectra. Therefore, IR and Raman spectra represent a combined fingerprint pattern unique to each substance and were used for discriminated analysis[21].
The compositions of lipid present were mainly triglycerides and fatty acids, which performed distinctly different characteristics, such as carbon-chain length, composition of side chain, and the degree of unsaturation of fatty acids, which can be well reflected in vibrational spectra. Therefore, authentication and discrimination lipid using vibrational spectroscopy was reliable and valid detection method. In the present study, potential of near-infrared reflectance spectroscopy (NIR), Fourier transform infrared spectroscopy (FT-IR) and Fourier transform Raman spectroscopy (FT-Raman) applied to species identification of lipid were summarized. In addition, the relationship between lipid and spectroscopy
as well as recent advances of species identification of lipid were discussed. Future prospects for improving vibrational spectroscopic techniques based on lipid characteristics for species identification are further discussed.
2 Theory and mechanism of vibration
spectroscopic technique
The interactions of electromagnetic radiation with molecules give rise to several spectroscopic techniques based on absorption, emission or scattering processes. NIR and mid-infrared (MIR) spectroscopies are based on absorption, while Raman spectroscopy is based on scattering process. The difference between infrared and Raman spectroscopies are shown in Table 1. Infrared and Raman spectroscopies imply the discrete vibrational transitions that occur in the electronic ground state of molecules[22].
Table 1 Difference between infrared and Raman spectroscopies[16,19,21]
Raman spectroscopy Infrared spectroscopy
Similarity
The infrared absorption wavenumber of chemical groups are exactly the same with Raman displacement, both of them are in the infrared spectral region, and all reflect the molecular structure information.
Mechanism
A change of polarizability of the electron distribution the molecular vibration
A change of the intrinsic dipole moment with the molecular vibration Incident light Visible light Infrared light
Detected light Scattering Absorption
Group band Nonpolar group Polar group
Sample preparation Direct detection KBr tablet/Direct detection
that functional groups have strong and narrow absorption bands in the MIR region but very broad and weak absorbance in the NIR region. Therefore, NIR spectroscopy is more commonly used for quantitative analysis while MIR spectroscopy, on the other hand, is more commonly used for qualitative analysis. Furthermore, Fourier transformation is a mathematical algorithm used to decode the interferogram and to obtain interpretable information about individual frequencies. The dispersive element of conventional infrared technique is replaced by Michelson interferometer. The interferometer encodes the incident frequencies, which are converted into a sinusoidal signal, of which is characteristic of each wavelength. Namely, FT-IR spectrometers have significant advantages over dispersive-type instruments[23].
Another branch of vibrational spectrometry is Raman spectrometry which, like infrared spectrometry, provides information about vibrations of molecules. In order to get Raman spectra, a laser emitting at a defined frequency is used to send a large quantity of photons to sample. Most of photons are scattered at the same frequency as the laser source (named as the Rayleigh phenomenon), but a small fraction interacts with the molecules making up the sample and is scattered at shifted frequencies (this is called Raman phenomenon). Therefore, Raman spectroscopy measure photons scattered at shifted
frequencies and provide spectra, including the scattering bands observed at the different Raman shifts and characteristics of samples[24,25].
3 Potential of lipid characteristics for species
identification
Lipid, composed of triglycerides and fatty acids, has distinct differences in composition, such as carbon-chain length, composition of side chain, cis/trans geometrical isomer ratio, and the degree of unsaturation of fatty acid[26]. Lipid property mainly depends on fatty acid that is compound of carbon, hydrogen and oxygen, etc. According to length of carbon-chain, fatty acids were separated into short-chain fatty acid (SCFA), medium-chain fatty acid (MCFA) and long-chain fatty acid (LCFA). While in accordance with saturation or unsaturation of carbon-chain, fatty acids were classified into unsaturated fatty acid (UFA), monounsaturated fatty acid (MUFA), and PUFA. On the basis of the position of hydrogen atom on carbon-chain, fatty acids were divided into cis- fatty acids and trans- fatty acid. Many previous research indicated that the kind, content and composition of fatty acids from different lipid sources were diverse, which possess huge potential for species discrimination[27-30]. The typical lipid vibrational spectra of NIR, FT-IR and FT-Raman were depicted in Figure 1[29].
NIR spectrum is plotted as absorbance versus wavelength (nm); FT-IR spectrum is plotted as absorbance versus wavenumber (cm-1); FT-Raman spectrum is plotted as Raman intensity versus Raman shift (cm-1). For instance, cis –CH=CH- stretching vibration, -CH2 symmetric stretching vibration and -CH2 bending (scissoring) vibration were presented obviously in both FT-IR and FT-Raman spectra. While, -COO, C=O stretching vibration showed strong intensity in FT-IR and weak intensity in FT-Raman; intensity of cis
C=C stretching vibration were weak in FT-IR and strong in FT-Raman. Therefore, species discrimination based on lipid characteristics using vibrational spectroscopy performed theoretical feasibility. More detail information of functional group describing molecular vibration was discussed in next chapter.
4 Vibration spectroscopic technique for
species identification based on lipid
With respect to vibrational spectroscopy, NIR, FT-IR and FT-Raman spectroscopies display certain advantages that make those techniques more attractive as alternatives to traditional and time-consuming analytical methods. It has been reported that NIR, FT-IR and FT-Raman in combination with multivariate analysis could successfully discriminate different lipids even adulterated with other chemically similar lipids[24,31-37]. In the following sections, the main characteristics and applications of different vibrational spectroscopic techniques about qualitative and quantitative analysis of lipid are described respectively, especially discrimination techniques and methods.
4.1 Technique and methodology of NIR
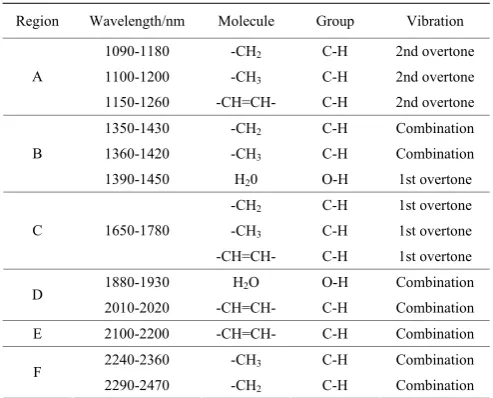
Near-infrared spectrum is the result of light absorption by different molecules and presents various overlapped peaks. Table 2 shows the assignment of the major NIR absorption bands of lipid gathered from previous papers[22,38-44]. There are some examples to illustrate characteristic region which can discriminate oil and fat from different origins. Region A (1100-1300 nm) is characteristic of the second overtone of C–H stretching vibration of various chemical groups (–CH2, –CH3, –CH=CH–). The bands near 1180 nm have been
described as the second overtone of the fundamental C–H absorption of pure fatty acids containing cis double bonds[39]. It is also reported by Hourant et al.[45] that oil rich in polyunsaturated fatty acids or monounsaturated fatty acids presented higher absorption in the vicinity of 1164 nm than fat rich in saturated fatty acids.
Table 2 Assignments of the major near-infrared absorption bands of lipid spectrum
Region Wavelength/nm Molecule Group Vibration
1090-1180 -CH2 C-H 2nd overtone
1100-1200 -CH3 C-H 2nd overtone
A
1150-1260 -CH=CH- C-H 2nd overtone
1350-1430 -CH2 C-H Combination
1360-1420 -CH3 C-H Combination
B
1390-1450 H20 O-H 1st overtone
-CH2 C-H 1st overtone
-CH3 C-H 1st overtone
C 1650-1780
-CH=CH- C-H 1st overtone
1880-1930 H2O O-H Combination
D
2010-2020 -CH=CH- C-H Combination
E 2100-2200 -CH=CH- C-H Combination
2240-2360 -CH3 C-H Combination
F
2290-2470 -CH2 C-H Combination
Another important region C (1600-1850 nm) shows two main bands in the vicinity of 1722 nm and 1760 nm. They are characteristics of the first overtone of the C–H stretching vibration of methyl, methylene, and ethylene groups. This region of NIR spectra have been studied by numerous authors. Holman and Edmondson[46], working on pure fatty acids and triglycerides, attributed the strong bands near 1740 nm and 1770 nm to the C–H vibration of CH2 groups, while Cho and Iwamoto[47] correlated the absorption bands at 1710 nm and 1725 nm to linoleic and oleic acids. Later, Sato et al.[39] observed that both saturated and trans-unsaturated triglycerides have their maximum peak near 1725 nm and 1760 nm. Hourant et al.[45] also observed, in the vicinity of 1715 nm, the decreasing values of absorbance show the order which can be explained by the degree of unsaturation. The oils rich in polyunsaturated fatty acids have a peak centered at lower frequency (1720-1722 nm) than oils rich in monounsaturated fatty acids (1724 nm) or fats rich in saturated fatty acids (1726 nm).
vibration with other vibrational modes. In this area, all peaks of edible oil or fat spectrum are related to absorption bands of fatty acids with cis double bonds[46]. The absorption intensity at these wavelengths increases with the degree of total unsaturation. The last part of spectrum, region F (2230-2500 nm), contains two intense absorption bands near 2304 nm and 2344 nm, respectively. This part is characteristic of the combination of C–H stretching vibration with other vibrational modes.
The NIR has been widely applied to rapid quantitative and qualitative determination of lipid products[45,48-51]. In previous researches, Wetzel[52] investigated the relationship between oil structure, for example, solid-fat index, degree of unsaturation and carbon number in triglycerides with NIR responses. He correlated carbon number to three major response bands at 1680 nm, 2139 nm and 2208 nm and established relationship between lipid structure and NIR spectroscopy. Sato et al.[39] developed foundation for rapid determination of fatty acid composition in fats and oils by NIR spectroscopy. Garrido-varo et al.[50] researched NIR spectra of animal fat by-products, especially feed ingredient grade fat and oil, contained relevant information related to their animal species. We also found in Garrido-varo et al.[50] research, small shifts in wavelengths and absorbance value had been observed between different fats and oils in NIR spectroscopy. Fish oil spectra showed maximum near 1714 nm, while animal fat spectra appeared to be located around 1724 nm and 1726 nm. Soybean oil and olein appeared in the middle about 1700-1722 nm.
In order to extract more chemically relevant information from NIR spectra and construct calibration model, NIR, in combination with preprocessed methods and chemometrics approaches, has also been used to determine authenticity of various oil and fat[43,51]. When necessary, NIR signals are smoothed to remove noise using Savitzky-Golay filter[53]. In order to reduce overlapping peak and linear baseline drift, first and second derivative spectra are employed by Savitzky-Golay differentiation filter. Undesired effect related to multiplicative interference of scatter and
particle size can be eliminated with standard normal variate transformation (SNV); curvilinear and baseline shift variations with detrending approach[54]. More details about preprocessing techniques applied to NIR data can be found in references[55,56]. As to chemometrics approaches, Sato[39] used principal component analysis (PCA) on NIR spectroscopic data for classification of vegetable oils: soybean, corn, cottonseed, olive, rice bran, peanut, rapeseed, sesame, and coconut oils. Bewig et al.[38] achieved differentiation between four vegetable oils (cottonseed, peanut, soybean, and canola) and classification of unknown samples in which second derivative spectra of oils were subject to discriminate analysis with Mahalanobis distances principles. Wesley et al.[57] developed a method for predicting the level of adulteration in a set of virgin and extra virgin olive oils adulterated with corn oil, sunflower oil, and raw olive residue by PCA. They also used NIR spectroscopy and discriminant analysis to identify and quantitate adulterants in extra virgin olive oils[58].
From the above-mentioned results, fat content can be successfully evaluated because some characteristic wavelengths associated with lipid exist in NIR region. Besides, using NIR technology could successfully measure the level of adulteration with chemometrics, but more work is required to give an acceptable level of accuracy. For instance, enlarging sample bank and spectral libraries with well authenticated samples in order to increase the robustness and applicability of quantitative and qualitative NIR models[13,19,27,59,60].
4.2 Technique and methodology of FT-IR
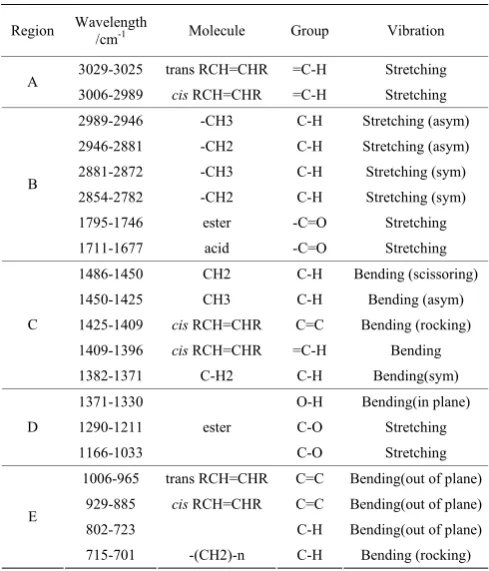
in the region of 3100-1700 cm-1, and overlapping peaks in the fingerprint region from 1500 cm-1 to 700 cm-1. MIR region of electromagnetic spectra contain mainly fundamental vibration bands where the vibration results in a change in the dipole moment of the molecule. From high to low wavenumbers, a group of bands from C-H stretching vibration were at around 3000 cm-1; near 1745 cm-1, there was a single peak from the C=O stretching vibration; a bending vibration band from CH2 and CH3 groups were in 1400-1200 cm-1 region; and in the range 1125-1095 cm-1, bands characteristic of the stretching vibrations of C-O and C-C groups appeared[5,23,61,62]. The major peaks that represent triglyceride functional groups were observed at Table 3.
Table 3 Assignments of the major middle-infrared absorption bands of lipid spectrum
Region Wavelength
/cm-1 Molecule Group Vibration
3029-3025 trans RCH=CHR =C-H Stretching A
3006-2989 cis RCH=CHR =C-H Stretching
2989-2946 -CH3 C-H Stretching (asym)
2946-2881 -CH2 C-H Stretching (asym)
2881-2872 -CH3 C-H Stretching (sym)
2854-2782 -CH2 C-H Stretching (sym)
1795-1746 ester -C=O Stretching B
1711-1677 acid -C=O Stretching
1486-1450 CH2 C-H Bending (scissoring)
1450-1425 CH3 C-H Bending (asym)
1425-1409 cis RCH=CHR C=C Bending (rocking) 1409-1396 cis RCH=CHR =C-H Bending C
1382-1371 C-H2 C-H Bending(sym)
1371-1330 O-H Bending(in plane)
1290-1211 ester C-O Stretching D
1166-1033 C-O Stretching
1006-965 trans RCH=CHR C=C Bending(out of plane) 929-885 cis RCH=CHR C=C Bending(out of plane)
802-723 C-H Bending(out of plane)
E
715-701 -(CH2)-n C-H Bending (rocking)
From previous study, discrimination power of two ratios of absorbance at defined wavenumber (990/980 ratio, 966/956 ratio) was studied by Bellorini et al.[27] The discrimination of tallow from any other mammalian fat is possible for pure compound, which is positively correlated to the degree of unsaturation of samples[63,64]. Gasperini et al.[65] found that FT-IR was useful for the correct classification of different food and feedstuff oil co- and by-products. Using this technique, fatty acid calcium soaps, fully hydrogenated fatty acids, lecithins,
acid oils from chemical refining, acid oils from physical refining and fish oils can be easily classified. Remaining categories of animal fats, fried oils and oils recovered from exhausted bleaching earth can be differentiated by using one or two additional chemical tests. The presence of characteristic absorption signals, which is 3400 cm–1, 3011 cm–1, 1740 cm–1, 1620 cm–1, 1290-970 cm–1 and 940 cm–1, can be used for lipid identification. Besides, Gasperini et al.[65] drawn a tentative decisional tree which allowed the classification of the evaluated feeding fats by means of a simple FT-IR spectroscopy.
Moreover, FT-IR technique coupled with chemometrics techniques, such as PCA, Partial Least Squares (PLS) and linear discriminant analysis (LDA), are adopted to emphasize the differences of spectra and to systematically classify oil and fat[32,33,66,67]. Rohman et al.[18,32,68] devote to authentication analysis research which included adulteration of cod-liver oil with cheaper animal fats, such as beef fat, chicken fat, mutton fat and lard fat. The level of adulterants was successfully determined with the aid of PLS model at the selected combined fingerprint region of 3010-2995 cm–1 and 1500-900 cm–1. Besides, Rohman et al.[15] also researched lard fat in the mixture with fat of lamb, cow and chicken. PLS and discriminant analysis (DA) with entire range of MIR (3300-650 cm-1) was successfully differentiate lard and mixtures with other three animal fat. Moreover, calibration model obtained between actual lard concentration in mixture and FTIR predicted concentration show higher coefficient of determination (R2) which was 0.995, 0.999, and 0.998, respectively.
distinguishing between pure fat samples, but it is difficulty when attempting to identify tallow contamination in a mixture of fat. Discriminant analysis applied to FTIR spectra has correctly classified extra-virgin and refined olive oil, in spite of the high degree of similarity of their spectra. They have also shown that it is possible to determine quantitatively the level of typical adulterants in extra-virgin olive[69]. In addition, in the study of Dupuy et al.[70], 17 commercial samples of butter fats and margarines and 15 commercial oil samples (seed oil, olive oil and peanut oil) were studied by means of FT-IR spectroscopy and PCA for their classification. Interpretation of experimental data confirmed that intensity of spectral bands was connected with relative concentrations of saturated or unsaturated fatty acid in relation to their animal or vegetable origins. FT-IR spectroscopy with multivariate analysis techniques were also used by Safar et al.[71] for characterization of edible oils, butters and margarines, in which the lipid-rich foods were classified according to their degree of unsaturation.
FT-IR has also been used to distinguish extra virgin olive oil from different geographical origins[72,73] and different genetic varieties[74]. FT-IR applications detecting olive oil adulteration with low cost edible oils have been also described[75,76]. In the work of Lerma-García et al.[61], FTIR followed by LDA of spectral data was used to classify vegetable oils according to their botanical origin.
4.3 Technique and methodology of FT-Raman
spectroscopy
It has been argued that Raman spectroscopy is of limited use in biological applications, due to many problems associated with classical dispersive instruments, such as fluorescence interference, photodecomposition, wavenumber calibration problem, lack of precise frequency, and difficulty to attain high-resolution spectra[17,77-81]. The non-dispersive spectrometer, such as FT-Raman spectrometer, seems better with regard to analyses of lipid[21,82-84]. FT-Raman spectroscopy has great potential for compositional analysis of oil and fat which could avoid above problems with use of Michelson interferometers and microcomputers for data processing
and keeping its traditional advantages for instant rapid detection, no sample preparation or sample destruction and suitability for on-line processes. The most important advantage of FT-Raman for lipid is that spectra are fluorescence-free because operating frequency of Nd:YAG laser (1064 μm) is well below the threshold for fluorescence processes, which are widely present in many oil and fat[85]. Furthermore, band positions existed in FT-Raman spectra occurred to modified phenomenon due to interatomic distance, spatial arrangement group, Fermi resonance, physical state of sample, polarity of environment, formation of hydrogen bond, and inductive, mesomeric, and field effects of neighboring groups[86].
In FT-Raman spectra, major bands in the vicinity of 3010 cm-1, 2935-2855 cm-1, 1750 cm-1, 1670-1656 cm-1, 1440 cm-1 and 1295 cm-1 are characteristics of =C-H stretching (asymmetry), C-H stretching (asymmetry), C=O stretching, C=C stretching, C-H bending, =C-H bending (cis), respectively[87-89]. Raman spectra between 3700 cm-1 and 500 cm-1 were used for discriminant analysis, and main Raman absorption peaks of lipid were presented at Table 4.
Table 4 Assignments of the major Raman absorption bands of lipid spectrum
Region Raman shift
/cm-1 Molecule Group Vibration
3015 RCH=CHR =C-H Stretching (asym)
3005 cis RCH=CHR =C-H Stretching (sym)
2970 -CH3 C-H Stretching (asym)
2940-2924 -CH2 C-H Stretching (asym)
2900-2897 -CH3 C-H Stretching (sym)
A
2860-2850 -CH2 C-H Stretching (sym)
2723 -(CH2)-n C-H Stretching
1750-1747 RC=OOR C=O Stretching
1670 trans RCH=CHR C=C Stretching
B
1660-1651 cis RCH=CHR C=C Stretching
C 1445-1439 -CH2 C-H Deformation(scissoring)
1310-1300 -CH2 C-H Deformation(distortion)
D
1275-1265 cis RCH=CHR =C-H Deformation
1100-1000 -(CH2)-n C-C Stretching
968 trans RCH=CHR C=H Deformation
E
900-800 -(CH2)-n C-C Stretching
adulteration processes[24,90]. FT-Raman spectroscopy combined with multivariate procedures was used by Baeten et al.[87] to predict the level of adulteration in virgin olive oil adulterated with soybean (rich in trilinolein), corn (rich in trilinolein) and raw olive oil residue oils (poor in trilinolein) at 1%, 5% and 10%, respectively. Trilinolein is present in virgin olive oil at trace level, thus high content of trilinolein indicated that virgin olive oil has been adulterated with other kinds of vegetable oil. Classical multivariate procedures were applied which are principal components regression (PCR), stepwise linear regression analysis (SLRA), stepwise linear discriminant analysis (SLDA) and cluster analysis (CA). Results showed FT-Raman spectroscopy could be useful in the detection of low level of adulteration, however, more work is needed to reach the repeatability and reproducibility.
In other research, Baeten et al.[28] studied noteworthy bands of FT-Raman spectral features and applied PCA to classify edible oil and fat by their degree of unsaturation which involved saturated (SFA), MUFA, and PUFA. The samples included both vegetable oils (Brazil nut, coconut, corn, olive oil, sunflower, peanut, rapeseed and soybean) and animal fats (butter, hydrogenated fish and tallow). The most remarkable MUFA and PUFA oil sources were independently classified by applying SLDA to the Raman shifts selected by their correlation with fatty acids or structural assignments. The results showed that FT-Raman spectra not only had information of the degree of unsaturation but also of the balance among the amounts of SFA, MUFA and PUFA. Besides, spectral study showed that their Raman spectra mainly contain information about the unsaturated fatty acids (MUFA and PUFA). Author illustrated FT-Raman was accurate and rapid analysis techniques to identify vegetable oil and animal fat compared with the traditional gas chromatography (GC) method.
It has been shown in López-Díez et al.’s[24] researches that Raman spectroscopy together with multivariate methods can successfully distinguish between chemically similar oil (olive oil and hazelnut oil). Moreover, the composition of hazelnut and extra virgin olive oil mixtures could be accurately predicted using either PLS
regression or the more sophisticated computational method of genetic programming. Raman spectroscopy combined with appropriate chemometrics presents powerful tool for authentication of oil and fat.
Abbas et al.[91] investigated ability of FT-Raman spectroscopy to distinguish animal fats (poultry, pig, bovine, lamb and fish oils) using chemometric methods (PCA and PLS-DA). This method possessed advantage of giving detailed structural information of fat. Author considered this analytical methodology provided a rapid and reliable way for the discrimination of animal fats used in feedstuffs.
Based on the above mentions, FT-Raman spectroscopy has been shown to be a promising tool for determining different parameters and properties of oil and fat. Raman spectroscopy has been also proposed for classification, authentication and detection of the adulteration of oil and fat from plant and animal origin.
5 Discussion and future perspectives
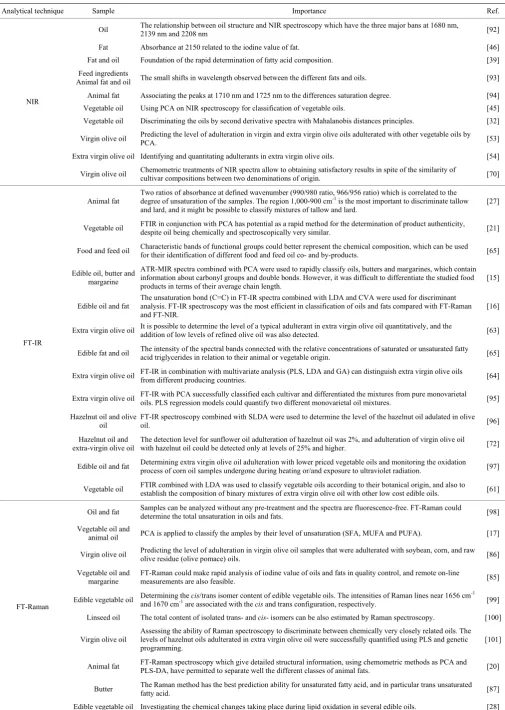
Table 5 Review of papers on the species identification based on lipid using NIR, FT-IR and Raman spectroscopy
Analytical technique Sample Importance Ref.
Oil The relationship between oil structure and NIR spectroscopy which have the three major bans at 1680 nm, 2139 nm and 2208 nm [92]
Fat Absorbance at 2150 related to the iodine value of fat. [46]
Fat and oil Foundation of the rapid determination of fatty acid composition. [39]
Feed ingredients
Animal fat and oil The small shifts in wavelength observed between the different fats and oils. [93] Animal fat Associating the peaks at 1710 nm and 1725 nm to the differences saturation degree. [94]
Vegetable oil Using PCA on NIR spectroscopy for classification of vegetable oils. [45]
Vegetable oil Discriminating the oils by second derivative spectra with Mahalanobis distances principles. [32] Virgin olive oil Predicting the level of adulteration in virgin and extra virgin olive oils adulterated with other vegetable oils by
PCA. [53]
Extra virgin olive oil Identifying and quantitating adulterants in extra virgin olive oils. [54] NIR
Virgin olive oil Chemometric treatments of NIR spectra allow to obtaining satisfactory results in spite of the similarity of
cultivar compositions between two denominations of origin. [70]
Animal fat
Two ratios of absorbance at defined wavenumber (990/980 ratio, 966/956 ratio) which is correlated to the degree of unsaturation of the samples. The region 1,000-900 cm-1 is the most important to discriminate tallow
and lard, and it might be possible to classify mixtures of tallow and lard.
[27]
Vegetable oil FTIR in conjunction with PCA has potential as a rapid method for the determination of product authenticity, despite oil being chemically and spectroscopically very similar. [21]
Food and feed oil Characteristic bands of functional groups could better represent the chemical composition, which can be used for their identification of different food and feed oil co- and by-products. [65]
Edible oil, butter and margarine
ATR-MIR spectra combined with PCA were used to rapidly classify oils, butters and margarines, which contain information about carbonyl groups and double bonds. However, it was difficult to differentiate the studied food products in terms of their average chain length.
[15]
Edible oil and fat
The unsaturation bond (C=C) in FT-IR spectra combined with LDA and CVA were used for discriminant analysis. FT-IR spectroscopy was the most efficient in classification of oils and fats compared with FT-Raman and FT-NIR.
[16]
Extra virgin olive oil It is possible to determine the level of a typical adulterant in extra virgin olive oil quantitatively, and the
addition of low levels of refined olive oil was also detected. [63]
Edible fat and oil The intensity of the spectral bands connected with the relative concentrations of saturated or unsaturated fatty
acid triglycerides in relation to their animal or vegetable origin. [65]
Extra virgin olive oil FT-IR in combination with multivariate analysis (PLS, LDA and GA) can distinguish extra virgin olive oils
from different producing countries. [64]
Extra virgin olive oil FT-IR with PCA successfully classified each cultivar and differentiated the mixtures from pure monovarietal oils. PLS regression models could quantify two different monovarietal oil mixtures. [95] Hazelnut oil and olive
oil
FT-IR spectroscopy combined with SLDA were used to determine the level of the hazelnut oil adulated in olive
oil. [96]
Hazelnut oil and extra-virgin olive oil
The detection level for sunflower oil adulteration of hazelnut oil was 2%, and adulteration of virgin olive oil
with hazelnut oil could be detected only at levels of 25% and higher. [72]
Edible oil and fat Determining extra virgin olive oil adulteration with lower priced vegetable oils and monitoring the oxidation process of corn oil samples undergone during heating or/and exposure to ultraviolet radiation. [97] FT-IR
Vegetable oil FTIR combined with LDA was used to classify vegetable oils according to their botanical origin, and also to establish the composition of binary mixtures of extra virgin olive oil with other low cost edible oils. [61]
Oil and fat Samples can be analyzed without any pre-treatment and the spectra are fluorescence-free. FT-Raman could
determine the total unsaturation in oils and fats. [98]
Vegetable oil and
animal oil PCA is applied to classify the amples by their level of unsaturation (SFA, MUFA and PUFA). [17] Virgin olive oil Predicting the level of adulteration in virgin olive oil samples that were adulterated with soybean, corn, and raw olive residue (olive pomace) oils. [86] Vegetable oil and
margarine FT-Raman could make rapid analysis of iodine value of oils and fats in quality control, and remote on-line measurements are also feasible. [85] Edible vegetable oil Determining the cis/trans isomer content of edible vegetable oils. The intensities of Raman lines near 1656 cm-1
and 1670 cm-1 are associated with the cis and trans configuration, respectively. [99]
Linseed oil The total content of isolated trans- and cis- isomers can be also estimated by Raman spectroscopy. [100]
Virgin olive oil
Assessing the ability of Raman spectroscopy to discriminate between chemically very closely related oils. The levels of hazelnut oils adulterated in extra virgin olive oil were successfully quantified using PLS and genetic
programming. [101]
Animal fat FT-Raman spectroscopy which give detailed structural information, using chemometric methods as PCA and PLS-DA, have permitted to separate well the different classes of animal fats. [20]
Butter The Raman method has the best prediction ability for unsaturated fatty acid, and in particular trans unsaturated
fatty acid. [87]
FT-Raman
We also acknowledged that spectra of FT-IR and FT-Raman was both complementary, which consisted of the whole and integrated spectral information of molecule. Therefore, combination of FT-IR and FT-Raman spectroscopic technology was the valuable and feasibility method to discriminate adulterated oil and fat for further research.
Another main challenge for spectroscopic technology applied in discrimination of oil and fat is the high limit of detection, which is demonstrated by poor predictability for the low adulterated content. Besides, although pure lipid sample could be successfully distinguished according to their sources, there exists more difficult detection for discriminating lipid mixture. In the further, more work for lipid mixture of different ranges of concentration could be studied, especially determining lowest concentration accurately.
Therefore, it is suggested that devoting to explore new analytical techniques with higher limit of detection. Infrared spectroscopy or Raman spectroscopy combined with other detective technologies, such as microscopical technique and laser scanning confocal microscopy, or chemometric methods, such as artificial neural network and genetic algorithm, which could contribute to resolve successfully this challenge. Those combined technologies might be used to set up reliable and fast methods for lipid industrial process controls.
It is important to notice that proposed technique for classification of lipid products cannot completely substitute chemical analytical control for qualitative and quantitative assessment, at least for the moment. However, we believe that spectroscopy testing technology could be a useful tool to the technician in the selection of suitable analytical methods for lipid detection. Besides, in another section of future lipid safety, a handbook containing a number of analytical methods for lipid evaluation, qualitative and quantitative analyses should be published for the more effective safety control.
Acknowledgments
This research was supported by International S&T Cooperation Program of China (2015DFG32170), National Key Scientific Instrument and Equipment
Development Project (2014YQ47037705) and China Agricultural University ‘DaBeiNong Education Fund’.
[References]
[1] Man Y B C, Rohman A. Discriminant analysis of selected edible fats and oils and those in biscuit formulation using FTIR spectroscopy. Food Anal Methods, 2011; 4(3): 404–409.
[2] Dourtoglou V G, Dourtoglou T, Antonopoulos A, Stefanou E, Lalas S, Poulos C. Detection of olive oil adulteration using principal component analysis applied on total and regio FA content. J Am Oil Chem Soc, 2003; 80(3): 203–208.
[3] Gallardo-Velázquez T, Osorio-Revilla G, Loa MZ-d, Rivera-Espinoza Y. Application of FTIR-HATR spectroscopy and multivariate analysis to the quantification of adulterants in Mexican honeys. Food Research International, 2009; 42(3): 313–318.
[4] Rohman A, Che Man Y B. The use of Fourier transform mid infrared (FT-MIR) spectroscopy for detection and quantification of adulteration in virgin coconut oil. Food Chemistry, 2011; 129(2): 583–588.
[5] Hernández-Martínez M, Gallardo-Velázquez T, Osorio-Revilla G, Almaraz-Abarca N, Ponce-Mendoza A, Vásquez-Murrieta M S. Prediction of total fat, fatty acid composition and nutritional parameters in fish fillets using MID-FTIR spectroscopy and chemometrics. LWT-Food Science and Technology, 2013; 52(1): 12–20.
[6] Rohman A, Che Man Y B. Palm oil analysis in adulterated sesame oil using chromatography and FTIR spectroscopy. European Journal of Lipid Science and Technology, 2011; 113(4): 522–527.
[7] Peng D, Bi Y, Ren X, Yang G, Sun S, Wang X. Detection and quantification of adulteration of sesame oils with vegetable oils using gas chromatography and multivariate data analysis. Food Chemistry, 2015; 188: 415–421. [8] Zhu X, Ye A, Verrier T, Singh H. Free fatty acid profiles of
emulsified lipids during in vitro digestion with pancreatic lipase. Food Chemistry, 2013; 139(1-4): 398–404.
[9] Lee J H, Jones K C, Foglia T A, Lee C-R, Akoh CC, Lee K-T. High performance liquid chromatographic separation of interesterified palm oil with tributyrin. LWT - Food Science and Technology, 2008; 41(8): 1446–1451.
[10] Aida A A, Che Man Y B, Wong C M V L, Raha A R, Son R. Analysis of raw meats and fats of pigs using polymerase chain reaction for Halal authentication. Meat Science, 2005; 69(1): 47–52.
507–518.
[12] Aktas N, Kaya M. Detection of beef body fat and margarine in butterfat by differential scanning calorimetry. Journal of Thermal Analysis and Calorimetry. 2001; 66(3): 795–801. [13] Chen L, Yang Z, Han L. A review on the use of
near-infrared spectroscopy for analyzing feed protein materials. Applied Spectroscopy Reviews, 2013; 48(7): 509–522.
[14] Voort F R V D, Ghetler A, Garcíagonzález D L, Li Y D. Perspectives on quantitative mid-FTIR spectroscopy in relation to edible oil and lubricant analysis: Evolution and Integration of Analytical Methodologies. Food Anal Methods, 2008; 1(3): 153–163.
[15] Rohman A, Che Man Y. FTIR spectroscopy combined with chemometrics for analysis of lard in the mixtures with body fats of lamb, cow, and chicken. International Food Research Journal, 2010; 17(3): 519–526.
[16] Yang H, Irudayaraj J, Paradkar M M. Discriminant analysis of edible oils and fats by FTIR, FT-NIR and FT-Raman spectroscopy. Food Chemistry, 2005; 93(1): 25–32.
[17] Rohman A, Che Man Y. Analysis of cod-liver oil adulteration using Fourier transform infrared (FTIR) spectroscopy. J Am Oil Chem Soc, 2009; 86(12): 1149–1153.
[18] Rohman A, Che Man Y B. Authentication analysis of cod liver oil from beef fat using fatty acid composition and FTIR spectra. Food Additives & Contaminants: Part A. 2011; 28(11): 1469–1474.
[19] Yang Z, Han L, Fernández Pierna J, Dardenne P, Baeten V. Review: The potential of near infrared microscopy to detect, identify and quantify processed animal by-products. Journal of Near Infrared Spectroscopy, 2011; 19(4): 211–231. [20] Skoog D, Holler F, Nieman T. Capillary electrophoresis and
capillary electrochromatograpy. Harcourt Brace College Publishers, Philadelphia, PA. 1998; pp. 778–795.
[21] Baeten V, Aparicio R. Edible oils and fats authentication by Fourier transform Raman spectrometry. Biotechnologie, agronomie, societe et environnement, 2000; 4(4): 196–203. [22] Baeten V, Dardenne P. Spectroscopy: developments in
instrumentation and analysis. Grasas y aceites, 2002; 53(1): 45–63.
[23] Guillén M D, Cabo N. Infrared spectroscopy in the study of edible oils and fats. Journal of the Science of Food and Agriculture, 1997; 75(1): 1–11.
[24] López-Díez E C, Bianchi G, Goodacre R. Rapid quantitative assessment of the adulteration of virgin olive oils with hazelnut oils using Raman spectroscopy and chemometrics. Journal of Agricultural and Food Chemistry, 2003; 51(21): 6145–6150.
[25] Baeten V. Raman spectroscopy in lipid analysis. Lipid
Technology, 2010; 22(2): 36–38.
[26] Mahesar S A, Sherazi S T H, Kandhro A A, Bhanger M I, Khaskheli A R, Talpur M Y. Evaluation of important fatty acid ratios in poultry feed lipids by ATR FTIR spectroscopy. Vibrational Spectroscopy, 2011; 57(2): 177–181.
[27] Bellorini S, Strathmann S, Baeten V, Fumière O, Berben G, Tirendi S, et al. Discriminating animal fats and their origins: assessing the potentials of Fourier transform infrared spectroscopy, gas chromatography, immunoassay and polymerase chain reaction techniques. Anal Bioanal Chem, 2005; 382(4): 1073–1083.
[28] Baeten V, Hourant P, Morales M T, Aparicio R. Oil and fat classification by FT-Raman spectroscopy. Journal of Agricultural and Food Chemistry, 1998; 46(7): 2638–2646. [29] Dobson G. Spectroscopy and spectrometry of lipids—Part 1.
European Journal of Lipid Science and Technology, 2001; 103(12): 815.
[30] Dobson G. Spectroscopy and spectrometry of lipids—Part 2. European Journal of Lipid Science and Technology, 2002; 104(1): 36.
[31] Abbas O, Pierna J A F, Boix A, Holst C V, Dardenne P, Baeten V. Key parameters for the development of a NIR microscopic method for the quantification of processed by-products of animal origin in compound feeding stuffs. Anal Bioanal Chem, 2010; 397(5): 1965–1973.
[32] Rohman A, Sunarminingsih R, Che Man Y B. The employment of FTIR spectroscopy and chemometrics for classification and quantification of mutton fat in cod liver oil. American Journal of Food Technology, 2012; 7: 151–159. [33] Fadzlillah N A, Che Man Y B, Rohman A. FTIR
spectroscopy combined with chemometric for analysis of sesame oil adulterated with corn oil. International Journal of Food Properties, 2014; 17(6): 1275–1282.
[34] Fadzlillah N A, Rohman A, Ismail A, Mustafa S, Khatib A. Application of FTIR-ATR spectroscopy coupled with multivariate analysis for rapid estimation of butter adulteration. Journal of Oleo Science, 2013; 62(8): 555–562.
[35] Suparman W S R, Sundhani E, Saputri S D. The use of Fourier transform infrared spectroscopy (FTIR) and gas chromatography mass spectroscopy (GCMS) for halal authentication in imported chocolate with various variants. Analysis, 2015; 2: 03.
[36] Shao J H, Deng Y M, Zhou G H, Xu X L, Liu D Y. A Raman spectroscopic study of meat protein/lipid interactions at protein/oil or protein/fat interfaces. International Journal of Food Science & Technology, 2015; 50(4): 982–989. [37] Yao Y, Zhao G, Yan Y, Mu H, Jin Q, Zou X, et al. Milk fat
International, 2016; 80: 61–69.
[38] Bewig K, Clarke A, Roberts C, Unklesbay N. Discriminant analysis of vegetable oils by near-infrared reflectance spectroscopy. J Amer Oil Chem Soc, 1994; 71(2): 195–200. [39] Sato T. Application of principal-component analysis on
near-infrared spectroscopic data of vegetable oils for their classification. J Amer Oil Chem Soc, 1994; 71(3): 293–298. [40] Panford J A, de Man J M. Determination of oil content of seeds by NIR: Influence of fatty acid composition on wavelength selection. J Amer Oil Chem Soc, 1990; 67(8): 473–482.
[41] Socrates G. Infrared and Raman characteristic group frequencies: tables and charts: John Wiley & Sons, 2004. [42] Li H, van de Voort F R, Ismail A A, Sedman J, Cox R.
Trans determination of edible oils by Fourier transform near-infrared spectroscopy. J Am Oil Chem Soc, 2000; 77(10): 1061–1067.
[43] Graham S F, Haughey S A, Ervin R M, Cancouët E, Bell S, Elliott C T. The application of near-infrared (NIR) and Raman spectroscopy to detect adulteration of oil used in animal feed production. Food Chemistry, 2012; 132(3): 1614–1619.
[44] Christy A A, Kasemsumran S, Du Y, Ozaki Y. The detection and quantification of adulteration in olive oil by near-infrared spectroscopy and chemometrics. Analytical Sciences, 2004; 20(6): 935–940.
[45] Hourant P, Baeten V, Morales M T, Meurens M, Aparicio R. Oil and fat classification by selected bands of near-infrared spectroscopy. Appl Spectrosc, 2000; 54(8): 1168–1174. [46] Holman R T, Edmondson P R. Near-infrared spectra of fatty
acids and some related substances. Analytical Chemistry, 1956; 28(10): 1533–1538.
[47] Cho R K, Iwamoto M. The purity identification of sesame oil by near infrared reflectance spectroscopy Proceedings of the 2nd International NIRS conference, 1989; Tsukuba, Japan.
[48] Zhou L J, Wu H, Li J T, Wang Z Y, Zhang L Y. Determination of fatty acids in broiler breast meat by near-infrared reflectance spectroscopy. Meat Science, 2012; 90(3): 658–664.
[49] Azizian H, Kramer J K, Mossoba M M. Evaluating the transferability of FT-NIR calibration models for fatty acid determination of edible fats and oils among five same-make spectrometers using transmission or transflection modes with different pathlengths. J Am Oil Chem Soc, 2012; 89(12): 2143–2154.
[50] Garrido-Varo A, Pérez-Marín D, Bautista-Cruz J, Guerrero J. Near infrared spectroscopy for quantification of animal-origin fats in fat blends. Journal of Near Infrared Spectroscopy, 2008; 16(3): 281–283.
[51] Daszykowski M, Wrobel M, Czarnik-Matusewicz H, Walczak B. Near-infrared reflectance spectroscopy and multivariate calibration techniques applied to modelling the crude protein, fibre and fat content in rapeseed meal. Analyst, 2008; 133(11): 1523–1531.
[52] Wetzel D L. Lipid structures and NIRA. Proceedings of 4th International Symposium on Near Infrared Applications Williams, 1983; New York.
[53] Savitzky A, Golay M J E. Smoothing and differentiation of data by simplified least squares procedures. Analytical Chemistry, 1964; 36(8): 1627–1639.
[54] Barnes R J, Dhanoa M S, Lister S J. Standard normal variate transformation and de-trending of near-infrared diffuse reflectance spectra. Appl Spectrosc, 1989; 43(5): 772–777.
[55] Martens H, Martens M. Modified Jack-knife estimation of parameter uncertainty in bilinear modelling by partial least squares regression (PLSR). Food Quality and Preference, 2000; 11(1-2) :5-16.
[56] Azzouz T, Puigdoménech A, Aragay M, Tauler R. Comparison between different data pre-treatment methods in the analysis of forage samples using near-infrared diffuse reflectance spectroscopy and partial least-squares multivariate calibration method. Analytica Chimica Acta, 2003; 484(1): 121–134.
[57] Wesley I J, Barnes R J, McGill A E J. Measurement of adulteration of olive oils by near-infrared spectroscopy. J Amer Oil Chem Soc, 1995; 72(3): 289–292.
[58] Wesley I J, Pacheco F, McGill A E J. Identification of adulterants in olive oils. J Amer Oil Chem Soc, 1996; 73(4): 515–518.
[59] PÉRez MarÍN D C, Garrido-Varo A, Guerrero J E, GÓMez A, Soldado A, De La Roza B. External validation and transferability of NIRS models developed for detecting and quantifying MBM in intact compound feeding stuffs. Journal of Food Quality, 2008; 31(1): 96–107.
[60] Perez Marin D C, Garrido-Varo A, Guerrero J E, Gomez A, Soldado A, De La Roza B. External validation and transferability of NIRS models developed for detecting and quantifying MBM in intact compound feeding stuffs. Journal of Food Quality, 2008; 31(1): 96–107.
[61] Lerma-García M J, Ramis-Ramos G, Herrero-Martínez J M, Simó-Alfonso E F. Authentication of extra virgin olive oils by Fourier-transform infrared spectroscopy. Food Chemistry, 2010; 118(1): 78–83.
[62] Kurniawati E, Rohman A, Triyana K. Analysis of lard in meatball broth using Fourier transform infrared spectroscopy and chemometrics. Meat Science, 2014; 96(1): 94–98. [63] Aparicio R, Baeten V. Authentication of virgin olive oil by
European Communities Commission (FAIR, CT-96-5053), 1998.
[64] Lai Y W, Kemsley E K, Wilson R H. Quantitative analysis of potential adulterants of extra virgin olive oil using infrared spectroscopy. Food Chemistry, 1995; 53(1): 95–98.
[65] Gasperini G, Fusari E, Della Bella L, Bondioli P. Classification of feeding fats by FT-IR spectroscopy. European Journal of Lipid Science and Technology, 2007; 109(7): 673–681.
[66] Nurrulhidayah A, Che Man Y, Rohman A, Amin I, Shuhaimi M, Khatib A. Authentication analysis of butter from beef fat using Fourier transform infrared (FTIR) spectroscopy coupled with chemometrics. International Food Research Journal, 2013; 20(3): 1383–1388.
[67] Nurrulhidayah A, Rohman A, Amin I, Shuhaimi M, Khatib A. Analysis of chicken fat as adulterant in butter using Fourier transform infrared spectroscopy and chemometrics. Grasas y Aceites, 2013; 64(4): 349–355.
[68] Rohman A, Che Man Y B. Analysis of chicken fat as adulterant in cod liver oil using Fourier transform infrared (FTIR) spectroscopy and chemometrics. CyTA - Journal of Food, 2011; 9(3): 187–191.
[69] Lai Y W, Kemsley E K, Wilson R H. Potential of Fourier transform infrared spectroscopy for the authentication of vegetable oils. Journal of Agricultural and Food Chemistry, 1994; 42(5): 1154–1159.
[70] Dupuy N, Duponchel L, Huvenne J P, Sombret B, Legrand P. Classification of edible fats and oils by principal component analysis of Fourier transform infrared spectra. Food Chemistry, 1996; 57(2): 245–251.
[71] Safar M, Bertrand D, Robert P, Devaux M F, Genot C. Characterization of edible oils, butters and margarines by Fourier transform infrared spectroscopy with attenuated total reflectance. J Amer Oil Chem Soc, 1994; 71(4): 371–377. [72] Bendini A, Cerretani L, Di Virgilio F, Belloni P,
Bonoli-Carbognin M, Lercker G. Preliminary evaluation of the application of the FTIR spectroscopy to control the geographic origin and quality of virgin olive oils. Journal of Food Quality, 2007; 30(4): 424–437.
[73] Galtier O, Dupuy N, Le Dreau Y, Ollivier D, Pinatec C, Kister J, et al. Geographic origins and compositions of virgin olive oils determinated by chemometric analysis of NIR spectra. Analytica Chimica Acta, 2007; 595(1-2): 136–144.
[74] Gurdeniz G, Tokatli F, Ozen B. Differentiation of mixtures of monovarietal olive oils by mid-infrared spectroscopy and chemometrics. European Journal of Lipid Science and Technology, 2007; 109(12): 1194–1202.
[75] Baeten V, Fernández Pierna J A, Dardenne P, Meurens M, García-González D L, Aparicio-Ruiz R. Detection of the
presence of hazelnut oil in olive oil by FT-Raman and FT-MIR spectroscopy. Journal of Agricultural and Food Chemistry, 2005; 53(16): 6201–6206.
[76] Vlachos N, Skopelitis Y, Psaroudaki M, Konstantinidou V, Chatzilazarou A, Tegou E. Applications of Fourier transform-infrared spectroscopy to edible oils. Analytica Chimica Acta, 2006; 573: 459–465.
[77] Chase D B. Fourier transform Raman spectroscopy. Journal of the American Chemical Society, 1986; 108(24): 7485–7488.
[78] Lewis E N, Kalasinsky V F, Levin I W. Near-infrared Fourier-transform Raman spectroscopy using fiber-optic assemblies. Analytical Chemistry, 1988; 60(24): 2658–2661.
[79] Sadeghi-Jorabchi H, Wilson R H, Belton P S, Edwards-Webb J D, Coxon D T. Quantitative analysis of oils and fats by Fourier transform Raman spectroscopy. Spectrochimica Acta Part A: Molecular Spectroscopy, 1991; 47(9-10): 1449–1458.
[80] McGoverin C M, Clark A S S, Holroyd S E, Gordon K C. Raman spectroscopic quantification of milk powder constituents. Analytica Chimica Acta, 2010; 673(1): 26–32. [81] Afseth N K, Wold J P, Segtnan V H. The potential of
Raman spectroscopy for characterisation of the fatty acid unsaturation of salmon. Analytica Chimica Acta, 2006; 572(1): 85–92.
[82] Mazurek S, Szostak R, Czaja T, Zachwieja A. Analysis of milk by FT-Raman spectroscopy. Talanta. 2015; 138: 285–289.
[83] Bernuy B, Meurens M, Mignolet E, Larondelle Y. Performance comparison of UV and FT-Raman spectroscopy in the determination of conjugated linoleic acids in cow milk fat. Journal of Agricultural and Food Chemistry, 2008; 56(4): 1159–1163.
[84] Zając A, Hanuza J, Dymińska L. Raman spectroscopy in determination of horse meat content in the mixture with other meats. Food Chemistry, 2014; 156: 333–338.
[85] Kiritsakis A K, Dugan L R. Effect of selected storage conditions and packaging materials on olive oil quality. J Amer Oil Chem Soc, 1984; 61(12): 1868–1870.
[86] Diem M. Introduction to Modern Vibrational Spectroscopy. New York: John Wiley & Sons, 1993.
[87] Baeten V, Meurens M, Morales M T, Aparicio R. Detection of virgin olive oil adulteration by Fourier transform Raman spectroscopy. Journal of Agricultural and Food Chemistry, 1996; 44(8): 2225–2230.
[89] M. Edwards H G, Villar S E J, de Oliveira L F C, Hyaric M L. Analytical Raman spectroscopic study of cacao seeds and their chemical extracts. Analytica Chimica Acta, 2005; 538(1-2): 175–180.
[90] Davies A N, McIntyre P, Morgan E. Study of the use of molecular spectroscopy for the authentication of extra virgin olive oils. Part I: Fourier transform Raman spectroscopy. Appl Spectrosc, 2000; 54(12): 1864–1867.
[91] Abbas O, Fernández Pierna J A, Codony R, von Holst C, Baeten V. Assessment of the discrimination of animal fat by FT-Raman spectroscopy. Journal of Molecular Structure, 2009; s924–926(1): 294–300.
[92] Sato T, Kawano S, Iwamoto M. Near-infrared spectral patterns of fatty-acid analysis from fats and oils. Journal of the American Oil Chemists Society, 1991; 68(11): 827–833. [93] Garridovaro A, Pérezmarn M D, Guerrero J E, Gmezcabrera
A. Near infrared spectroscopy for enforcement of European legislation concerning the use of animal by-products in animal feeds. Biotechnologie, agronomie, société et environnement, 2005; 9(1): 3–9.
[94] Blanco M, Pagès J. Classification and quantitation of finishing oils by near infrared spectroscopy. Analytica Chimica Acta, 2002; 463(2): 295–303.
[95] Rusak D A, Brown L M, Martin S D. Classification of vegetable oils by principal component analysis of FTIR spectra. Journal of Chemical Education, 2003; 80(5):
541–543.
[96] Bendini A, Cerretani L, Carrasco-Pancorbo A, Gomez- Caravaca A M, Segura-Carretero A, Fernandez-Gutierrez A, et al. Phenolic molecules in virgin olive oils: a survey of their sensory properties, health effects, antioxidant activity and analytical methods: An overview of the last decade. Molecules, 2007; 12(8): 1679–1719.
[97] Tapp H S, Defernez M, Kemsley E K. FTIR spectroscopy and multivariate analysis can distinguish the geographic origin of extra virgin olive oils. Journal of Agricultural and Food Chemistry, 2003; 51(21): 6110–6115.
[98] Tay A, Singh R K, Krishnan S S, Gore J P. Authentication of olive oil adulterated with vegetable oils using Fourier transform infrared spectroscopy. LWT - Food Science and Technology, 2002; 35(1): 99–103.
[99] Bailey G, Horvat R. Raman spectroscopic analysis of thecis/trans isomer composition of edible vegetable oils. J Amer Oil Chem Soc, 1972; 49(8): 494–498.
[100]Chmielarz B, Bajdor K, Labudzinska A, Klukowskamajewska Z. Studies on the double-bond positional isomerization process in linseed oil by UV, IR and Raman-spectroscopy. Journal of Molecular Structure, 1995; 348: 313–316.
![Table 1 Difference between infrared and Raman spectroscopies[16,19,21]](https://thumb-us.123doks.com/thumbv2/123dok_us/605531.2060190/2.595.310.555.374.530/table-difference-infrared-raman-spectroscopies.webp)
![Figure 1[29].](https://thumb-us.123doks.com/thumbv2/123dok_us/605531.2060190/3.595.115.486.522.780/figure.webp)