Discrimination of brownheart of Korla pear using vibration
frequency spectrum technique
Xu Hubo
,
Wu Jie
*,
Wang Zhaopeng
,
Gao Yongmao
,
Wang Zhipeng
,
Zhao Zhengqiang
(College of Mechanical and Electrical Engineering, Shihezi University, Shihezi 832003, Xinjiang, China)
Abstract: The purpose of this work was to use a nondestructive method for detecting the brownheart of Korla pear to reduce the chance of infection among pears without brownheart. A mechanical impulse method based on vibration testing system was used to excite the fruits. The consistent acquisition signal indicated that the test is repeatable at the same positions of fruit equator (cheek). A remarkable frequency signal was excited at 9-12 N force by a rubber tipped hammer. The dominant frequency was identified at the maximum response magnitude to assess the internal defect, and the result was not influenced by the distances between the defect borders and the excitation points. The sharp increase of defect mass could significantly affect the dominant frequency. Relationship between the dominant response frequency (fd) and the defect mass percentage (ω) was
characterized by an equation fd=410.649e-0.0833ω+261.947 with a good correlation coefficient (R2=0.925). A defect mass of
2.281% was determined as a discrimination threshold. Once the threshold exceeded 2.281%, the defective pear could be classified with a high accuracy rate of 96.7%. This finding would provide guidance for determining the optimal detecting time to the brownheart of Korla pears, according to the specific storage conditions when the vibration frequency spectrum method is deployed.
Keywords: nondestructive detection, vibration frequency spectrum, brownheart of Korla pear, internal defect, fruit quality
DOI: 10.3965/j.ijabe.20171002.1910
Citation:
Xu H B, Wu J, Wang Z P, Gao Y M, Wang Z P, Zhao Z Q. Discrimination of brownheart of Korla pear using
vibration frequency spectrum technique. Int J Agric & Biol Eng, 2017; 10(2): 259–266.
1 Introduction
Korla pear (Pyrus bretschneideri rehd) is a native
fruit in Xinjiang Autonomous Region of China. It is
Received date: 2015-04-29 Accepted date: 2017-02-03
Bigraphies: Xu Hubo, PhD candidate, research interests: nondestructive detection technology of agriculture and livestock products internal qualities, Email: [email protected]; Wang Zhaopeng, Master, research interests: agricultural machinery, Email: [email protected]; Gao Yongmao, Master, research interests: agricultural machinery, Email: [email protected];
Wang Zhipeng, Master, research interests: agricultural machinery, Email: [email protected]; Zhao Zhengqiang, Master, research interests: agricultural machinery, Email: [email protected].
*Corresponding author: Wu Jie, PhD, Professor, research interests: detection and safety of agriculture products. Mailing address: College of Mechanical and Electrical Engineering, Shihezi University, Shihezi 832003, Xinjiang, China. Tel: +86- 15809930329, Email: [email protected].
distinctive for its aroma, rich juicy flesh and crisp texture. However, brownheart is an internal defect frequently occurred in Korla pears, which is associated with late harvest, infection of latent bacteria, calcium deficiency,
climatic change, high CO2 concentration, and rapid
change of environment temperature from high to low
during storage[1]. The symptoms of this defect include
Over the last few decades, some nondestructive methods have been reported for internal defects detection of fruits and vegetables. Some attempts focused on using visible-near infrared spectroscopy to detect internal
defects in fruits[2-8]. Despite the satisfactory results they
showed, Fu et al.[9] pointed out that this method could not
completely meet the high demands on sensitivity and dynamic range of the detecting elements for industry requires getting enough light to transmit through a fruit in a short time. As nondestructive techniques, both nuclear magnetic resonance (NMR) and X-ray computed tomography (X-CT) are being widely used in the areas of disease diagnosis. The NMR method was used to detect
the apple defects[10-13] and internal disorders of
potatoes[14]. Similarly, X-CT method also was reported
on identification of the internal defects of some fruits and
vegetables such as apple[15,16], onions[17], chestnut and
pineapple[18]. However, the cost-effectiveness of these
two methods still needs to be assessed, improved and accepted by the industries.
It is worth noting that a mechanical or sonic impulse method based on fruit response to forced vibration has advantages in firmness evaluation. A few years ago, it was also reported on some commercial fruit firmness
testers[19,20]. Results from a study of Chen et al.[21]
showed that the defective tissue around the core or cavities in flesh resulted in decrease of fruit firmness, and the changes of frequency response spectrum. Considering this, a number of researchers have focused on the use of vibration response to detect the brownheart
of pear and apple[22,23], empty hazelnuts[24], hollows of
watermelon[25-27] and hollow heart of potato tubers[28,29].
However, there is still a problem in distinguishing slight brownheart in pears with the vibration response technique. In practice, all fruit producer, processors and packers expect to inspect brownheart pear as early as possible in order to reduce the chance of infect for pears without brownheart.
Therefore, the objectives of this research were to: (1) analyze the vibration spectrum response of Korla pear; (2) correlate the internal defect extent to the vibration spectrum parameter and (3) determine the defect discrimination threshold of Korla pears.
2 Materials and methods
2.1 Raw samples
Fresh Korla pears were hand-harvested on 20 September 2013 from an orchard in Korla city, Xinjiang Autonomous Region, China. Pears were selected for uniformity, and absence of damage. They were then
stored at –2oC-0oC and 85%-95% relative humidity (RH)
until use. Consistent properties of pear were ensured to eliminate the effects on vibration response (in Table 1).
Table 1 Material properties of Korla pear samples
Mass/g H/Da Firmness with
skin/kg
Soluble solids/°Brix
Moisture content (wet base)/%
110±2.50 1.20±0.03 3.83±0.18 11.38±0.14 87.82±0.55
Note: a Maximum height to diameter ratio representing pear shape.
2.2 Preparation of internal defective sample
In preliminary test, the pear tissue infected by penicillium more closed resembled the watery lesion symptom of brownheart. Also, penicillium can easily and effectively control the defect extent. Therefore, a penicillin strain was used to simulate pear brownheart in
this study based on the method of Su et al.[22]. It was
isolated from the moldy tissue of Korla pear under natural condition and cultured 7-14 d on PDA (potato 200 g, sucrose 20 g, aseptic water 1000 mL, pH natural) slant at 25°C. Then the spore was scraped into aseptic water with 0.05% Tween 80 aiming to make the spore suspend uniformly. A haemacytometer (XB-4-25, Medical equipment factory of shanghai medical instruments Co., Ltd., Shanghai, China) was used to count the number of spore by observation with an optical microscope (CX22, Olympus, Tokyo, Japan) for adjustment of
high-concentration to 2.0×10¹⁰ spore/mL.
The 200 µL spore suspension (concentration of
2.0×10¹⁰ spore/mL) was injected into the core of sample
through calyx with a 100 µL micro-injector (Gaoge
2.3 Vibration testing
2.3.1 Setup for testing and experimental conditions
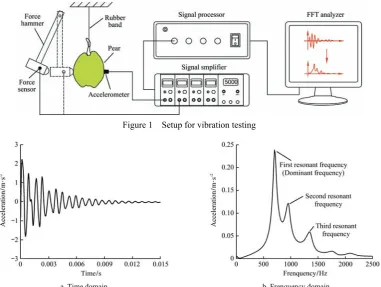
The vibration testing apparatus is shown inFigure 1.
Pear was suspended by a rubber band to allow free vibration. A mechanical impulse hammer model LC0408T with a micro-piezoelectric quartz force sensor model LC0505 (Lance Technologies LLC, Qinhuangdao, China) was used to excite the samples. A micro-piezoelectric accelerometer sensor (LC1305, Lance Technologies LLC, Qinhuangdao, China) adhered on the surface of pear equator received analog signal. The signal was amplified by a DLF-8 charge amplifier (Orient Institute of Noise & Vibration, Beijing, China) and then transformed into digitals by an INV306U-5160 signal processor (Orient Institute of Noise & Vibration, Beijing, China). The Coinv DASP software (V10 engineering edition, Orient Institute of Noise & Vibration, Beijing, China) was used to control the data acquisition process and transform the response from time domain to frequency domain by means of fast Fourier transform (FFT).
During the process of digital signal acquisition, the analytic frequency was set at 2.5 kHz. The sampling frequency was set at 6.4 kHz with 2048 sampling points per 0.32 s for each process. During the test, the
frequency resolution (Δf ) was set at 6.25 Hz considering
of both the acquisition range and the process accuracy of vibration signal for pear. The digital signal was weighed with exponential window function for its higher
signal-to-noise ratio[30]. The waveform in time domain
signal at the largest total effective value was searched using average mode as maximum keeping for spectrum analysis. The overlapping coefficient was set at 127/128 to get a better result. A typical acquisition signal in the time domain and its transformation to the frequency domain of Korla pears were demonstrated in Figure 2. Among the resonant frequencies, the first resonant frequency (response magnitude is the greatest) was defined as the dominant frequency of pear. It was extracted from all the signals to assess internal quality of fruit.
Figure 1 Setup for vibration testing
a. Time domain b. Frenquency domain
Figure 2 Typical signal of Korla pear
2.3.2 Location, tip material and force for excitation Before testing, all the pears were placed at room temperature for 24 h to equilibrate to experiment environment. Firstly, the accuracy and repeatability of
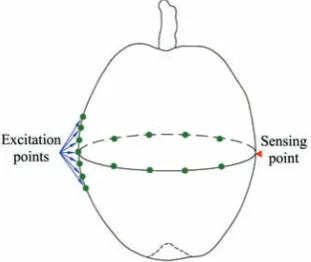
the sizes of pear and hammer tip, there were 7 points along the cheek in longitudinal direction and 10 points around the equator circle, which were equally distributed (Figure 3). After impulsive excitation, the defective samples were cut at the equator. As shown in Figure 4, distances from the border of defective tissue to the excitation points were measured by a radial line passed through the center of cutting plane, aiming to analyze whether the distances between different excitation locations and the border of disease tissue have influence on the vibration response. Meanwhile, the effects of tip material and excitation force on frequency response were tested. The hammer with rubber, steel, aluminum and nylon tips were used to excite fruit vibrations, and five forces (3 N, 6 N, 9 N, 12 N, 15 N) that would not cause pear damage were impacted.
Figure 3 Locations of hammer to excite vibration signal of Korla pear
Figure 4 Different distances from the border of disease tissue to the excitation points (mm)
2.3.3 Control experiment conducted on the defective pears
After the completion of above tests and data analysis,
200 pears were divided into treatment group (n=100) and
control group (n=100) randomly. The control group was
samples without defect and another group was treated
with spore suspension injection as described in Section 2.2. Both 10 pears without defect and 10 defective pears were randomly chosen and conducted the vibration testing at 12 hour interval. Each sample was tested three times to calculate the average values. After the testing, the disease samples were cut to observe the defect extent. The defective tissue was then completely taken out by a scalpel and weighed using an electronic balance (HK-TC-320AB, HUAKE Electronic Instrument Co. Ltd., Taiwan). The defect mass percentage of sample was calculated to assess internal defect extent of pear.
3 Results and discussion
3.1 Consistency analysis of the vibration spectrum response
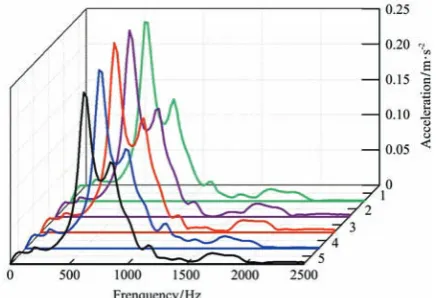
Figure 5 shows that the frequency spectrum curves
presented a good consistency at the same detection point on the equator region. This consistency also can be seen from the curves obtained by exciting different points at
the equator of pear(Figure 6).
a. Along the cheek in longitudinal direction
b. Around the equator circle
Figure 6 Fruit response to repeated excitation at the same point
Although small variations of the dominant frequency were detected, they were within the limit of frequency resolution (±6.25 Hz). This result indicates that the excitation points at the equator of the pear had little influence on frequency spectrum, which was in agreement
with the findings on pears and peach[31-34]. Additionally,
Figure 5b also showed that the frequency spectrum response presented no differences at any distance from the excitation point to the defective border. However, this finding does not agree with the microphone received
response for apple vibration[21]. Thus, the consistency
analysis confirmed that the vibration test was repeatable and the consistent readings could be obtained within a limited range of pear position.
3.2. Comparisons of response to different tip materials and excitation forces
Figures 7 and 8 present the response curves to
different excitation materials and forces, respectively. Apparently, the location of the dominant frequency was the same for all hammers and excitation forces. However, the hammer with nylon or aluminum tip excited very low amplitude, which may cause difficulties in the signal analysis. Although both rubber tipped and steel tipped hammer could excited higher amplitude than the hammer with nylon and aluminum tip, the rubber tipped hammer excited high frequencies more effectively than the steel tipped hammer. Meanwhile, the hard steel-tipped hammer would easily damage the flesh of fruits. Similarly, when the excitation forces of 3 N and 6 N were applied, the signals were weak and the approximate amplitude for all resonant frequencies was observed in spectrum response. Comparatively, the force ranged from 9 N to 15 N excited the dominant
frequency well in most cases. As fast identification of resonant frequency is important for online applications, so the hammer with rubber tip and the forces of 9-15 N were selected for the rest of the study.
Figure 7 Fruit response to excitation by a hammer with different tip materials
Figure 8 Fruit response to different excitation forces
3.3. Correlation of internal disease progression with vibration spectrum response
Figure 9 shows the regression line and the plot of the
dominant frequency fd versus storage time t. With the
storage time increased, the dominant frequency decreased
linearly for pear without defect (R2=0.709) whereas it
showed an exponential decrease for defective pear
(R2=0.925). These changing tendencies are consistent
with the result found by Su et al.[22] for apples. The
general forms are expressed by the following equations, respectively:
fd=–1.244t+68.675 (1)
fd=–367.852e0.00555t+1076.427 (2)
spectrum technique to identify defective pears from pears without defect.
Figure 9 Dominant frequency changes with storage time at 25°C and 80% RH for defective/normal pears
Actually, the internal defect progression of pear is influenced by external conditions such as temperature,
humidity, pear respiration intensity, CO2 concentration,
etc. Therefore, the storage time can not objectively and exactly evaluate the extent of defect. Considering this, the
defect mass percentage ω of pear was introduced as an
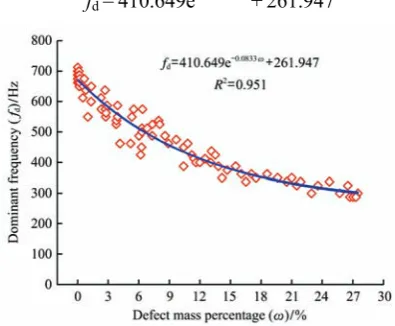
objective measurement. Then, a good exponential relationship between dominant frequency and defect mass percentage was obtained with a high correlation
(R2=0.951) by the following equation (Figure 10):
fd =410.649e-0.0833ω+261.947 (3)
Figure 10 Relationship between the dominant response frequency and the defect mass percentage of pear
3.4. Determination of defect discrimination threshold It can be seen from Figure 9 that there was a data overlapping region of pears without defect and defective pears at about 36 h of storage time. However, the internal defect was difficult to be distinguished at this region. After 36 h, the differences between the testing data of two sample groups became larger. Even so, it
does not mean the disease is surely discriminated for the
limitation of the frequency resolution (Δf=6.25 Hz) of the
testing system. The critical time for defecting discrimination was obtained by the Equations (1) and (2) at frequency 6.25 Hz. As a result, the value of 30.8 h was got as a given storage time for preparation of the defective pears according to the procedure described above. Then, the statistical result of defect mass percentage at 30.8 h was 1.807%-2.281% (2.044%± 0.237%).
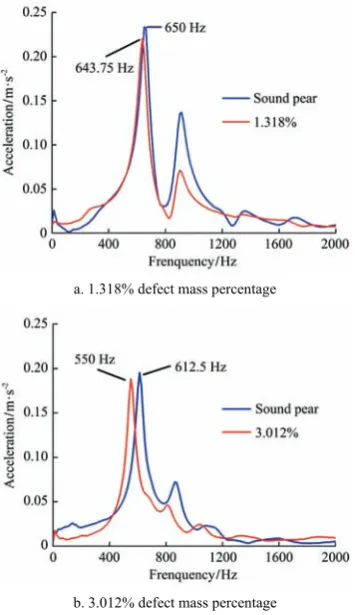
To validate this range, 90 samples with different defect extent (<1.807%, 1.807%-2.281%, >2.281%) were
detected. As shown in Figure 11, the sample with
Therefore, it can be concluded that the defect mass percentage of 2.281% is appropriate for mechanical impulse testing system to be used as a discrimination threshold of Korla pear. The discrimination threshold is defined as critical value. Only when the defect mass percentage exceeding the limit, brownheart of fruit can be detected. In future study, it can be applied to determine the corresponding optimal time according to the specific storage conditions of pear for defect detection as early as possible.
a. 1.318% defect mass percentage
b. 3.012% defect mass percentage
Figure 11 Comparisons of frequency spectrum curves of the pear with different mass percentage defect with that of the pear without
defect
Table 2 Accuracy rate of pear with internal defect
Defect mass percentage/% <1.807 1.807-2.281 >2.281
Accuracy rate/% 3.0 12.5 96.7
4 Conclusions
A vibration testing system, including a hammer on impulse excitation and an accelerometer on sensing signal was applied to non-destructively detecting the brownheart of Korla pear. The dominant frequency of the highest peak in frequency spectrum was extracted from the signal to assess the internal quality of pears. Frequency analysis shows that the consistent signal could be
acquired at any positions of the equator region for pear fruit, and exerting little influence on the signal regardless of the distances between the excitation points and the border of the disease tissue. The rubber tip is able to excite a good frequency signal when a force in the range of 9-12 N is exerted. Relationship between dominant
frequency (fd) and mass percentage (ω) of the defect of
pears could be characterized by the regression equation
fd=410.649e-0.0833ω+261.947, with a good correlation
coefficient of R2=0.951. Discrimination threshold for
the detecting of the brownheart of Korla pear appears as 2.281% and the accuracy rate of the defective pears could reach 96.7%, when the percentage of the defected mass is above 2.281%.
Acknowledgements
The research presented in this paper was financed by National Natural Science Foundation of China (No. 31560476) and Specialized Research Fund for the Doctoral Programs of Xinjiang (No. 2013BB011). The authors thank Dr. Liu Qian of China Orient Institute of Noise & Vibration (Beijing, China) for his helpful suggestions and support.
[References]
[1] Hao L P, Kou X H. Relationship between postharvest core browning of pear fruit and change of cell membrane structure. Plant Physiology Communications, 1998; 34(6): 471–474. (in Chinese)
[2] Upchurch B L, Throop J A, Aneshansley D J. Detecting internal breakdown in apples using interactance measures. Postharvest Biology and Technology, 1997; 10(1): 15–19. [3] Han D H, Liu X X, Zhao L L, Wang Z Y, Tu R L. Research
of nondestructive detection of apple watercore by optical means. Transactions of the CSAM, 2004; 35(5): 143–146. (in Chinese)
[4] Han D H, Tu R L, Lu C, Liu X X, Wen Z H. Nondestructive detection of brown core in the Chinese pear ‘Yali’ by transmission visible–NIR spectroscopy. Food Control, 2006; 17(8): 604–608.
[5] Zerbini P E, Grassi M, Cubeddu R, Pifferi A, Torricelli A. Nondestructive detection of brown heart in pears by time resolved reflectance spectroscopy. Postharvest Biology and Technology, 2005; 25(1): 87–97.
on energy spectrum of visible/near infrared transmittance. Spectroscopy and Spectral Analysis, 2008; 28(9): 2098–2102.
[7] Clark C J, McGlone V A, Jordan R B. Detection of brownheart in Braeburn apple by transmission NIR spectroscopy. Postharvest Biology and Technology, 2003; 28(1): 87–96.
[8] McGlone V A, Martinsen P J, Clark C J, Jordan R B. On-line detection of brownheart in Braeburn apples using near infrared transmission measurements. Postharvest Biology and Technology, 2005; 37(2): 142–151.
[9] Fu X P, Ying Y B, Lu H S, Xu H R. Comparison of diffuse reflectance and transmission mode of visible-near infrared spectroscopy for detecting brown heart of pear. Journal of Food Engineering, 2007; 83(3): 317–323.
[10] Barreiro P, Ortiz C, Ruiz-Altisen, M, Ruiz-Cabello J, Fernández-Valle M E. Mealiness assessment in apples and peaches using MRI techniques. Magnetic Resonance Imaging, 2000; 17(2): 275–281.
[11] Defraeye T, Lehmann V, Gross D, Holat C, Herremans E, Verboven P, et al. Application of MRI for tissue characterisation of ‘Braeburn’ apple. Postharvest Biology and Technology, 2013; 45(1): 96–105.
[12] Clark C J, Richardson C A. Observation of watercore dissipation in Braeburn apple by magnetic resonance imaging. New Zealand Journal of Crop and Horticultural Science, 1999; 27(1): 47–52.
[13] Margheto N, Hills B. MRI as a potential on-line sensor of apple quality. Information and Technology for Sustainable Fruit and Vegetable Production, 2005; 5: 455–464.
[14] Thybo A H, Jespersen S N, Larke P E, Stødkilde-Jørgensen H J. Nondestructive detection of internal bruise and spraing disease symptoms in potatoes using magnetic resonance imaging. Magnetic Resonance Imaging, 2004; 22(9): 1311–1317.
[15] Schatzki T F, Haff R P, Young R, Can I, Le L C, Toyofuku N. Defect detection in apples by means of X-ray imaging. Transactoins of the ASABE, 1997; 40(5): 1407–1415. [16] Ogawa Y C, Kondo N S, Shibusawa S. Internal quality
evaluation of fruit with X-ray CT. Shokubutsu Kankyo Kogaku, 2005; 17(2): 75–83.
[17] Tollner E W, Gitaitis R D, Seebold K W, Maw B W. Experiences with a food product X-ray inspection system for classifying onions. Applied Engineering in Agriculture, 2005; 21(5): 907–912.
[18] Donis-Gonazález I R, Guyer D E, Pease A, Barthel F. Internal characterization of fresh agricultural products using traditional and ultrafast electron beam X-ray computed tomography imaging. Biosystems Engineering, 2014; 117(1): 104–113.
[19] Shmulevich I, Galili N, Rosenfeld D. Detection of fruit firmness by frequency analysis. Transactions of the ASABE, 1996; 39(3): 1047–1055.
[20] Peleg K. Development of a commercial fruit firmness sorter. Journal of Agricultural Engineering Research, 1999; 72(3): 231–238.
[21] Chen H, Duprat F, Grotte M, Loonis D, Pietri E. Influence of the apple defect on the frequency response spectra during nondestructive acoustic sensing of fruit firmness. Internal Agrophysics, 1995; 9: 143–151.
[22] Su Z P, Tu K, Zou X R, Jing W, Pan L Q. Detection of internal defect in apples by acoustic impulse technique. Science and Technology of Food Industry, 2008; 29(7): 235–238. (in Chinese)
[23] Yang J L, Tu K, Pan L Q, Shao X F. Nondestructive inspection of Niitaka pear quality based on acoustic impulse response. Jiangsu Journal of Agricultural Sciences, 2008; 24(2): 179–184. (in Chinese)
[24] Onaran I, Dulek B, Pearson T C, Yardimci Y, Cetin A E. Detection of empty hazelnuts from fully developed nuts by impact acoustics. Transactions of the ASABE, 2004; 49(6): 1971–1976.
[25] Ay C. Acoustic evaluation of watermelon internal quality-maturity and cavity existence and orientation. Journal of Agriculture Science, 1996; 5(4): 57–69.
[26] Diezma-Iglesias B, Ruiz-Altisent M, Barreiro P. Detection of internal quality in seedless watermelon by acoustic impulse response. Biosystems Engineering, 2004; 88(2): 221–230.
[27] Diezma-Iglesias B, Ruiz-Altisent M, Jancsok P. Vibrational analysis of seedless watermelons: use in the detection of internal hollows. Spanish Journal of Agricultural Research, 2005; 3(1): 52–60.
[28] Jivanuwong S. Nondestructive detection of hollow heart in potatoes using ultrasonics. MSC thesis, Faculty of the Virginia Polytechnic Institute and State University, Virginia, United States, 1998; 86p.
[29] Elbatawi I E. An acoustic impact method to detect hollow heart of potato tubers. Biosystems Engineering, 2008; 100(2): 206–213.
[30] Fladung W, Rost R. Application and correction of the exponential window for frequency response functions. Mechanical Systems and Signal Processing, 1997; 11(1): 23–36.
[31] Galili N, Shmulevich I, Benichou N. Acoustic testing of avocado for fruit ripeness evaluation. Transactions of the ASAE, 1997; 41(2): 399–407.
[32] Wang J, Teng B, Yu Y. The pear dynamic characteristics and the firmness detection. European Food Research and Technology, 2004; 218(3): 589–594.
[33] Wang J, Teng B, Yu Y. The firmness detection by excitation vibration characteristics for peach. Food Control, 2006; 17(5): 353–358.