EXPERIMENTAL AND EXPEDITIONARY STUDIES
Laboratory Studies of Main Component Composition
of Hyperhaline Lakes
N. Yu. Andrulionis*, P. O. Zavialov
Shirshov Institute of Oceanology, Russian Academy of Sciences, Moscow, Russian Federation *[email protected]
Introduction. Composition of water is an important hydrochemical characteristic of a salt water body. It is very important in shaping the conditions for the ecosystem functioning. This factor should be taken into account in determining water salinity since salinity measurements carried out by the standard oceanographic equipment using electrical conductivity in the water where the ion ratio is different from that in the oceanic water results in significant errors.
Data and methods. The present paper describes the analytical methods for laboratory determining the chlorides, sulfates, calcium, magnesium and total dissolved inorganic carbon concentrations using potentiometric titration, the potassium content – by the gravimetric method. These methods are adapted for hyperhaline waters having the different ion-salt composition as compared with the oceanic one. The method’s error (relative deviation) did not exceed 1.7% for halogens, 4% for sulfates, 1.5% for carbonate ions, 0.7% for bicarbonate ions, 4% for calcium ions, 3.2% for magnesium and 1.3% for potassium.
Results. The components of main chemical composition of the hyperhaline reservoirs, namely the Aral and Dead seas, and Lake Urmiawere obtained. Salinity of these water bodies represented by total amount of the basic ions were determined.
Discussion and conclusion. The natural basins under study represent the terminal lakes characterized by high water salinity, which is many times higher than that of the ocean water. The ratios of the main ions in the sources under study differ from each other significantly as well as from the similar ratios in the world ocean.
Keywords: ion composition, basic ions, automatic potentiometric titrator, Metrohm Titrando 905, hyperhaline lakes, the Aral Sea, the Dead Sea, the Lake Urmia.
Acknowledgments: the research is carried out under the support of the Ministry of Education and Science of the Russian Federation, Agreement No. 14.W03.31.0006 (sampling), as well as within the framework of the State Assignment, theme No. 0149-2019-0003 (data analysis). The authors are grateful to Dr. E. V. Yakushev for providing samples from the Lake Urmia and Dead Sea.
For citation: Andrulionis, N.Yu. and Zavialov, P.O., 2019. Laboratory Studies of Main Component Composition of Hyperhaline Lakes. Physical Oceanography, [e-journal] 26(1), pp. 13-31. doi:10.22449/1573-160X-2019-1-13-31
DOI: 10.22449/1573-160X-2019-1-13-31 © 2019, N. Yu. Andrulionis, P. O. Zavialov © 2019, Physical Oceanography
Introduction
conductivity in the water where the ion ratio is different from that in the oceanic water results in significant errors.
In some cases, the necessity of analyzing the composition of the waters of hyperhalinе natural objects appears. These are lakes or other water bodies having mineralization (salinity) many times higher than the values characteristic of the ocean and its seas. Laboratory study of such waters has its own features.
History of the physicochemical state variations of the considered hyperhalinе lakes have been studied by scientists for a long time. The results of these observations were published in a number of scientific papers. Historic records on the main component composition of the Aral Sea waters from 1952 to 1985 are given in the study [1, p. 102−103],for 2002−2009 – in [2, p. 78−79], the Dead Sea waters from 1959 to 1979 – in [3, p. 481] and for 2002 – in the report* and Lake Urmia for 2002 and 2008 – in [4, 5].
Based upon the available literature, the potentiometric method has not been previously used to analyze the ion-salt composition of hyperhalinе reservoirs. The present paper represents the methods for determining the components of the ion-salt water composition when applying potentiometric titration, adapted to the study of water samples of hyperhalinе reservoirs, using the example of the Aral Sea (western basin of the Southern Aral), the Dead Sea (northern basin) and Lake Urmia (northern part). The existing techniques modified to reflect the high salinity and characteristics of the salt composition of the studied samples were taken as the basis. Salinity of the analyzed samples taken during expeditions in 2017 ranged from 140 to 328 g/kg. The main advantages of potentiometric titration are high sensitivity and accuracy, ease of use, selectivity, the minimum amount of reagents required, as well as the quickness of the analysis. Potassium ions were measured by the gravimetric method. Concentration of sodium ions was established by calculating the difference between known amounts of anions and cations [6]. Comparative description of the considered lakes was also carried out. The data obtained was compared with the literature data of the ionic composition of the Standard Seawater [7, p. 60].
1. Equipment
The high-end potentiometric titrator Metrohm 905 Titrando (Switzerland) was appliedto determine the ion composition. It is completed with indicator electrodes that record the change in the electrode potential at the equivalence point (the end point of the titration) during the titration process**. Electrodes are selected according to the type of the reaction and the ion to be detected. The measuring system allows carrying out any potentiometric titration, measuring the pH, electrode potential and temperature of the sample, as well as determining the concentration of anions and cations with high accuracy.
* Esakov, S., ed., 2011. Dead Sea Study: Final Report. Tel Aviv, pp. 31-36. Available at: http://siteresources.worldbank.org/INTREDSEADEADSEA/Resources/Dead_Sea_Study_Final_August_2 011.pdf [Accessed: 14 January 2019].
The mass of the sample under analysis was measured by weighing on a laboratory analytical balance of the first accuracy class with an error of 0.001 g. Deionized water was used to dilute all reagents and samples. It was obtained using a laboratory deionizer. The conductivity of this water is less than 0.2 µS/cm. The reaction medium of the solutions during the analysis was monitored using a Metrohm combined pH electrode.
2. Methods
The existing methods for determining ions in sea and drinking water were modified based on the chemical composition of the waters of the considered water bodies: the samples were diluted with different proportions by deionized water, concentrations of reagents were increased, reagents or procedures recommended by the basic method were excluded or replaced. The optimal sample volume for each analysis was determined empirically depending on the sample salinity.
2.1. Chlorinity determination
During the titration, poorly soluble compounds of silver halides are formed, the sum of which is called chlorinity (Cl). To determine the content of chlorides in drinking water (in a neutral or slightly alkaline environment), precipitation titration is done using indicators to determine the end point of the titration. Samples with the content of chlorine ion above 10 mg/dm3 are titrated with silver nitrate in the presence of potassium chromate, while those with the content of chlorine ion below 10 mg/dm3, with mercury nitrate in the presence of diphenylcarbazone indicator *. To determine the chlorinity of seawater, titration with silver nitrate in the presence of potassium chromate ** is used. In the work of foreign authors [8], the end determination point description of the titration potentiometric method is given.
The most common method for determining in seawater is the method of precipitation titration with silver nitrate (AgNO3) with potentiometric determination
of the end point of titration [8, 9]. It was applied to determine the chlorinity content of water in samples of hyperhaline lakes. For fixation, a Metrohm Ag Titrode combined electrode was used. It contains a silver ring membrane and a pH electrode as a reference. Metrohm Ag Titrode is suitable for the titration of chlorides, bromides, iodides, sulfides, mercaptans and cyanides (at constant pH values), for example, with silver nitrate. Used reagents are listed in Tab. 1.
The required amount of water for the sample (for the Aral Sea — 1 g, for the Dead Sea and Lake Urmia — 0.2–0.45 g) was placed in a measuring glass beaker. The sample was weighed on an analytic balance and its weight was recorded. The sample was refilled with deionized water to the 100 ml mark and titrated with a solution of AgNO3 with a molar concentration of 0.1 mol/l (M).
* Gosstandart, 1994. GOST 4245-72. Voda Pit'evaya. Metody Opredeleniya Soderzhaniya Khloridov [State Standart 4245-72. Drinking Water. Methods for the Determination of Chloride Content]. Moscow: IPK Izdatel'stvo standartov, 5 p. (in Russian).
T a b l e 1
Concentrations of the reagent solutions for chlorinity determining
Name of reagent Solution concentration
AgNO3 0.1 mol/l
Standard volumetric solution HCl 0.1 mol/l
Analytical standard (AS) of composition of chloride-ion solution
1 mg/ml
Deionized water, conductivity is lower than 0.2 μkS/cm
Fig. 1 shows an example of a titration curve illustrating the dependence of the electrode potential (U, mV) on the volume of titrant added (V, ml). The end point (equivalence point) EP1, marked on the graph, which is determined by the maximum of the first derivative of the titration function. An Equivalence point recognition criterion (ERC) value is a criterion for recognizing an equivalence point.
а b
F i g. 1. Titration graphs at determining chlorinity content with the end point ЕР1: а − 0.1M HCl
solution; b − water sample from the Aral Sea. Blue line denotes the titration curve (change of the electrode potential); red line – the ERC titration function derivative
The result was calculated by the following formula
,
= 1 AgNO Cl
Cl
3
m K M C V
C EP
where CCl is halogen ion concentration (chlorinity), g/kg; VEP1 is the volume of
titrant, followed by titration to the EP1 determination point, ml;
3
AgNO
C is the titrant concentration, mol/l; МCl is Cl⁻ ion molar mass; m is the considered sample
mass, g; К is the correction factor.The correction factor for the solution of the AgNO3
titrant concentration of 0.1 mol/l was determined by the hydrochloric acid (HCl) solution titration of the same molar concentration*.
It was experimentally established that the pH value of the solution during the titration within the required volume (10 ml) varies slightly (by 0.05) and linearly. Therefore, a change in pH does not have a significant effect on determining the equivalence point based on the maximum of the derivative of the titration function. NaCl or KCl can also be used to determine the titer correction.
2.2. Determination of sulfates
The classical methods for determining sulfates in standard sea water are the gravimetric method [8], based on precipitating sulfate ions by barium chloride and by weighing the resulting barium sulfate sediment, the chromatographic method and the potentiometric method of the back titration of excess barium ions after precipitation as BaSO4. In drinking water, the concentration of sulfate ions is
determined by titration with Trilon B (EDTA) in the measurement range from 25 to 500 mg/dm3, barium chloride in the measurement range from 10 to 2500 mg/dm3 and by turbidimetry in the measurement range from 2 to 50 mg/dm3*, as well as by the method of back titration of excess barium ions using complexometric titration with Trilon B (EDTA)**.
In this work, the barium chloride direct titration method was applied to determine the content of sulfate ions in the samples under study with the registration of the end point of the titration with a potentiometric ion-selective membrane electrode ECOM-Va*** produced by RPP Econix (Russian Federation) in combination with a reference electrode. At the equivalence point, if an excess of barium ions occurs in the solution, the electrode potential sharply rises, which is fixed by the electrode.
To form a stable barium sulfate sediment, the titration was carried out in an aqueous-alcoholic and acidic medium with pH = 2. The reagents used for the determination of sulfate ions and their concentrations are listed in Tab. 2
The correction factor (titer) was determined to bring the concentration of barium chloride solution to 0.1 mol/l by titration with a solution of the magnesium sulfate (MgSO4) with a molar concentration of 0.1 mol/l. The titer was set for each
new solution of titrant. This correction was used when calculating the result according to GOST 31940-2012. Preparation of water samples for titration was carried out according to this GOST requirements. The Aral Sea water samples of 1–5 g, the Dead Sea and Lake Urmia of 0.5 g were placed in a measuring beaker. The sample was weighed on a laboratory analytic balance and its mass was recorded. 20 ml of ethyl alcohol was added to the sample and adjusted with 0.1M hydrochloric acid with a volume of 1–2 ml to pH = 2. Then it was topped up with 80 ml of deionized water and titrated with constant mixing to the equivalence point. The equivalence point was determined using a barium selective electrode.
* Gosstandart, 2013. GOST 31940-2012. Voda Pit'evaya. Metody Opredeleniya Soderzhaniya Sul'fatov [State Standart 31940-2012. Drinking Water. Methods for Determination of Sulfate Content]. Moscow: Standartinform, 16 p. (in Russian).
** Metrohm, 2004. Food PAC 6.6055.003. Methods for the Titrimetric/Potentiometric Analysis of Foodstuffs : Application File.
T a b l e 2
Concentrations of the reagent solutions for determiningsulfates
Name of reagent Solution concentration
2-water Barium chloride (BaCl22H2O) Standard volumetric solution HCl
Magnesium sulphate (standard titer) MgSO4
Analytical standard (AS) of composition of chloride-ion solution Ethyl alcohol
Deionized water, conductivity is lower than 0.2 μkS/cm
0.1 mol/l 0.1 mol/l 0.1 mol/ 1mg/ml 95%
Fig. 2 shows an example of a titration curve for a 0.1 M solution of MgSO4
with the determination of the end point (equivalence point) EP1, which is determined by the maximum of the first derivative of the titration function and shows that the number of equivalents of the added EDTA titrant is equal to the number of equivalents of sulfate ions.
a b
F i g. 2. Titration graphs with the end point (ЕР1): а − 0.1M MgSO4 solution; b − water sample from
the Urmia Lake. Blue line denotes titration curve (change of the electrode potential); red line – derivative of the ERC titration function
The sulfate ion concentration was calculated by the following formula
,
-2 4 2
-2 4
SO BaCl 1
SO m
K M C
V
C EP
(2)
where 2 -4
SO
C is the sulfate ion concentration; VEP1 is the volume of titrant, followed
by titration to the point of determination, ml;
2
BaCl
C is the barium chloride titrant
concentration, mol/l; 2 -4
SO
M is the sulfate ion molar mass; m is the studied sample mass, g; К is the correction factor.
2.3. Determination of calcium and magnesium
The method of complexometric titration with a solution of EDTA (Trilon B, ethylene diamine tetraacetic acid disodium salt Na2H2Y2H20) in an alkaline medium
complexation, which results in the formation of sufficiently stable complexes [10, p. 49]. Since the Са²⁺ and Mg²⁺ ions have different stability factors*, first complexones with calcium and then with magnesium with the appearance of two equivalence points are formed. The points were determined using a Metrohm calcium-selective membrane electrode. The advantage of this method is that it allows both calcium and magnesium to be determined with great accuracy in a single titration process. The reagents used are presented in Tab. 3
T a b l e 3
Concentrations of the reagent solutions for determining calcium and magnesium
Name of reagent Solution concentration
Trilon B (EDTA)
Standard volumetric solution HCl
Magnesium sulfate (standard-titer) MgSO4 Ammonia buffer (NH4Cl + NH4OH)
AS of composition of calcium ion water solution (Ca²⁺)
AS of composition of magnesium ion water solution (Mg²⁺ )
Deionized water, conductivity is lower than 0.2 μkS/cm
0.1 mol/l 0.1 mol/l 0.1 mol/l pH = 10
1 mg/ml 1 mg/ml
The correction factor (titer) to bring the concentration of the EDTA solution to 0.1 mol/l was determined by titrating the MgSO4 solution with a molar
concentration of 0.1 mol/l prepared from standard titer**. The titer was taken into account when calculating the result.
Ammonia buffer with pH = 10 was prepared by introducing into a volumetric flask with a volume of 1000 ml 20 g of ammonium chloride, 100 ml of deionized water and 100 ml of a solution of an aqueous ammonia with a mass fraction of 25%***.
For the Aral Sea samples, a sample of 1 g was taken, for the Dead Sea and Lake Urmia – of 0.5 g. A sample of 3 ml of ammonia buffer was added to maintain pH = 10 and topped up with deionized water up to a volume of 80 ml. The pH of the finished sample was measured and titrated with EDTA solution with a concentration of 0.1 mol/l to the second equivalence point. For fixing the end point, a combined Metrohm scION Tip Ca ion-selective polymembrane electrode, equipped with interchangeable tips in combination with a reference electrode, was used. The result for ion concentration was calculated by the formulas below
* Yakovlev, K.I. and Stetsenko, A.I., eds., 2003. Kompleksonometricheskoe Titrovanie [Complexometric Titration]. In: Metodicheskie Ukazaniya k Vypolneniyu Laboratornykh Rabot po Kursu Kolichestvennogo Khimicheskogo Analiza [Methodical Instructions for Laboratory Work in the Course of Quantitative Chemical Analysis]. Saint Petersburg: SPKHFA, pp. 8-39.
** Metrohm, 2004. Food PAC 6.6055.003. Methods for the Titrimetric/Potentiometric Analysis of Foodstuffs : Application File.
m
K M C
V V
C EP EP
2 2
Mg ЭДТА 1
2 Mg
) (
(3)
,
2 2
Ca ЭДТА 1 Ca
m
K M C
V
C EP (4)
where CCa²⁺, СMg²⁺ are the concentrations of calcium and magnesium; VEP1 is the
volume of titrant, followed by titration to the first point of determination, ml; VEP2
is the volume of titrant, followed by titration to the second point of determination, ml; CEDTA is the EDTA (titrant) concentration, mol/l; МCa²⁺, МMg²⁺ is the molar mass of calcium and magnesium ions; m is the sample mass, g; K is the correction factor.
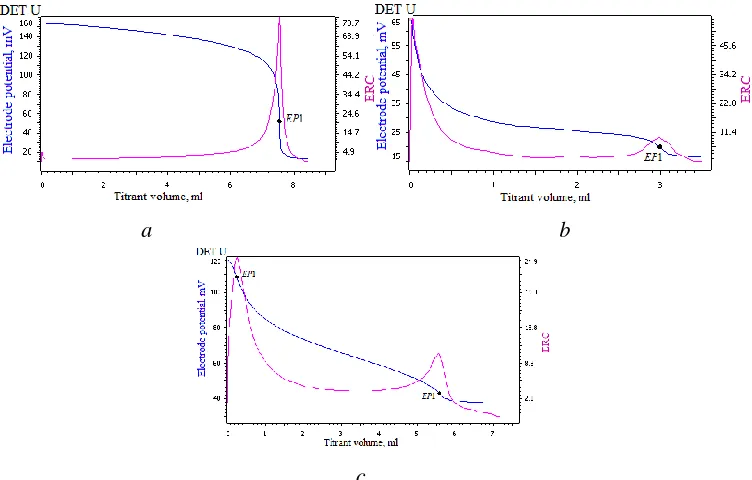
a b
c
F i g. 3. Determination of the end points of calcium ЕР1 and magnesium ЕР2 by the example of titration: а − AS of composition of the calcium ion water solution (Ca²⁺ ); b − AS of composition of the magnesium ion water solution (Mg²⁺); c − water sample from the Aral Sea. Blue line denotes titration curve (change of the electrode potential); red line – derivative of the ERC titration function
Fig. 3c shows an example of a titration curve of the Aral Sea sample with end points EP1 and EP2, which are determined from the maximum of the first derivative of the titration function.
2.4. Determination of total inorganic dissolved carbon and total alkalinity
In order to determine the contribution of total dissolved carbon (TCO2) to the
was measured. The obtained value was calculated as HCO3, since the proportion of
bicarbonate ions in the carbonate system of seawater is about 90% [6].
To characterize the components of the carbonate system in seawater, it is necessary to measure at least two of the four parameters (pH, total alkalinity, total dissolved inorganic carbon and partial pressure of carbon dioxide (pCO2) [6].
In the samples under study, total dissolved carbon and total alkalinity (АТ)
were determined by acid-base titration. Total carbon was measured in mmol/kg and calculated in g/kg as a bicarbonate ion. The method is based on the titration of the sample with a strong acid without removing the carbon dioxide produced [6, p. 274−276] until two equivalence points appear. In the process of direct titration of the sample with a solution of hydrochloric acid, a change in the concentration of hydrogen ions [H+] or pH occurs. This change is fixed by the pH indicator electrode (Fig. 4).
a b
F i g. 4. Determination of the end points ЕР1 and ЕР2 by the example of titration of the samples: а −
made of the standard-titers of 0.1M solution K2CO3 + 0,1М NaHCO3; b − from the Aral Sea. Blue
line denotes titration curve (change of the electrode potential); red line – derivative of the titration function ERC
The reagents used to determine TCO2 and AT are listed in Tab.4. In the case of
preparing the HCl solution from concentrated acid (not from a standard-titer), it is necessary to determine the correction factor*.
T a b l e 4
Concentrations of the reagent solutions used for determining total dissolved carbon and total alkalinity during titration
Name of reagent Solution concentration
Standard volumetric solution HCl
NaHCO3
Standard volumetric solution K2CO3
Deionized water, conductivity is lower than 0.2 μkS/cm
0.1 mol/l
0.1 mol/l
0.1 mol/l
________________
For the Aral and Dead Seas, a 10 ml water sample was taken while Lake Urmia sample was not analyzed. The sample was weighed on an analytic balance and its weight was recorded, then it was topped up with deionized water to a volume of 100 ml and titrated with a solution of 0.1M HCl to the second equivalence point. The points were determined using a Metrohm pH electrode calibrated according to the instruction manual for the electrode. Total alkalinity was calculated by the following formula
m C V
A ( EP2 HCl) T
, (5)
total carbon content - according to the formulas [6, p. 276]
, )
( 2 1 HCl
CO2
m C V V
CT EP EP
(6)
,
3 2
2 CO HCO
CO C M
mT T (7)
where АТ is the total alkalinity, mmol/kg; ТCO2 is the total carbon concentration,
mmol/kg;
2
CO T
m is the total carbon mass, expressed by HCO equivalent, g/kg; -3 VEP1 is the volume of titrant that went to the titration to the first point, ml VEP2 is the
volume of titrant that went to the titration to the second point, ml; СHCl is HCl
(titrant) concentration, mol/l;
3
HCO
M is the molar mass of bicarbonate ion; m is the sample mass in grams.
It should be noted that borate alkalinity (B(OH)4), being 2.9% of the total
alkalinity in sea water, is also titrated to the first point [6]. The results of determining the total alkalinity and total carbon are presented in Tab. 7
2.5. Determination of potassium
The potassium concentration in the considered samples was determined by the gravimetric (weight) method described in GOST 23268.7-78*, as well as in [8, 9], based on the subsidence of potassium ions with sodium tetraphenyl borate Na[B(C6H5)4]. It allows determining the concentration of potassium ions in the sample
with great accuracy. A list of reagents and their concentrations are given in Tab.5.
T a b l e 5
Concentrations of the reagent solutions used for determining potassium by the gravimetric method
Name of reagent Solution concentration
Sodium tetrapheniylborate solution Standard volumetric solution HCl
AS of composition of potassium ion water solution Deionized water, conductivity is lower than 0.2 µkS/cm
3% 0.1 mol/l 0.1 mol/l
3 to 10 ml of the analyzed water was taken in a way that it contained 20– 40 mg of potassium ions. A sample of the Aral Sea water was taken with a volume of 10 ml, the Dead Sea one – 4 ml and one of Lake Urmia – 3 ml. The sample was weighed, and its weight was recorded on an electronic balance. The sample volume was topped up to 100 ml with deionized water, 4 ml of 1M HCl solution was added. The resulting sample was cooled to 0−2°C. Then 15 ml of 3% sodium tetraphenyl borate solution was added dropwise with stirring. Then it was cooled again to 0−2°C for 10 min to form a more stable sediment. The sediment formed was filtered through crucible filter No. 3 or No. 4, previously weighed to constant weight. The crucible filters with the sediment were dried at 110°C, cooled in a desiccator and weighed to constant weight [8]. Measurements for each sample were carried out at least two times. The absolute deviation did not exceed 4%. The concentration calculations were carried out according to the following formula
, 1000 109 , 0
осд
K m
m
C (8)
where СК⁺ is the potassium concentration, g/kg; mосд is the sediment mass, g; 0.109
is the conversion factor for potassium; m is the sample mass, g.
2.6. Determination of sodium
Sodium was determined as the difference between the sum of anions and cations in mole equivalents [6] and then recalculated in g/kg according to the formula below
,
Na Na
Na M cM
C (9)
where СNa⁺ is the ion concentration, g/kg; МNa⁺ is the ion molar mass; cMNa⁺ is the sodium ion concentration, mole equivalent.
2.7. Testing of the accuracy of basic ions determination methods
T a b l e 6
Results of testing the methods used for determining the ions by measurements of the corresponding standard titers and as of the corresponding ions
Assessment of errors
Ions
Сl⁻ 2
-4
SO CO23- HCO-3 Са²⁺ Mg²⁺ К⁺
when measuring standard titers
Absolute deviation,
g/l < 0.23 < 0.06 < 0.09 < 0.04 < 0.16 < 0.03 < 0.05
Relative divergence,
% < 0.65 < 0.58 < 1.49 < 0.70 < 4.00 < 1.16 < 1.30
when measuring AS
Absolute deviation,
g/l < 0.02 < 0.06 < 0.09 < 0.04 < 0.06 < 0.03 <0.05
Relative divergence,
% < 1.70 < 4.00 < 1.50 < 0.70 < 4.00 < 3.20 < 1.30
3. Application of ion determination methods to study Chemical composition of water of hyperhaline reservoirs
As noted above, the methods were used to study the ionic composition of the following water bodies: the Aral Sea, the Dead Sea and Lake Urmia. Samples of their water were obtained in 2017. The Aral Sea water samples were taken in the western basin of the Big Aral (Uzbekistan) at the end of October 2017 (two samples from the surface and one from a maximum depth of 29 m), the Dead Sea water samples (Israel) – in the northern part from the surface of the water body (one on 02.08.2017 and two on 8.10.2017). A sample of Lake Urmia (Iran) water was obtained from the reservoir surface in its northern part on 28.08.2017. Sampling and storage of samples was carried out in accordance with GOST 17.1.5.04-81 *, GOST 17.1.5.05-85 **, DD 52.10.743-2010 ***. Samples were delivered to the laboratory within 2–3 days. The results of the analysis of the main ions of the considered lakes, calculated as average for five measurements, are presented in Tab. 7. Fig. 5 shows examples of ion concentrations as a percentage of the total salinity of the samples and their sulfate-chloride ratios.
* Gosstandart, 2003. GOST 17.1.5.04-81. Okhrana Prirody (SSOP). Gidrosfera. Pribory i Ustroystva dlya Otbora, Pervichnoy Obrabotki i Khraneniya Prob Prirodnykh Vod. Obshchie Tekhnicheskie Usloviya [State Standart 17.1.5.04-81. Nature Conservation. Hydrosphere. Devices and Devices for the Selection, Primary Processing and Storage of Samples of Natural Waters. General Technical Conditions]. Moscow: IPK Izdatel'stvo standartov, 7 p. (in Russian).
** Gosstandart, 2003. GOST 17.1.5.05-85. Okhrana Prirody (SSOP). Gidrosfera. Obshchie Trebovaniya k Otboru Prob Poverkhnostnykh i Morskikh Vod, L'da i Atmosfernykh Osadkov [State Standart 17.1.5.05-85. Nature Conservation. Hydrosphere. General Requirements for Sampling Surface and Sea Waters, Ice and Precipitation]. Moscow: IPK Izdatel'stvo standartov, 12 p. (in Russian).
The data on the ionic composition of standard seawater are taken from the work of F. Millero [7]. The data analysis revealed significant differences in the ratio of the concentrations of the main ions between the waters of different hyperhaline reservoirs and between the waters of hyperhaline lakes and standard sea water. The obtained data expands the available information on the hydrochemical characteristics of the studied natural water bodies and the processes occurring in them.
F i g. 5. Concentrations in percent and ratios of the main ions in the basins under study
4. Check of the accuracy of the determination of ions in the salt waters of natural sources
In waters with a complex hydrochemical composition, individual (interfering) ions may have an effect on the accuracy of determination of other components*. For example, orthophosphates and iron may interfere with the determination of chlorine ions. Calcium subsidence is possible during the sedimentation of sulfates [6]. The presence of a large amount of ions of iron, copper, cadmium, cobalt, lead, manganese (II), aluminum, zinc, cobalt, nickel, tin and increased turbidity** can lead to an overestimation of the determination of calcium and magnesium ions. During potentiometric titration, interfering ions can influence the value of the electrode potential.
In order to check how the interfering ions affect on the titration result, the following measurements were carried out. To the Aral Sea water samples with a previously determined content of ions under study solutions with a known content of the same ions were added. The samples were titrated. The results were compared with the calculated ones and expressed as percentages. This procedure was repeated five times. Similar measurements and calculations were carried out for standard sea water (SSW) with a salinity of 34.996‰ (OSIL).
____________________
* Gosstandart, 1994. GOST 4245-72. Voda Pit'evaya. Metody Opredeleniya Soderzhaniya Khloridov [State Standart 4245-72. Drinking Water. Methods for the Determination of Chloride Content]. Moscow: IPK Izdatel'stvo standartov, 5 p. (in Russian).
Tab. 8 shows the results of test measurements of chlorination titration, Tab. 9 – of sulfate ions, Tab. 10 – of calcium ions and in Tab. 11 – of magnesium ions.
T a b l e 8
Calculation of accuracy of the chlorine content determination In the Aral Sea water sample and standard seawater
Type of a sample
Cl of a sample, mg
additional Cl, mg
Calculated Cl,
mg Titrated Cl, mg
Convergence, %
the Aral Sea Sample + НСl
64.9238 10.7538 75.6776 76.6559 98.7 35.0230 11.5379 46.5609 46.5605 100.0 33.4223 10.9489 44.3712 44.4043 99.9
SSW Sample + НСl
20.2981 10,7112 31.0093 31.0799 99.7 20.1805 10.7219 30.9024 31.0406 99.5 20.3178 11.3357 31.6535 31.4168 100.7
T a b l e 9
Calculation of accuracy of the sulfate-ions determination In the Aral Sea water sample and standard seawater
Type of a sample
-2 4
SO of a sample, mg
Additional
-2 4
SO , mg
Calculated
-2 4
SO , mg
Titrated 2 -4
SO , mg
Convergence, %
Aral Sea Sample + H2SO4
52.7372 52.9279 53.4760 28.9702 29.2442 28.8946 81.7074 82.1721 82.3706 81.2438 82.1854 82.2870 100.6 100.0 100.1
SSW Sample + H2SO4
T a b l e 10
Calculation of accuracy of the calcium ions determination In the Aral Sea water sample and standard seawater
Type of a sample
Са²⁺ of a sample, mg
Additional Са²⁺, mg
Calculated Са²⁺, mg
Titrated Са²⁺, mg
Convergence, %
The Aral Sea Sample +
СаCl2 0.9637 0.9246 0.9385 6.4016 6.4495 6.6605 7.3653 7.3741 7.5990 7.4501 7.4399 7.5493 98.9 99.1 100.7 SSW Sample + СаCl2
0.9527 0.9583 0.9424 6,7340 6,5294 6,5518 7.6867 7.4877 7.4942 7.8544 7.5717 7.5868 97.9 98.9 98.8
T a b l e 11
Calculation of accuracy of the magnesium ions determination In the Aral Sea water sample and standard seawater
Type of a sample Mg²⁺ of a sample, mg
Additional Mg²⁺ , mg
Calculated Mg²⁺ , mg
Titrated Mg²⁺, mg
Convergence , %
The Aral
Sea Sample + MgSO4
12.2240 12.2129 12.2018 7.6704 7.5657 7.9420 19.8944 19.7786 20.1438 20.0467 20.1216 20.0542 99.2 98.3 100.4
SSW Sample + MgSO4
2.7416 2.7161 3.0212 7.6455 7.5308 7.5134 10.3870 10.2470 10.5346 10.2442 10.2657 10.4722 101.4 99.8 100.6
Tab. 12 shows an estimate of the accuracy of the testing measurements of ions, determined by potentiometric titration of natural sources in salt and hyperhaline water samples. The good convergence of the results measured with the calculated ones proves the insignificant effect of interfering ions.
T a b l e 12
Results of testing accuracy in determining ions in the Aral Sea water sample and World ocean waters (%)
Type of a sample Ions
Сl 2
-4
SO Са²⁺ Mg²⁺
The Aral Sea < 1.3 < 0.6 < 1.1 < 1.7
Standard seawater < 2.7 < 2.8 < 2.1 < 1.4
5. Comparative characteristics of reservoirs under study
The hyperhaline under study reservoirs are drainless lakes, and their waters are highly mineralized brines. These reservoirs are located in arid climatic zones and have a negative water balance. They are exposed to degradation mainly due to the human activity and partly due to natural processes. A level of the water bodies is steadily decreasing. Brines evolve and minerals precipitate.
But at the same time, there are many differences between the hyperhaline reservoirs. They have different depths and areas and are located at different heights relative to sea level. Until 1960s the Aral Sea level fluctuated at an altitude of about 53.5 m above sea level at a depth of 66 m [2, 11]; in 2017, the sea level dropped to 29.5 m. The Dead Sea is more than 400 m below sea level, and its depth is today about 400 m *. Highland Lake Urmia is located at an altitude of 1.250 m above sea level, and its average depth is 5 m [12].
The chemical composition study of these lakes revealed both significant differences in salinity, the ratio of the main ions between the lakes and their differences from similar characteristics of ocean water.
Despite the same set of basic ions in hyperhaline reservoirs, their ratio is different from the ratio of ions in the ocean (Fig. 5). In addition, it changes with time. Comparison of the data with previously published one allows estimating these changes for each reservoir (Fig. 6). The figure shows that the processes of deposition of the ions in lakes are different. They depend on many factors: on the initial chemical composition, which is affected by water inflow, ion concentrations, air humidity, temperature and evaporation rate [13]. This analysis can help in studying the processes of salt deposition.
The Aral Sea data for several previous years were taken for comparison from the study [2], for the Dead Sea one – for 1979 from the article [3] and for 2002 from the report **, for Lake Urmia for 1977 – from [14], for 2002 – from [4] and for 2008 – from [5].
F i g. 6. Comparison (percentage wise to the sample total salinity) of the component composition of the hyperhaline lakes obtained in 2017 with the previously published data
6. Conclusions
The methods allowing determining the ionic composition of hyperhaline lakes using an automatic potentiometric titrator are given. The advantages of this approach are the use of a small amount of the sample and a significant reduction in the time of analysis. These methods can be applied to determine the ions in water bodies different according to the characteristics and to different concentrations of ions.
The concentrations of the main ions in the water samples of the Aral Sea, the Dead Sea and Lake Urmia were determined.
The values of salinity of the studied samples were established (as a sum of salts). Their measurement by standard hydrophysical equipment by electrical conductivity is not possible due to the different ratio of oceanic ions.
The determination and comparison of the ionic composition permitted to establish significant differences in the ratio of the main ions in the samples of hyperhaline reservoirs.
Verification measurements showed high accuracy in determining the main ions in the hyperhaline reservoirs by potentiometric titration using the methods proposed.
REFERENCES
1. Bortnik, V.N. and Chistyaeva, S.P., eds., 1990. Gidrometeorologiya i Gidrokhimiya Morey SSSR. T. 7, Aral'skoe More [Hydrometeorology and Hydrochemistry of the Seas in the USSR. Vol. 7, the Aral Sea]. Leningrad: Gidrometeoizdat, 196 p. (in Russian).
2. Zavyalov, P.O., ed., 2012. Bol'shoe Aral'skoe More v Nachale XXI Veka. Fizika, Biologiya, Khimiya [The Large Aral Sea in the Beginning of Century 21: Physics, Biology, Chemistry]. Мoscow: Nauka, 229 p. (in Russian).
3. Krumgalz, B.S. and Millero, F.J., 1982. Physico-Chemical Study of Dead Sea Waters: II. Density Measurements and Equation of State of Dead Sea Waters at 1atm. Marine Chemistry, [e-journal] 11(5), pp. 477-492. https://doi.org/10.1016/0304-4203(82)90012-3
4. Alipour, S., 2006. Hydrogeochemistry of Seasonal Variation of Urmia Salt Lake, Iran. Saline Systems, [e-journal] 2(Article no. 9), 19 p. https://doi.org/10.1186/1746-1448-2-9
5. Karbassi, A., Bidhendi, G.N., Pejman, A. and Bidhendi, M.E., 2010. Environmental Impacts of Desalination on the Ecology of Lake Urmia. Journal of Great Lakes Research, [e-journal] 36(3), pp. 419-424. https://doi.org/10.1016/j.jglr.2010.06.004
6. Millero, F.J., 2013. Chemical Oceanography. Boca Raton: CRC Press, 591 p. Available at: http://b-ok.xyz/ireader/2571941 [Accessed: 10 December 2018).
7. Millero, F.J., Feistel, R., Wright, D.G. and McDougalld, T.J., 2008. The Composition of Standard Seawater and the Definition of the Reference-Composition Salinity Scale. Deep-Sea Research Part I: Oceanographic Research Papers, [e-journal] 55(1), pp. 50-72. https://doi.org/10.1016/j.dsr.2007.10.001
8. Kremling, K., 2007. Determination of the Major Constituents. In: Prof. Dr. K. Grasshoff, Dr. K. Kremling, Dr. M. Ehrhardt, eds., 2007. Methods of Seawater Analysis. Weinheim: WILEY-VCH. Chapter 11, pp. 229-251. https://doi.org/10.1002/9783527613984.ch11 9. Culkin, F. and Cox, R.A., 1966. Sodium, Potassium, Magnesium, Calcium and Strontium in
Seawater. Deep Sea Research and Oceanographic Abstracts, [e-journal] 13(5), pp. 789-804. https://doi.org/10.1016/0011-7471(76)90905-010
10. Bruttel, P., 2016. Complexometric (Chelometric) Titrations. Herisau, Switzerland: Metrohm AG, 100 p.
11. Izhitskiy, A.S., Zavialov, P.O., Sapozhnikov, P.V., Kirillin, G.B., Grossart, H.P., Kalinina, O.Y., Zalota, A.K., Goncharenko, I.V. and Kurbaniyazov, A.K., 2016. Present State of the Aral Sea: Diverging Physical and Biological Characteristics of the Residual Basins. Scientific Reports, [e-journal] 6(Article number 23906 (2016)), 9 p. https://doi.org/10.1038/srep23906 12. Rumyantsev, V.A., Drabkova, V.G. and Izmaylova, A.V., 2012. Velikie Ozera Mira [Great
Lakes of the World]. Saint-Petersburg: LEMA, 370 p. (in Russian).
13. Sonnenfeld, P., 1984. Brines and Evaporites. Orlando, Toronto: Academic Press, 613 p. 14. Kelts, K. and Shahrabi, M., 1986. Holocene Sedimentalogy of Hypersaline Lake Urmia,
Northwestern Iran. Palaeogeography, Palaeoclimatology, Palaeoecology, [e-journal] 54(1-4), pp. 105-130. http://dx.doi.org/10.1016/0031-0182(86)90120-3
About the authors:
Nataliya Yu. Andrulionis – Leading Engineer, Shirshov Institute of Oceanology, Russian
Academy of Sciences (36, Nakhimovskiy Ave., Moscow, Russian Federation, 117997), ORCID ID:
0000-0001- 9141-1945,[email protected]
Pyotr O. Zavialov – Head of Laboratory of Ocean Interaction with Land Waters and
Anthropogenic Processes, Deputy Director for Physical Direction, Shirshov Institute of Oceanology, Russian Academy of Sciences (36, Nakhimovskiy Ave., Moscow, Russian Federation, 117997), Dr.Sci (Geogr.), Correspondent Member of RAS, ORCID ID: 0000-0002-3712-8302, Scopus Author ID: 6603611237, ResearcherID:E-7026-2014, [email protected]
Contribution of the co-authors:
Nataliya Yu. Andrulionis – carrying out of all laboratory analyzes, participation in the development of methods, analysis of the data obtained, preparation of graphic material and the main text of the article
Pyotr O. Zavialov – problem statement, participation in field studies and sampling,
development of approaches to the laboratory material analysis, participation in writing and editing the article text
All the authors have read and approved the final manuscript.