ISSN 2324-805X E-ISSN 2324-8068 Published by Redfame Publishing URL: http://jets.redfame.com
Comparison of Power, Velocity and Force Parameters during Loaded Squat
Jump Exercise in the Handball and Arm Wrestling Players
Ibrahim Can
Correspondence: Ibrahim Can, Gumushane University, School of Physical Education and Sports, Gumushane, Turkey.
Received: December 8, 2016 Accepted: November 11, 2017 Online Published: November 21, 2017
doi:10.11114/jets.v5i12.2057 URL: https://doi.org/10.11114/jets.v5i12.2057
Abstract
The purpose of this study was to compare power, velocity and force parameters during loaded squat jump (SJ) exercise in the handball and arm wrestling players. In accordance with this purpose, ten arm wrestling athletes from the Turkish National Team (age: 20,7 ± 3,05 years; height: 175,2 ± 5,55 cm; weight: 71,7 ± 8,17 kg) who had ranks in competitions at World and Europe Am Wrestling Championships and ten handball players (age: 23,0 ± 4,00 years; height: 182,3 ± 6,06 cm; weight: 77,8 ± 11,3 kg) who competed at Turkish handball 1st league participated voluntarily in this study. Subjects were performed loaded SJ exercise using a load equals to 40 % of their body weight and obtained the power, velocity and force values using an isoinertial measurement system (T-Force Dynamic Measurement System). For data analysis, descriptive statistic and Mann Whitney - U analyses were used. According to analysis results, there was a statistically significant difference between jump velocity during loaded SJ of handball players and arm wrestling athletes (p < 0.05). Accordingly, arm wrestling athletes have better jump velocity than handball players in terms of mean velocity (MV) and peak velocity (PV). In addition, it was obtained that there wasn’t a statistically significant difference between handball and arm wrestling players in terms of mean force (MF), mean propulsive force (MPF), peak force (PF), peak power (PP), mean propulsive power (MPP), mean power (MP), time and moving distance to barbell bar during loaded SJ (p > 0.05). Consequently, jump ability is a crucial performance indicator in many sports that require explosive actions and the lower-body muscular power. However, it is not a true approach that athletes competing at sport branches which jump ability is an important performance indicator can display a better performance during loaded SJ.
Keywords: squat jump, velocity, power, force
1. Introduction
The kinetics and kinematics parameters in relation with resistance training are believed to be a great stimulus for occurring of neuro-muscular adaptations (Crewther, Cronin & Koegh, 2006). A stimulated muscle, applies force to tendons that supplies a transfer to skeleton structure trying to contract and and natural resistances encountered during the movement of a muscle determines conclusion movement (Aşçı, 2001). That is, muscle has a feature that arranges opposite force can withstand to itself was applied resistance during shortening of the length and this feature which distinguishes muscle from a simple elastic object was based on constantly arrange against an external resistance of velocity produced by muscle contraction system (Edman, Elzinga & Noble, 1978). The strength and power characteristics are widely used to identify some significant abilities that contribute to maximal human efforts in sport and other physical activities are very important for sports branches requiring a skill to create a higher force against great resistance (strength) and a higher working rate (power) (Harman, 2008). Therefore, success in many sports which applying throwing, jumping, track field competitions and other athletic activities, mostly, depend on the explosive leg power and muscular strength of athletes (Yessin & Hatfield, 2007). In addition, leg power is important both start acceleration and maximal velocity (Chelly & Denis, 2001).
maximal strength, the one who release strength at a higher velocity (shorter period of time) will have a more certain performance advantage during anaerobic sports (Ratamess, 2012). Performance success in the most athletic actions are depended mostly on how much power will be applied against objects (ground, ball, or sportive equipment) (Newton & Kraemer, 1994) and success during a certain sporting tasks completed in a short period of time is depended on power output capacity of athlete (Baker, 2001; Newton & Dugan, 2002). An increase in power enables a high level of athletic performance where a developed quick power relation was sought (Sankarmani, Sheriff, Rajeev & Alagesan, 2012). Power can be determined as a large number of repetitive movements during aerobic exercise or a single body movement. In addition, power can be determined instantaneously at any point in a movement or averaged for any portion of a movement or bout of exercise (Knuttgen & Komi, 2003).
Currently, isometric, isoinertial and isokinetic methods are being used in power assessment (Cronin & Sleivert, 2005). Parameter used in power assessment are different and most common parameters among these are; mean power (MP), mean propulsive power (MPP) and peak power (PP). These parameters can be used to determine a central variable considered important to power and performance in explosive tasks, that variable is the training load that maximizes the mechanical power output (Pmax) of muscle (Baker, Nance & Moore, 2001; Cronin & Sleivert, 2005). MP describes to mean values obtained from the sum of all the positive values during concentric phase divided by the number of data gained in the range of motion (Castillo, Valverde, Morales, Perez-Guerra, Leon & Garcia-Manso, 2011). MPP states the mean power output obtained during propulsive section of concentric phase (Sanchez-Medina, Perez & Gonzales-Badillo, 2010). PP is represented as the maximal power production in the whole range of concentric contraction and also, this value is described as peak power referring to higher instantaneous power production in a period of 1/ m.s-1 without an certain action being attained (Baker & Newton, 2005). Some authors describe this capacity as a moment reached at threshold muscle performance and reflecting maximal mechanical performance which an person can produce in a movement (Castillo et al., 2011).
Velocity which is a vectorial quantity is the rate of change of positions. Instantaneous velocity is the velocity when the time interval is infinitesimally small (approaches zero) (Zatsiorsky, 1998). Strength and muscle contraction velocity relation which was firstly stated in 1930’s, indicates a reverse relation between muscle contraction strength and velocity. That means strength produced increases as the load increases but movement velocity decreases (Boreham, 2006). This is empirically true. If an athlete is asked to bench press the maximal amount of weight possible (1RM), the weight will move very slowly. But if the athlete is asked to bench press half of 1RM, his or her will move to the bar at a faster velocity. Maximal velocity of shortening occurs when no resistance (weight) is being moved or lifted (Kraemer & Vingren, 2007). So when the load is low, active strength can be performed parallelly by increasing velocity of shortening. On the contrary, when the load increases, muscle increases its active strength at the same level by decreasing shortening velocity sufficiently (Edman, 2003). There was an inversely relationship between external resistance or applied load with concentric contraction velocity of a muscle. If applied load is equal to zero, contraction velocity of muscle will be the highest. When the strength increases to a value equal to maximal strength that muscle can exert, contraction velocity becomes zero and muscle contracts as isometrically. Decreasing of contraction velocity with applied strength occured by an increase in the latency period and a shortening of the contraction time. A much more increase in strength causes an increase in the length of muscle when it contracts eccentrically and then lengthening velocity increases with strength applied (Bartlett, 2007). Movement velocity is an important variable in following exercise intensity (Sanchez-Medina et al., 2010) and velocity at each repetition can be a significant reference for athlete to apply a real effort. On the other hand, in a study was reported that 5% increase in relative load (between 30-100% of 1RM) cause difference between 0.07-0.09 m.s-1 in the movement velocity (Gonzales-Badillo & Sanchez-Medina, 2010). Jump performance which an athlete must jump horizontally as further as possible and vertically as high as possible is one of the most important indicators of lower-body muscle power (Young, McLean & Ardagna, 1995; Hennessy & Kilty, 2001; Perez-Gomez et al., 2008). Jump is a skill that includes complicated movement series and based on leg muscle strength, explosive strength, and flexibility of muscles that join in jump and jump skill. Jump skill is an important performance indicator in sports branches as sprint, basketball, volleyball, football (Hennessy & Kilty, 2001; Kraska et al., 2009). Vertical jump testing is commonly used to measure improvements in the vertical jump for sports branches such as basketball, handball and volleyball in which jumping ability helps performance and as a general measure of lower body power in sports such as football that require high levels of lower body power (Hedrick & Anderson, 1996).
2. Methods
2.1 Subjects
In this study, ten arm wrestling athletes from the Turkish National Team (age: 20,7 ± 3,05 years; height: 175,2 ± 5,55 cm; body weight: 71,7 ± 8,17 kg) who had ranks in competitions at World and Europe arm-wrestling championships and ten handball players (age: 23,0 ± 4,00 years; height: 182,3 ± 6,06 cm; weight: 77,8 ± 11,3 kg) who competed at Turkish handball 1st league participated voluntarily.
2.2 Data Collection Tools
Subject’s height and weight were obtained by using an electronic measurement tool (Seca Corporation, Hamburg, Germany). Power, velocity and force parameters during loaded SJ was determined with an isoinertial velocity indicator (T-force dynamic measurement system, Ergotech, Murcia, Spain). Particularly, the use of this system is suitable for typical weight lifting exercises or any resistance training where necessary to overcome, against gravity, a load that moves along the vertical axis. The system consists of an electro-mechanical equipment (velocity sensor and interface), a hook attached to weight training barbell, and a computer program governing the hardware. It is the sensor that measures the velocity of moving loads and provides a voltage proportional to the velocity with which the cable is moving. The sampling frequency at which data are acquired is fixed at 1.000 Hz, that is you get a instantaneous velocity data every millisecond. The software is automatically calculates the force, power and velocity parameters of every repetition in resistance training and displays them numerically and graphically on screen (Sanchez-Medina et al., 2010; Gonzales-Badillo & Sanchez-Medina, 2010).
2.3 Data Collection Process
Firstly, subject’s physical characteristics were obtained and calculated the loads that corresponding to 40 % of their body weight. Before loaded SJ test, subjects conducted a 20 minutes warm-up period consisting 15 minutes general period (10 minutes running at a moderate pace following 5 minutes lower body stretching) and 5 minutes specific exercise period (squat trials at submaximal level). After warm-up protocol, subjects were conducted the loaded SJ squat using free weights with a load equal to 40 % of body weight. In this test protocol, subjects were wanted to move their knees on flexion position until their thighs are parallel to the ground from static position and after ‘’start’’ command they were wanted to jump as quickly as possible without their shoulder losing contact with the bar. There were performed to repeat this for three times at maximal velocity (Loturco et al., 2015). Unless these requisites were not fulfilled, movement were repeated. Because body mass must be moved together with external load during loaded SJ and thus parameters as force, velocity and power should be determined by the subject’s ability to accelerate the total mass (external load and body mass) (Cormie et al., 2007).
2.4 Data Analysis
Descriptive statistics were used for the power, velocity and force parameters during loaded jump squat exercise and subject’s physical characteristics. Mann Whitney-U method analysis were used for determining whether power, velocity and force parameters demonstrate significant differences among branches. Significance level was accepted as p < 0.05 in all statistical analysis.
3. Results
Table 1. Subject’s Physical Characteristics
Variables Arm Wrestling Athletes Handball Players
n Minimum Maximum Mean (sd) n Minimum Maximum Mean (sd)
Age (years) 10 18 28 20.7 (± 3.05) 10 17 30 23 (± 4.00)
Height (cm) 10 168.2 184.2 175.2 (± 5.55) 10 171.2 188.2 182.3 (± 6.06) Weight (kg) 10 55.2 84.1 71.7 (± 8.17) 10 65.4 92.7 77.8 (± 11.3)
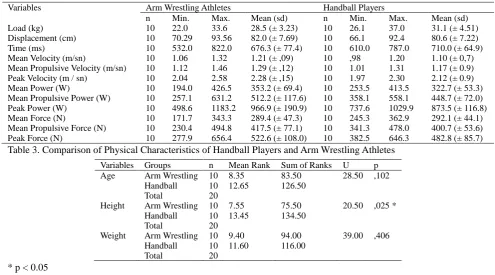
Table 2. Kinetics and Kinematics during Loaded Jump Squat Exercise of Handball and Arm Wrestling Athletes
Variables Arm Wrestling Athletes Handball Players
n Min. Max. Mean (sd) n Min. Max. Mean (sd)
Load (kg) 10 22.0 33.6 28.5 (± 3.23) 10 26.1 37.0 31.1 (± 4.51)
Displacement (cm) 10 70.29 93.56 82.0 (± 7.69) 10 66.1 92.4 80.6 (± 7.22)
Time (ms) 10 532.0 822.0 676.3 (± 77.4) 10 610.0 787.0 710.0 (± 64.9)
Mean Velocity (m/sn) 10 1.06 1.32 1.21 (± ,09) 10 ,98 1.20 1.10 (± 0,7) Mean Propulsive Velocity (m/sn) 10 1.12 1.46 1.29 (± ,12) 10 1.01 1.31 1.17 (± 0.9) Peak Velocity (m / sn) 10 2.04 2.58 2.28 (± ,15) 10 1.97 2.30 2.12 (± 0.9) Mean Power (W) 10 194.0 426.5 353.2 (± 69.4) 10 253.5 413.5 322.7 (± 53.3) Mean Propulsive Power (W) 10 257.1 631.2 512.2 (± 117.6) 10 358.1 558.1 448.7 (± 72.0) Peak Power (W) 10 498.6 1183.2 966.9 (± 190.9) 10 737.6 1029.9 873.5 (± 116.8) Mean Force (N) 10 171.7 343.3 289.4 (± 47.3) 10 245.3 362.9 292.1 (± 44.1) Mean Propulsive Force (N) 10 230.4 494.8 417.5 (± 77.1) 10 341.3 478.0 400.7 (± 53.6) Peak Force (N) 10 277.9 656.4 522.6 (± 108.0) 10 382.5 646.3 482.8 (± 85.7) Table 3. Comparison of Physical Characteristics of Handball Players and Arm Wrestling Athletes
Variables Groups n Mean Rank Sum of Ranks U p Age Arm Wrestling
Handball Total 10 10 20 8.35 12.65 83.50 126.50
28.50 ,102
Height Arm Wrestling Handball Total 10 10 20 7.55 13.45 75.50 134.50
20.50 ,025 *
Weight Arm Wrestling Handball Total 10 10 20 9.40 11.60 94.00 116.00
39.00 ,406
* p < 0.05
Table 4. Comparison of Load, Displacement and Time Values during Loaded Jump Squat Exercise According to Branches
Variables Groups n Mean Rank Sum of Ranks U p
Load Arm Wrestling Handball Total 10 10 20 9.35 11.65 93.50 116.50
38.50 ,384
Displacement Arm Wrestling Handball Total 10 10 20 11.30 9.70 113.00 97.00
42.00 ,545
Time Arm Wrestling Handball Total 10 10 20 9.20 11.80 92.00 118.00
37.00 ,326
Table 5. Comparison of Velocity Parameters during Loaded Jump Squat Exercise According to Branches
Variables Groups n Mean Ranks Sum of Ranks U p
Mean Velocity Arm Wrestling Handball Total 10 10 20 13.70 7.30 137.00 73.00
18.00 ,016 *
Mean Propulsive Velocity Arm Wrestling Handball Total 10 10 20 12.90 8.10 129.00 81.00
26.00 ,070
Peak Velocity Arm Wrestling Handball Total 10 10 20 13.60 7.40 136.00 74.00
19.00 ,019 *
* p < 0.05
Table 6. Comparison of Power Parameters during Loaded Jump Squat Exercise According to Branches
Variables Groups n Mean Ranks Sum of Ranks U p
Mean Power Arm Wrestling Handball Total 10 10 20 12.70 8.30 127.00 83.00
28.00 ,096
Mean Propulsive Power Arm Wrestling Handball Total 10 10 20 12.70 8.30 127.00 83.00
28.00 ,096
Peak Power Arm Wrestling Handball 10 10 12.50 8.50 125.00 85.00
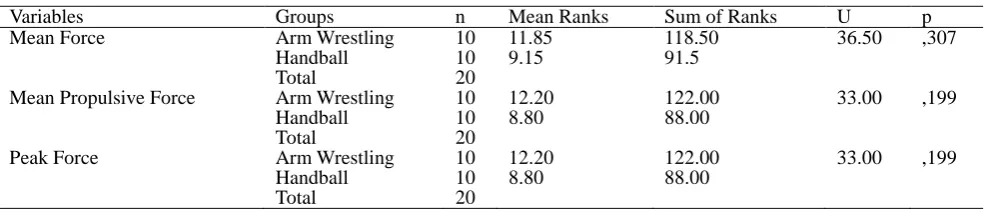
Table 7. Comparison of Force Parameters during Loaded Jump Squat Exercise According to Branches
Variables Groups n Mean Ranks Sum of Ranks U p
Mean Force Arm Wrestling
Handball Total
10 10 20
11.85 9.15
118.50 91.5
36.50 ,307
Mean Propulsive Force Arm Wrestling Handball Total
10 10 20
12.20 8.80
122.00 88.00
33.00 ,199
Peak Force Arm Wrestling
Handball Total
10 10 20
12.20 8.80
122.00 88.00
33.00 ,199
4. Discussion
In this study which power, velocity and force parameters of handball and arm wrestling athletes are determined during loaded SJ and which these parameters are assessed whether they demonstrated a significant difference between branches or not; it was seen that there was a significant difference between branches with regard to MV and PV values and arm wrestlers had greater propulsive velocity. Considering force and power parameters there is no relationship seen between branches. In literature, there is no a study related to comparing handball players and arm wrestlers with regard to kinetic and kinematic parameters during loaded SJ exercise. However, in some studies, it was compared the kinetic and kinematic parameters during jump exercises of athletes who competed in different sports. Dal-Pupo et al., (2012) compared force and velocity values during SJ and countermovement jump in the both sprint runners and volleyball players. In mentioned study, it was reported that sprint runners had greater values in terms of PV in both countermovement jump and SJ than volleyball players. It was suggested that sprint runners had a better vertical jump performance than volleyball players, probably due to the effect of their characteristic training. Similarly, Kollias, Hatzitaki, Papaiakovou and Giatsis (2001) reported that sprint runners had a greater velocity value in vertical jump exercise than volleyball, football and basketball players. In addition, it was also suggested that sprint runners have higher explosive strength. In a study on professional karate players competed in the Brazilian National Team by Loturco, Artioli, Kobal, Gil and Franchini (2014) obtained that SJ velocity applied by using % 40 of player’s body weight were 1.23 (± 0.15 m.s-1). These results show parallels with results obtained for Turkish national arm wrestling athletes in this study which it was obtained that jump squat velocities of during loaded SJ exercise applied with an external load equal to 40% of body weight for arm wrestling athletes were 1.21 (± 0.09 m.s-1). On the other hand, this value for handball players was obtained as 1.10 (± 0.07 m.s-1).
5. Conclusion
In terms of velocity parameters, it is a suprising results that arm wrestling athletes have greater values than handball players. Because, it is an expected situation that handball players have a greater jump velocity because of the presence of jump exercises in their training programmes and as jump characteristic is an important performance indicator in handball. Obtaining such a result, probably, may arise from physical characteristics and completion level of athletes. For example, arm wrestling athletes made up of athletes from the Turkish National Team who had ranks in competitions at World and Europe Arm-Wrestling Championships, while handball players struggle in the 1st league. In addition, handball players have more body weight and so they jump with more a external load may cause their propulsive velocities to be lower. As subject’s one repetition maximal (1RM) strength values toward lower-body were not taken, may be considered as one of the greatest lack in this study. Maybe, if 1RM values of leg press or squat exercise would have been determined, we could have the possibility to express the differences in propulsive velocity during loaded jump squat exercise. As a result, this study have the feature of being first with regard to comparing kinetic and kinematic parameters during loaded jump squat exercise of handball players and arm-wrestling athletes. For this reason, it is considered that the results obtained are significant for sports sciences literature and will have a reference source quality for further studies.
References
Aşçı, A. (2001). The determination of strength threshold in explosive strength development. Unpublished Doctorate Thesis, Hacettepe University, Ankara.
Baker, D. (2001). Acute and long term power response to power training: Observations on the training of an elite power athlete. National Strength and Conditioning Association, 23(1), 47-56.
https://doi.org/10.1519/1533-4295(2001)023<0047:AALTPR>2.0.CO;2
Baker, D., Nance, S., & Moore, M. (2001). The load that maximizes the average mechanical power output during jump squats in power-trained athletes. Journal of Strength and Conditioning Research, 15(1), 92-97.
https://doi.org/10.1519/1533-4287(2001)015<0092:TLTMTA>2.0.CO;2
Bartlett, R. (2007). Introduction to sports biomechanics: Analysing human movement patterns. (2nd edition), Oxon: Routledge.
Boreham, C. (2006). The physiology of sprint and power training. In Whyte,G. (Eds). The physiology of training: advances in sport and exercise science Series, Philadelphia: Churchill Livingstone Elsevier.
https://doi.org/10.1016/B978-0-443-10117-5.50011-8
Castillo, F., Valverde, T., Morales, A., Pérez-Guerraa, A., Leóna, F. D., & García-Mansoa, J. M. (2012). Maximum power, optimal load and optimal power spectrum for power training in upper-body (bench press): A review. Revista Andaluza de Medicina del Deporte, 5(1), 18-27. https://doi.org/10.1016/S1888-7546(12)70005-9
Chelly, S. M., & Denis, C. (2001). Leg power and hopping stiffness: Relationship with sprint running performance.
Medicine and Science in Sport and Exercise, 33(2), 326-333. https://doi.org/10.1097/00005768-200102000-00024
Cormie, P., McCaulley, G. O., Triplett, N. T., & McBride, J. M. (2007). Optimal loading for maximal power output during lower-body resistance exercises. Medicine Science and Sports Exercise, 39(2), 340-349.
https://doi.org/10.1249/01.mss.0000246993.71599.bf
Crewther, B., Cronin, J., & Koegh, J. (2006). Possible stimuli for strength and power adaptation: Acute mechanical responses. Sports Medicine, 36(1), 65-78. https://doi.org/10.2165/00007256-200535110-00004
Cronin, J. B., & Sleivert, G. (2005). Challenges in understanding the influence of maximal power training on improving athletic performance. Sports Medicine, 35(3), 213-234. https://doi.org/10.2165/00007256-200535030-00003
Dal-Pupo, J., Detanico, D., & Dos-Santos, S. G. (2012). Kinetic parameters as determinants of vertical jump performance. Brazilian Journal of Kinanthropometry and Human Performance, 14(1), 41-51.
https://doi.org/10.5007/1980-0037.2012v14n1p41
Edman, K. A. P. (2003). Contractile performance of skeletal muscle fibres. In Komi, PV. (Eds.), Strength and power in sport (2nd edition), Oxford: Blackwell Science Ltd. https://doi.org/10.1002/9780470757215.ch7
Edman, K. A. P., Elzinga, G., & Noble, M. I. M. (1978). Enhancement of mechanical performance by stretch during tetanic contractions of vertebrate skeletal muscle fibres. The Journal of Physiology, 281, 139-155.
https://doi.org/10.1113/jphysiol.1978.sp012413
Enoka, R M. (1994). Neuromechanical basis of kinesiology, (2nd edition), United States: Human Kinetics.
Gonzales-Badillo, J. J., & Sanchez-Medina, L. (2010). Movement velocity as a measure of loading intensity in resistance training. International Journal of Sports Medicine, 31(5), 347-352.
https://doi.org/10.1055/s-0030-1248333
Harman, E. (2008). Biomechanics of resistance exercise. In Beachle, TR., and Earle, WR. (Eds.). Essentials of strength training and conditioning, (3rd edition), United States: Human Kinetics.
Hedrick, A., & Anderson, J. C. (1996). The vertical jump: A review of the literature and a team case study. National Strength and Conditioning Association, 18(1), 7-12.
https://doi.org/10.1519/1073-6840(1996)018<0007:TVJARO>2.3.CO;2
Hennessy, L., & Kilty, J. (2011). Relationship of the stretch - shortening cycle to sprint performance in trained female athletes. Journal of Strength and Conditioning Research, 15(3), 326-331.
Knuttgen, H. G., & Komi, P. V. (2003). Basic considerations for exercise. In Komi, PV. (Eds.), Strength and power in sport, (2nd edition), Oxford: Blackwell Science Ltd. https://doi.org/10.1002/9780470757215.ch1
Kollias, I., Hatzitaki, V., Papaiakovou, G., & Giatsis, G. (2001). Using principal componenets analysis to identify individual differences in vertical jump performance. Research Quarterly for Exercise and Sports, 72(1), 63-67. https://doi.org/10.1080/02701367.2001.10608933
Kraemer, J. W., & Vinger, L. J. (2007). Muscle anatomy. In Brown, EL. (Eds.). Strength training: National strength and conditioning association, United States: Human Kinetics.
strength and power variables in elite karate athletes: A multiple regression analysis. Journal of Strength and Conditioning Research, 28(7), 1826-1832. https://doi.org/10.1519/JSC.0000000000000329
Loturco, I., D’Angelo, R. A., Fernandes, V., Gil, S., Kobal, R., Cal-Abad, C. C., et. al., (2015). Relationship between sprint ability and loaded / unloaded jump tests in elite sprinters. Journal of Strength and Conditioning Research, 29(3), 758-764. https://doi.org/10.1519/JSC.0000000000000660
McLennan, C. P., Lovell, D. I., & Gass, G. C. (2011). The role of rate of force development on vertical jump performance. Journal of strength and conditioning research, 25(2), 379-385.
https://doi.org/10.1519/JSC.0b013e3181be305c
Newton, R. U., & Dugan, E. (2002). Application of strength diagnosis. Strength and Conditioning Association Journal, 24(5), 50-59. https://doi.org/10.1519/00126548-200210000-00014
Newton, R. U., & Kraemer, J. W. (1994). Developing explosive muscular power: Implications for a mixed methods training strategy. Strength and Conditioning Association Journal, 16(5), 20-31.
https://doi.org/10.1519/1073-6840(1994)016<0020:DEMPIF>2.3.CO;2
Perez-Gomez, J., Rodriguez, G. V., Ara, I., Olmedillas, H., Chavarren, J., Gonzales-Henriquez, J. et. al., (2008). Role of muscle mass on sprint performance: gender differences. European Journal of Applied Physiology, 102(6), 685-694. https://doi.org/10.1007/s00421-007-0648-8
Ratamess, N. (2012). ACSM'S foundations of strength training and conditioning. Chine: Lippincott Williams & Wilkins.
Sanchez-Medina, L., Perez, C. E., & Gonzales-Badillo, J. J. (2010). Importance of the propulsive phase in strength assessment. International Journal of Sports Medicine, 31(2), 123-129. https://doi.org/10.1055/s-0029-1242815
Sankarmani, B., Sheriff, S. I., Rajeev, K. R., & Alagesan, J. (2012). Effectiveness of plyometrics and weight training in anaerobic power and muscle strength in female athletes. International Journal of Pharmacautical Science and Health Care, 2(2), 172-180.
Stone, M. H., Sanborn, K., O'Bryant, H. S., Hartman, M., Stone, M. E., Proulx, C., et al. (2007). Maximum strength-power performance relationships in college throwers. Journal of Strength and Conditioning Research, 17(4), 739-745.
Yessin, M., & Hatfield, F. (2007). Plyometric training: Achieving explosive power in sports. (3rd edition). United States: Human Kinetics.
Young, W. B., McLean, B., & Ardagna, J. (1995). Relationship between strength qualities and sprinting performance.
Journal of Sport Medicine and Physical Fitness, 35(1), 13-19.
Young, W. B., Newton, R. U., Doyle, T. L., Chapman, D., Cormack, S., Stewart, G., et al. (2005). Physiological and anthropometric characteristics of starters and non-starters and playing positions in elite Australian rules football: A case study. Journal of Science and Medicine in Sport, 8(3), 333-345.
https://doi.org/10.1016/S1440-2440(05)80044-1
Zatsiorsky, V. M. (1998). Kinematics of human motion. United States: Human Kinetics.
Copyrights
Copyright for this article is retained by the author(s), with first publication rights granted to the journal.