RESEARCH
Comparative transcriptome analyses
of oleaginous
Botryococcus braunii
race A reveal
significant differences in gene expression
upon cobalt enrichment
Pengfei Cheng
1, Chengxu Zhou
1, Yan Wang
1, Zhihui Xu
1, Jilin Xu
1, Dongqing Zhou
2,3, Yinghui Zhang
2,3,
Haizhen Wu
2,3, Xuezhi Zhang
4, Tianzhong Liu
5, Ming Tang
6, Qiyong Yang
6, Xiaojun Yan
7*and Jianhua Fan
2,3*Abstract
Background: Botryococcus braunii is known for its high hydrocarbon content, thus making it a strong candidate feedstock for biofuel production. Previous study has revealed that a high cobalt concentration can promote hydro-carbon synthesis and it has little effect on growth of B. braunii cells. However, mechanisms beyond the cobalt enrich-ment remain unknown. This study seeks to explore the physiological and transcriptional response and the metabolic pathways involved in cobalt-induced hydrocarbon synthesis in algae cells.
Results: Growth curves were similar at either normal or high cobalt concentration (4.5 mg/L), suggesting the absence of obvious deleterious effects on growth introduced by cobalt. Photosynthesis indicators (decline in Fv/Fm ratio and chlorophyll content) and reactive oxygen species parameters revealed an increase in physiological stress in the high cobalt concentration. Moreover, cobalt enrichment treatment resulted in higher crude hydrocarbon content (51.3% on day 8) compared with the control (43.4% on day 8) throughout the experiment (with 18.2% improvement finally). Through the de novo assembly and functional annotation of the B. braunii race A SAG 807-1 transcriptome, we retrieved 196,276 non-redundant unigenes with an average length of 1086 bp. Of the assembled unigenes, 89,654 (45.7%), 42,209 (21.5%), and 32,318 (16.5%) were found to be associated with at least one KOG, GO, or KEGG ortholog function. In the early treatment (day 2), the most strongly upregulated genes were those involved in the fatty acid biosynthesis and metabolism and oxidative phosphorylation, whereas the most downregulated genes were those involved in carbohydrate metabolism and photosynthesis. Genes that produce terpenoid liquid hydrocarbons were also well identified and annotated, and 21 (or 29.2%) were differentially expressed along the cobalt treatment. Conclusions: Botryococcus braunii SAG 807-1 can tolerate high cobalt concentration and benefit from hydrocarbon accumulation. The time-course expression profiles for fatty acid biosynthesis, metabolism, and TAG assembly were obtained through different approaches but had equally satisfactory results with the redirection of free long-chain fatty acid and VLCFA away from TAG assembly and oxidation. These molecules served as precursors and backbone
© The Author(s) 2018. This article is distributed under the terms of the Creative Commons Attribution 4.0 International License (http://creat iveco mmons .org/licen ses/by/4.0/), which permits unrestricted use, distribution, and reproduction in any medium, provided you give appropriate credit to the original author(s) and the source, provide a link to the Creative Commons license, and indicate if changes were made. The Creative Commons Public Domain Dedication waiver (http://creat iveco mmons .org/ publi cdoma in/zero/1.0/) applies to the data made available in this article, unless otherwise stated.
Open Access
*Correspondence: [email protected]; [email protected]; [email protected]
2 State Key Laboratory of Bioreactor Engineering, East China University of Science and Technology, 130 Meilong Road, Shanghai 200237, People’s Republic of China
Background
Microalgae have become an excellent source of raw materials for biodiesel and value-added products due to its unique composition and structure [1, 2]. Bot-ryococcus braunii is known for its high hydrocarbon production. Different from other algae, the hydrocar-bons synthesized by B. braunii are more suitable in high-quality fuel applications, because they are rich in saturated fatty acids, monounsaturated fatty acids, and long-chain aliphatic hydrocarbons [3, 4]. Hydrocarbons synthesized by B. braunii are stored on the outer cell wall, making hydrocarbon oil extractions more eco-nomical and more convenient [3, 5].
Botryococcus braunii has three different races (A, B, L) based on the synthesized hydrocarbons. Race A pro-duces fatty acid-derived C23–C33 alkadienes and alka-trienes and exhibits the largest range in hydrocarbon content among the three races [6]. However, B. brau-nii’s slow growth and long generation time, as well as our lack of a clear understanding of hydrocarbon ana-bolic pathways, restrict large-scale cultivation and application of B. braunii as a high-yield hydrocarbon feedstock [3]. Therefore, strengthening the research on the regulation of growth and production of hydrocar-bons is important for the development and application of hydrocarbon-producing fuels.
Most of the methods used to improve hydrocarbon production in B. braunii are similar to other energy microalgae, which have high CO2 concentrations, high light intensity, or low limitation of nitrogen source. However, B. braunii grows slowly, and its final hydro-carbon yield is not ideal under the aforementioned conditions [7, 8]. B. braunii race A promotes the accu-mulation of oleic acid, and hydrocarbon content does not change much in the absence of nitrogen source con-ditions [9, 10]. Fang et al. [11] analyzed the transcrip-tome of B. braunii race A in nitrogen-lacking condition and found that the reason for B. braunii slow growth might be the energy flow to the lipid synthesis instead of cell growth. However, the specific reasons for slow growth and key metabolic pathways for hydrocarbon synthesis of B. braunii remain uncertain. Therefore, we need to seek new methods that can help us learn the key anabolic pathways of B. braunii race A, explain the mechanisms for slow growth in B. braunii, and provide the basis for improving hydrocarbon production in B. braunii.
In our previous studies, a strain hydrocarbon-produc-ing B. braunii race A SAG 807-1 was cultured in normal medium supplemented with different concentrations of cobalt. The result revealed that a certain high concentra-tion of cobalt can promote hydrocarbon synthesis in B. braunii, and it has small effect on the growth of B. braunii cells [12]. The results showed that the biomass productiv-ity of B. braunii in a culture period of day 8 was similar, corresponding to the cobalt concentration of 0.09, 0.18, 0.45, 0.90 and 4.5 mg/L. However, the biomass was hin-dered when the concentration of cobalt increased. Cobalt is an important transition metal material. It is widely used in the production of lithium batteries, superalloys, insulating materials, and industrial catalysts [13, 14]. Under certain high concentrations of cobalt, B. braunii race A increases its hydrocarbon content and does not change its growth that much. This finding may imply that studying the high-producing hydrocarbon properties of B. braunii can be used to explore the feasibility ideas of its key synthesis pathways.
In general, under suitable conditions, microalgae mainly synthesize fatty acids in the form of glycolipids and phospholipids. The algae cells can change their lipid synthesis pathways, produce a large amount of neutral lipids, and maintain the normal metabolism under unfa-vorable growth conditions [15]. In addition, the key met-abolic pathways for hydrocarbon synthesis in B. braunii race A are not clear. Therefore, based on the high hydro-carbon-producing characteristics of B. braunii race A under high cobalt concentration conditions, we can study the changes in key enzyme and genes and important met-abolic pathways involved in B. braunii race A hydrocar-bon synthesis.
However, the genome size of B. braunii race A is large. At present, most genomes of species are not fully sequenced, and we relatively lack the cognition of molec-ular biology of B. braunii [16–18]. Under unknown genomic information, transcriptome sequencing (mRNA-seq) can be used to discover the gene type and expression levels of cells in different conditions. Thus, we can obtain information on gene expression under the stress condition, infer the functions of the corresponding unknown gene, and reveal regulation gene action mecha-nisms. Therefore, the transcriptome analysis of B. braunii race A before and after cobalt stress provides techniques to understand the changes in key enzyme and genes in hydrocarbon synthesis in B. braunii race A, study the supply for the fatty acid-derived hydrocarbon accumulation. These findings provide a foundation for exploiting the regulation mechanisms in B. braunii race A for improved photosynthetic production of hydrocarbons.
critical path of hydrocarbon production of B. braunii race A under high cobalt concentration, and may further expound the slow growth mechanism in B. braunii.
In summary, this paper is based on the growth char-acteristics of B. braunii and mechanisms of cobalt enrichment. We can study the physiological response characteristics and high hydrocarbon-producing charac-teristics of B. braunii race A. We can also elucidate the key metabolic pathways and metabolic regulations in B. braunii race A hydrocarbon synthesis. This study takes a strain hydrocarbon-producing B. braunii race A (B. brau-nii SAG 807-1) as the research subject and explores the photosynthetic characteristics of B. braunii under cobalt stress. RNA-seq was used to perform transcriptome sequencing analysis of B. braunii samples before and
after cobalt stress and explore the metabolic pathways involved in the synthesis of hydrocarbons in algae cells induced by cobalt.
Results
Growth characteristics and chlorophyll content variation of B. braunii with the change of cobalt concentration
Autotrophic algal cells were collected and inoculated into modified Chu 13 medium for normal cobalt (control, 0.09 mg/L) and into high concentration cobalt (4.5 mg/L) with an initial biomass density of 0.16 g/L. The photoau-totrophic growth rate of the algae was examined under 100 µmol/m2/s. As indicated in Fig. 1a, the growth of Botryococcus cells was not significantly different with the two treatments. However, at day 8, the biomass of the
Time (d)
Hydrocarbon content (Dcw%)
10 20 30 40 50 60
Control High cobalt
Time (d)
Fv/F
m
0.2 0.3 0.4 0.5 0.6 0.7 0.8
Control High cobalt
Time (d)
Biomass (g/L)
0.0 0.5 1.0 1.5 2.0 2.5
Control High cobalt
Time (d) 0 2 4 6 8 10
0 2 4 6 8 10
0 2 4 6 8 10
0 2 4 6 8 10
Chlorophyll content (mg/L)
0 2 4 6 8 10 12 14 16
Control High cobalt
a b
c d
Fig. 1 Comparison of growth and physiological response of B. braunii SAG 807-1 under cobalt enrichment treatment. a Dry cell weight; b
variable-to-maximum fluorescence ratio (Fv/Fm); c chlorophyll content; d hydrocarbon content. Normal cobalt (control, 0.09 mg/L); high
algae with high cobalt was 1.86 g/L, which was slightly lower than the control (2.12 g/L).
The chloroplast is the fundamental unit for most pho-tosynthetic algae; hence the content of chlorophyll and the vitality of the photosynthetic machine are critical physiological indicators through which we can inspect algal cell adaptation when exposed to cobalt enrichment [5]. Figure 1c shows that the chlorophyll content of algal cells in normal Chu 13 medium cultivation fluctuated around 14.22 mg/L at day 8, whereas high cobalt con-centration cultivations resulted in significant decrease in chlorophyll content (little difference was found in the two treatments at the beginning of the culture). The amount of B. braunii cells in high cobalt culture was 8.58 mg/L at 8 days. The degradation caused by cobalt enrichment was relatively less significant at the end of the culture.
The variable-to-maximum fluorescence ratio (Fv/Fm), which indicates about the quantum efficiency of photo-system II was also measured to evaluate changes in the photosynthetic efficiency of algal cell under the two treat-ments (Fig. 1b). In the normal Chu 13 medium cultiva-tions (control), the Fv/Fm ratio increased on the first day then decreased gradually to 0.52 on day 8. The exposure of algal cells to cobalt enrichment led to a more dramatic decline in Fv/Fm ratio than in the control. The algae cells with high cobalt exhibited an early declining pattern with the terminal value of 0.29 at day 8. The decline in the Fv/ Fm ratio value under cobalt enrichment indicates that the photosynthetic efficiency of algal cells was undermined.
Nutrient stress was also demonstrated to lead to a decline in the Fv/Fm ratio [19].
Hydrocarbon accumulation of B. braunii with the change in cobalt concentration
Botryococcus braunii is a colonial green microalga that can produce extracellular hydrocarbons at a high rate [4, 16]. However, hydrocarbon accumulation apparently does not require specific metabolic triggers like nitro-gen starvation as seen in TAG-accumulating microalgae [9]. In this study, as shown in Fig. 1d, cobalt enrichment treatment resulted in higher content of crude hydrocar-bon compared with the control throughout the experi-ment. Moreover, crude hydrocarbon content increased with the culture time. On day 8, the control reached a maximum crude hydrocarbon content of 43.4%, whereas the cobalt enrichment samples reached a maximum of 51.3%.
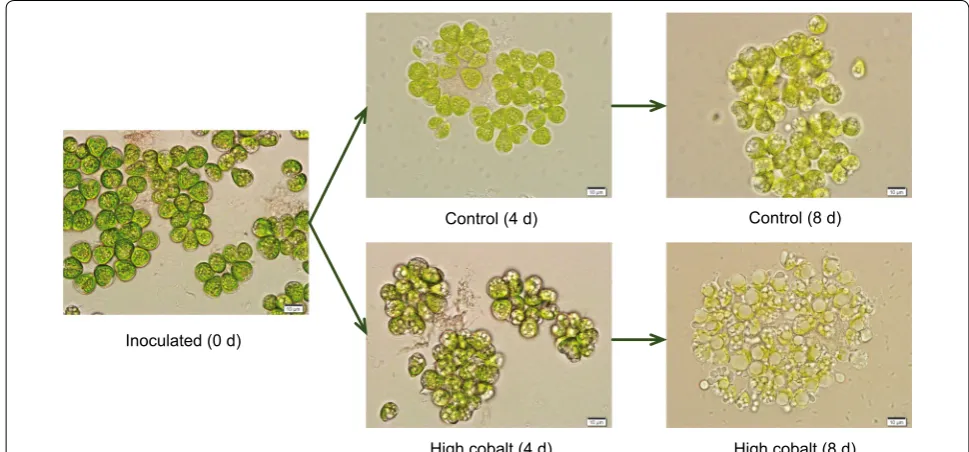
The hydrocarbon composition produced by the strain suggested that it is a typical strain of the A race [6]. Electron microscopy also revealed that the algal cells, which were cultivated in the normal culture medium, were relatively fresh green (Fig. 2). More round lipid droplets (brackets) can also be seen attached to the cell surface under the cobalt enrichment culture. Round lipid droplets on the cell surface were considered to be lipids recently secreted to the cell surface. Lipid bod-ies in the cytoplasm were not prominent in interphase cells. These lipid bodies then increased in number, size,
and inclusions, reaching maximum values just before the first lipid accumulation on the cell surface at the cell apex (Fig. 2). However, TAG conversion to biofuel crude usu-ally involves transesterification of the constituent fatty acids with alcohols before refining the resulting biocrude to transportation fuels [20].
Activities of antioxidant enzymes and antioxidant response
In the present study, we investigated physiological parameters to confirm the toxicological effects of the high cobalt stressor, including the activities of antioxidant enzymes like peroxidase (POD), glutathione reductase (GR), superoxide dismutase (SOD), and malonaldehyde (MDA) (Fig. 3). The activities of POD, GR, and SOD for algal cells, which were cultured in the cobalt enrichment medium were prominent, and the values were 3.32, 0.34, and 3.05 U/mg protein, respectively. Counterintuitively, the enzyme activity of POD, GR, and SOD under normal medium was even lower than that of high cobalt condi-tions at the late phase of cultivation. However, MDA content reflecting lipid peroxidation and no significant
difference was found between the samples. We can fig-ure out that the cell growth curve has an inverse trend with that of POD, GR, and SOD content. Researches indicated that the stress on green algae is mediated by antioxidant enzymes which SOD, GR, POD were mainly involved [19]. Therefore, our data indicated that cobalt enrichment may play vital roles in acclimation through regulation of the expression of specific genes. In general, nitrogen, phosphate, or iron deficiency in the culture alters enzymes in the cells or results in enhanced lipids biosynthesis. However, these factors were insignificant in the study of hydrocarbon synthesis and metabolism for the B. braunii [10, 21].
De novo assembly and functional annotation of the B. braunii transcriptome
To investigate the transcriptomic change upon cobalt stress, the sequencing, assembly, and annotation of the B. braunii SAG 807-1 were carried out. A total of 659 mil-lion filtered reads were yielded through Illumina HiSeq 2000 platform, which represent the transcripts from total RNA isolated from four time points (days 0, 2, 4, 8) during the high cobalt and normal culture conditions (Additional file 1: Tables S1–S3). These time points were chosen because the difference of growth characteristics and enzyme activities have been shown to be significant in these time points. As a result, 196,276 non-redun-dant unigenes were obtained with an average length of 1086 bp, N50 of 1419 bp, and GC content of 51.76% (Table 1). These cleaned reads were deposited into the NCBI Sequence Read Archive (Accession: SRP161189).
The whole genome sequence of B. braunii race A is not available, thus, the annotation of the non-redundant unigenes were performed based on the BlastX tool by sequence homology comparison. As a result, a total of 76,002 (38.7%) and 84,847 (43.2%) of the unigenes in SAG 807-1 were shown to have best-hits upon NCBI non-redundant protein database and UniProt, respectively (i.e. cut-off E-value ≤ 10−5) (Additional file 1: Table S4 and Additional file 2: Dataset S1). Among the annota-tion dataset, we found that the top five best-hits spe-cies were Volvox carteri, Chlamydomonas reinhardtii, Ectocarpus siliculosus, Guillardia theta CCMP2712, and Chlorella variabilis, suggesting that the transcriptome of Fig. 3 Activities of antioxidant enzymes like peroxidase (POD),
glutathione reductase (GR), superoxide dismutase (SOD), and
malonaldehyde (MDA) in B. braunii SAG 807-1 under cobalt
enrichment treatment. Normal cobalt (control, 0.09 mg/L); high concentration cobalt (4.5 mg/L)
Table 1 The de novo-assembled parameters of B. braunii SAG 807-1 transcriptome
Fourteen samples were collected from the bioreactors at 0, 2, 4, and 8 days at both cobalt enrichment and normal conditions Statistics Counts Total length (bp) N25 (bp) N50 (bp) N75 (bp) Average
length (bp) Longest (bp) N % GC %
Contigs 471,885 279,466,923 1893 784 395 592 17,019 0.60 51.50
Transcripts 208,740 218,861,772 2825 1327 677 1048 18,583 0.78 51.75
SAG 807-1 is mostly related to green algae. The majority (top 20) of the best-hits species were listed in Additional file 1: Figure S2. Our result was supported by the anno-tation results. However, a slight difference was observed between another B. brauni race A strain 779, of which ~ 70% of best-hit ESTs were derived from green micro-algae Coccomyxa subellipsoidea [11], implying that race A 779 and SAG 807-1 belong to different isolines of B. brauni.
The assembled unigenes were then subjected to func-tional analysis. Of the 196,276 ESTs, 89,654 (45.7%), 42,209 (21.5%) and 32,318 (16.5%) were found to be associated with at least one KOG (eukaryotic ortholog group), gene-ontology (GO), or KEGG ortholog func-tion (Addifunc-tional file 1: Figures S3–S5, Additional file 3: Dataset S2 and Additional file 4: Dataset S3), respectively. A total of 3682 GO functions in Biological Process, 648 functions in Cellular Component, and 2035 functions in Molecular Function were annotated in SAG 807-1 tran-scriptome (compete list were summarized in Additional file 3: Dataset S2). A complete list of unigene-associated KEGG metabolic pathways is collected in Additional file 4: Dataset S3.
Global transcriptional changes of B. braunii in response to high cobalt
Individual unigenes levels were normalized to FPKM and averaged from two biological replicates for dif-ferential expression analysis. Compared with baseline, transcriptome data showed that 4472 unigenes were downregulated by twofold, whereas 3895 unigenes were upregulated twofold under high cobalt condition for 2 days. After 4-day stress, 7408 unigenes were downregu-lated, whereas 6541 unigenes were upregulated. After 8 days of treatment, 18,889 unigenes were downregu-lated, and 4197 unigenes were upregulated. The number of differentially expressed genes is presented in Addi-tional file 1: Figure S6. Notably, under high cobalt con-ditions, a higher number of downregulated transcripts were observed compared with that of upregulated tran-scripts. At the peak of gene expression, the number of differentially expressed transcripts was clearly more than that of time points at days 2 and 4. Nonetheless, the over-all pattern was that upregulation expression was highest at 4 days and lowest at 2 days, whereas the number of downregulated transcripts has gone up dramatically.
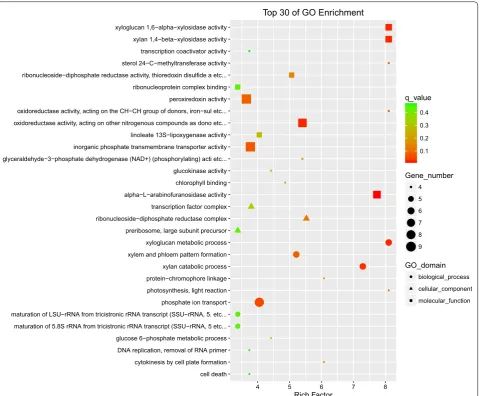
Transcriptomic dynamics tracked via mRNA-seq across three time points by comparison from high cobalt to normal conditions revealed genes and path-ways that are most differentially expressed (Additional file 5: Dataset S4, Additional file 6: Dataset S5, Addi-tional file 7: Dataset S6, Additional file 8: Dataset S7, Additional file 9: Dataset S8, Additional file 10: Dataset
S9, Additional file 11: Dataset S10, Additional file 12: Dataset S11, Additional file 13: Dataset S12). For GO enrichment at 4 days, genes were those from the fol-lowing: (1) biological processes: xyloglucan metabolic process, xylan catabolic process, xylem and phloem pattern formation, and phosphate ion transport; (2) cellular components: ribonucleoside-diphosphate reductase complex, transcription factor complex, and preribosome; and (3) molecular function: xyloglucan 1,6-alpha-xylosidase activity, xylan 1,4-beta-xylosidase activity, alpha-l-arabinofuranosidase activity, oxidore-ductase activity, and peroxiredoxin activity (Fig. 4). For 2 days and 8 days, the top 30 of GO enrichment were displayed in Additional file 1: Figures S7, S8. For KEGG pathway enrichment at 4 days, genes that are involved in fatty acid elongation, sesquiterpenoid and triterpe-noid biosynthesis, and linoleic acid metabolism were mostly differentially expressed (Fig. 5). For 2 days and 8 days, the top 30 of KEGG pathway enrichment were displayed in Additional file 1: Figures S9, S10. Notably, in the early stage of cobalt treatment (2 days), pathways like fatty acid metabolism, fatty acid elongation, fatty acid biosynthesis, biosynthesis of unsaturated fatty acids, and photosynthesis fluctuated remarkably. This finding suggests a vigorous gene regulatory response upon high cobalt concentration, which can partly explain the rapid and massive changes in intracellular long chain fatty acid and hydrocarbon storage forms within the cobalt treatment.
Time course distribution of up- and downregulated genes within the KEGG pathway collectively result in a marked redirection of metabolism under high cobalt treatment. High-level expression of these functions along the cobalt enrichment conditions in B. braunii cells suggests that the decline of Fv/Fm ratio (Fig. 1b) and significant increment of enzyme activity of POD, GR, and SOD (Fig. 3, consistent with the peroxiredoxin activity GO enrichment analysis in Fig. 4) were poten-tially owing to a major portion of its cellular fatty acid and hydrocarbon accumulation. Thus, our transcrip-tome data agree to the analytic conclusions showed by versatile changes of physiological parameter measure-ment (e.g. hydrocarbon accumulation, decline of pho-tosynthesis efficiency, and antioxidant response).
Differentially expressed genes related to fatty acid‑derived hydrocarbon biosynthesis and TAG assembly
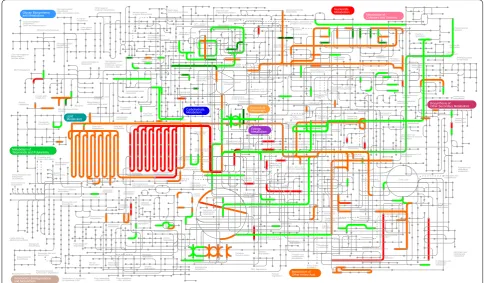
Based on the subset of enzymes potentially involved in fatty acid-derived hydrocarbon biosynthesis and TAG assembly pathways, which were found in race A 779 [11], BOT-88-2 [23], and race B Showa [21], a total of 38 enzymes (association of with EC numbers) rep-resented by 766 unigenes were retrieved in SAG 807-1 transcriptome (Table 2). The critical pathways related to fatty acid-derived hydrocarbon biosynthesis and lipid metabolisms were reconstructed from transcrip-tomic evidence (Fig. 7). Consistent with other two race A strains (779 and BOT-88-2), although the mRNA-seq data embraced putative genes related to unsaturated VLCFAs biosynthesis, the genes for the final conversion
cell death cytokinesis by cell plate formation DNA replication, removal of RNA primer glucose 6−phosphate metabolic process maturation of 5.8S rRNA from tricistronic rRNA transcript (SSU−rRNA, 5 etc... maturation of LSU−rRNA from tricistronic rRNA transcript (SSU−rRNA, 5. etc... phosphate ion transport photosynthesis, light reaction protein−chromophore linkage xylan catabolic process xylem and phloem pattern formation xyloglucan metabolic process preribosome, large subunit precursor ribonucleoside−diphosphate reductase complex transcription factor complex alpha−L−arabinofuranosidase activity chlorophyll binding glucokinase activity glyceraldehyde−3−phosphate dehydrogenase (NAD+) (phosphorylating) acti etc... inorganic phosphate transmembrane transporter activity linoleate 13S−lipoxygenase activity oxidoreductase activity, acting on other nitrogenous compounds as dono etc... oxidoreductase activity, acting on the CH−CH group of donors, iron−sul etc... peroxiredoxin activity ribonucleoprotein complex binding ribonucleoside−diphosphate reductase activity, thioredoxin disulfide a etc... sterol 24−C−methyltransferase activity transcription coactivator activity xylan 1,4−beta−xylosidase activity xyloglucan 1,6−alpha−xylosidase activity
4 5 6 7 8
Rich Factor
0.1 0.2 0.3 0.4
q_value
Gene_number
4 5 6 7 8 9
GO_domain
biological_process cellular_component molecular_function
Top 30 of GO Enrichment
Fig. 4 Distribution of top 30 GO categories enrichment upon high cobalt treatment (4 days). Enrichment were analyzed based on hypergeometric
of VLCFAs to the hydrocarbon end products remain to be identified.
Accordingly, genes encoding enzymes associated with fatty acid and neutral lipid metabolic pathways were dif-ferentially expressed (Fig. 7). For comparison, the sum-mation of all FPKM values of unigenes that associated
with the same enzyme (based on EC number) were used for logFC calculation. The results revealed that the summative levels of the enzymes tested were mod-erately altered (Table 2). In the early growth process (2 days), four summative transcripts encoding long-chain fatty acid-CoA ligase (EC 6.2.1.3), 3-hydroxyacyl-CoA
Acarbose and validamycin biosynthesis Aminobenzoate degradation Bacterial secretion system Betalain biosynthesis Biosynthesis of vancomycin group antibiotics Butanoate metabolism Caprolactam degradation Chemical carcinogenesis Collecting duct acid secretion Cutin, suberine and wax biosynthesis DNA replication Drug metabolism Fat digestion and absorption Fatty acid elongation Ferroptosis Flavonoid biosynthesis Glycosaminoglycan biosynthesis Linoleic acid metabolism Metabolism of xenobiotics by cytochrome P450 Mismatch repair Neomycin, kanamycin and gentamicin biosynthesis Nitrogen metabolism Phototransduction Plant−pathogen interaction Protein export Ribosome Sesquiterpenoid and triterpenoid biosynthesis Synthesis and degradation of ketone bodies Vitamin digestion and absorption
1.5 2.0 2.5 3.0
Rich Factor
0.25 0.50 0.75 1.00
q_value
Gene_number
50 100 150 200
Top 30 of Pathway Enrichment
Fig. 5 Distribution of top 30 KEGG metabolic pathways enrichment upon high cobalt treatment (4 days). Enrichment were analyzed based on
dehydrogenase (EC1.1.1.35), enoyl-CoA hydratase/long-chain 3-hydroxyacyl-CoA dehydrogenase (EC1.1.1.211), and fatty acid elongase (EC 2.3.1.199), which define the beginning committed steps of fatty acid biosynthesis (desaturation and elongation), were upregulated along the 4-day cobalt enrichment cultivation (i.e. fold change > 2) until the stabilization phase (8 days). Transcripts respon-sible for TAG assembly [e.g. diacylglycerol O -acyltrans-ferase (EC 2.3.1.20)] showed remarkable increase in the middle phase of growth (4 days). Notably, five enzymes involved in fatty acid oxidation, including acyl-coen-zyme A thioesterase (EC 3.1.2.2), short/branched chain acyl-CoA dehydrogenase (EC 1.3.99.12), very long-chain acyl-CoA dehydrogenase (EC 1.3.8.9), acyl-CoA dehydro-genase (EC 1.3.8.7), and acetyl-CoA C-acetyltransferase (EC 2.3.1.9) were all downregulated by the end of high cobalt treatment (8 days). Besides, three enzymes related to TAG synthesis, glyceraldehyde-3-phosphate dehydro-genase (EC 1.2.1.12), lysophospholipid acyltransferase (EC 2.3.1.51), and diacylglycerol O-acyltransferase (EC 2.3.1.20) also showed significant downregulation in the stabilization phase (8 days). However, the pyruvate dehy-drogenase (E1), which serves as a critical gene of energy and carbon molecule supply for fatty acid biosynthesis,
showed increased expression in the early cobalt treat-ment (2 days). The expression profile of the fatty acid bio-synthesis, metabolism and TAG assembly were obtained through different approaches but had equally satisfactory results with the redirection of free long-chain fatty acid and VLCFA away from TAG assembly and oxidation, but served as precursors and backbone supply for the fatty acid-derived hydrocarbon accumulation.
Differentially expressed genes involved in terpenoid liquid hydrocarbon biosynthesis pathways
Table 2 List of annotated enzymes that potentially involved in fatty acid-derived hydrocarbon biosynthesis and TAG assembly
a Summation of all FPKM values of unigenes that associated with the same enzyme were used for logFC calculation b N.D. means could not detect
c More than twofold increase or decrease were marked as italic type
EC # Enzyme description Unigene
number LogFC (2 days)
a LogFC (4 days) LogFC (8 days)
Fatty acid biosynthesis
6.4.1.2 Acetyl-CoA carboxylase carboxyl transferase 17 0.16 − 0.51 0.12
6.3.4.14 Acetyl-CoA carboxylase/biotin carboxylase 27 − 0.17 − 0.61 0.04
2.3.1.39 [Acyl-carrier-protein] S-malonyltransferase 8 0.24 − 0.26 0.30
1.1.1.100 3-Oxoacyl-[acyl-carrier protein] reductase 52 0.01 − 0.21 − 0.25
2.3.1.179 3-Oxoacyl-[acyl-carrier-protein] synthase II 24 0.37 − 0.07 − 0.13
2.3.1.180 3-Oxoacyl-[acyl-carrier-protein] synthase III 6 0.83 0.31 − 0.58
1.14.19.2 Acyl-[acyl-carrier-protein] desaturase 6 0.40 0.21 − 0.03
1.14.19.1 Stearoyl-CoA desaturase (delta-9 desaturase) 23 0.95 0.39 − 0.69
3.1.2.14 Fatty acyl-ACP thioesterase A/oleoyl-ACP hydrolase 4 0.80 0.01 − 0.25
2.3.1.85 Fatty acid synthase, animal type 17 0.33 0.60 − 0.70
6.2.1.3 Long-chain acyl-CoA synthetase 95 0.14 − 0.22 − 0.10
6.2.1.3 Long-chain fatty acid-CoA ligase 10 1.03 0.98 − 0.74
3.1.2.21 Medium-chain acyl-[acyl-carrier-protein] hydrolase 1 − 0.15 − 1.02 1.09
Fatty acid desaturation and elongation
1.14.19.6 Omega-6 fatty acid desaturase (delta-12 desaturase) 15 0.13 − 0.70 − 0.93
1.14.19.45 Omega-6 fatty acid desaturase (delta-12 desaturase) 16 0.81 0.09 0.09
2.3.1.199 3-Ketoacyl-CoA synthase 50 0.48 0.18 − 0.45
1.1.1.35 3-Hydroxyacyl-CoA dehydrogenase 5 4.20 1.52 − 3.09
1.1.1.211 Enoyl-CoA hydratase/long-chain 3-hydroxyacyl-CoA dehydrogenase 17 2.53 1.44 − 1.23
2.3.1.199 Fatty acid elongase 37 1.11 0.02 − 1.32
4.2.1.134 Very-long-chain (3R)-3-hydroxyacyl-CoA dehydratase 16 0.56 0.62 − 0.73
1.3.1.38 Trans-2-enoyl-CoA reductase 22 0.73 0.36 − 0.75
1.3.1.93 Very-long-chain enoyl-CoA reductase 9 0.75 0.37 − 0.55
Fatty acid oxidation
4.1.1.9 Malonyl-CoA decarboxylase 7 − 0.04 0.06 − 0.44
2.3.1.16 Acetyl-CoA acyltransferase 33 0.69 0.82 − 0.67
3.1.2.2 Acyl-coenzyme A thioesterase 1 N.D.b N.D. −3.05
1.3.3.6 Acyl-CoA oxidase 53 0.22 0.05 − 0.10
1.3.99.12 Short/branched chain acyl-CoA dehydrogenase 7 0.26 0.16 −2.4
1.3.8.9 Very long chain acyl-CoA dehydrogenase 5 0.57 0.26 −1.02
1.3.8.7 Acyl-CoA dehydrogenase 25 0.08 − 0.14 −2.43
4.2.1.17 Enoyl-CoA hydratase 26 − 0.04 − 0.49 − 0.55
2.3.1.9 Acetyl-CoA C-acetyltransferase 28 0.46 0.40 −1.28
4.2.1.119 3-Hydroxyacyl-CoA dehydrogenase/enoyl-CoA hydratase 2 15 − 0.08 0.06 0.00
TAG synthesis
2.7.1.30 Glycerol kinase 12 0.39 0.02 − 0.20
2.3.1.15 Glycerol-3-phosphate O-acyltransferase 17 0.04 − 0.30 − 0.27
2.3.1.51 Lysophospholipid acyltransferase 17 0.68 − 0.22 −1.51
3.1.3.4 Diacylglycerol diphosphate phosphatase/phosphatidate phosphatase 33 − 0.31 − 0.33 − 0.15
2.3.1.20 Diacylglycerol O-acyltransferase/wax-ester synthase 1 N.D. 2.32 − 1.97
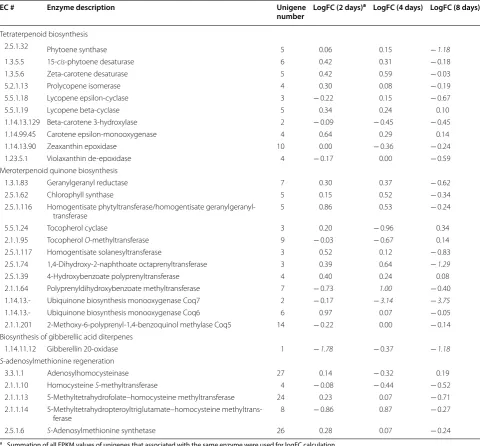
21 (or 29.2%) were differentially expressed along the cobalt treatment (i.e. fold change > 2, Table 3).
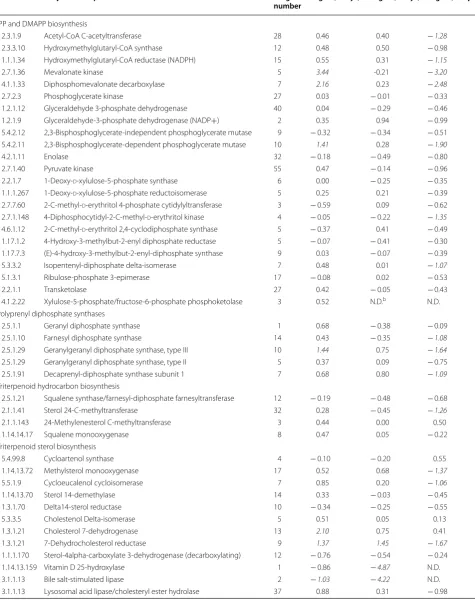
Unigenes encoding seven enzymes related to IPP and DMAPP biosynthesis, namely, acetyl-CoA C-acetyltrans-ferase (EC 2.3.1.9), hydroxymethylglutaryl-CoA reductase (NADPH) (EC 1.1.1.34), mevalonate kinase (EC 2.7.1.36), diphosphomevalonate decarboxylase (EC 4.1.1.33), 2,3-bis-phosphoglycerate-dependent phosphoglycerate mutase (EC 5.4.2.11), 4 diphosphocytidyl-2-C-methyl-d-erythritol kinase (EC 2.7.1.148), and isopentenyl-diphosphate delta-isomerase (EC 5.3.3.2) were altered transcriptionally either in the early phase (2 days) or in the stabilization phase (8 days). In polyprenyl diphosphate synthases pathways, three enzymes including farnesyl diphosphate synthase (EC 2.5.1.10), geranylgeranyl diphosphate synthase, type III (EC 2.5.1.29), and decaprenyl-diphosphate synthase subunit 1 (EC 2.5.1.91) showed fold decrease in mRNA abundance in stabilization phase (8 days). As with triterpe-noid hydrocarbon biosynthesis, only sterol 24-C-methyl-transferase (EC 2.1.1.41) was downregulated by the end of cultivation. However, for triterpenoid sterol biosynthesis,
the expression of six enzymes like methylsterol monooxy-genase (EC 1.14.13.72), cycloeucalenol cycloisomerase (EC 5.5.1.9), cholesterol 7-dehydrogenase (EC 1.3.1.21), 7-dehydrocholesterol reductase (EC 1.3.1.21), vitamin D 25-hydroxylase (EC 1.14.13.159), and bile salt-stimulated lipase (EC 3.1.1.13) were remarkably changed. The tran-scription level of enzymes involved in tetraterpenoid bio-synthesis were not dramatically altered under high cobalt treatment, except for phytoene synthase (EC 2.5.1.32) (> twofold decrease). Three enzymes in the meroterpe-noid quinone biosynthesis pathways were present, includ-ing 1,4-dihydroxy-2-naphthoate octaprenyltransferase (EC 2.5.1.74), polyprenyldihydroxybenzoate methyltransferase (EC 2.1.1.64), and ubiquinone biosynthesis monooxygenase Coq7 (EC 1.14.13.-), which were transcriptionally changed in a later period of culture. One gene related to biosynthe-sis of gibberellic acid diterpenes, gibberellin 20-oxidase (EC 1.14.11.12), showed a synchronized decrease along the cobalt enrichment condition. No variation was observed in genes related to the S-adenosylmethionine regeneration pathway. Overall, these differentially expressed unigenes Fig. 7 Fatty acid-derived hydrocarbon biosynthesis and lipid metabolism upon high cobalt treatment in B. braunii SAG 807-1. The pathways were constructed from transcriptomic evidence. Metabolic steps are represented by arrows. Dashed lines represent the presence of multiple metabolic steps. Products are shown in boxes. Genes encoding the enzymes in these pathways are labeled in red. Up- or down-regulation of gene expression under high cobalt conditions based on mRNA-seq data are indicated with red upward arrows and green downward arrows, respectively. The full
names of the corresponding genes are given in Table 2. The left, middle and right arrows represent the 2 day, 4 day and 8 day cobalt treatments,
Table 3 List of annotated enzymes that potentially involved in botryococcene or squalene biosynthesis
EC # Enzyme description Unigene
number LogFC (2 days)
a LogFC (4 days) LogFC (8 days)
IPP and DMAPP biosynthesis
2.3.1.9 Acetyl-CoA C-acetyltransferase 28 0.46 0.40 − 1.28
2.3.3.10 Hydroxymethylglutaryl-CoA synthase 12 0.48 0.50 − 0.98
1.1.1.34 Hydroxymethylglutaryl-CoA reductase (NADPH) 15 0.55 0.31 − 1.15
2.7.1.36 Mevalonate kinase 5 3.44 -0.21 − 3.20
4.1.1.33 Diphosphomevalonate decarboxylase 7 2.16 0.23 − 2.48
2.7.2.3 Phosphoglycerate kinase 27 0.03 − 0.01 − 0.33
1.2.1.12 Glyceraldehyde 3-phosphate dehydrogenase 40 0.04 − 0.29 − 0.46
1.2.1.9 Glyceraldehyde-3-phosphate dehydrogenase (NADP+) 2 0.35 0.94 − 0.99
5.4.2.12 2,3-Bisphosphoglycerate-independent phosphoglycerate mutase 9 − 0.32 − 0.34 − 0.51
5.4.2.11 2,3-Bisphosphoglycerate-dependent phosphoglycerate mutase 10 1.41 0.28 −1.90
4.2.1.11 Enolase 32 − 0.18 − 0.49 − 0.80
2.7.1.40 Pyruvate kinase 55 0.47 − 0.14 − 0.96
2.2.1.7 1-Deoxy-d-xylulose-5-phosphate synthase 6 0.00 − 0.25 − 0.35
1.1.1.267 1-Deoxy-d-xylulose-5-phosphate reductoisomerase 5 0.25 0.21 − 0.39
2.7.7.60 2-C-methyl-d-erythritol 4-phosphate cytidylyltransferase 3 − 0.59 0.09 − 0.62
2.7.1.148 4-Diphosphocytidyl-2-C-methyl-d-erythritol kinase 4 − 0.05 − 0.22 − 1.35
4.6.1.12 2-C-methyl-d-erythritol 2,4-cyclodiphosphate synthase 5 − 0.37 0.41 − 0.49
1.17.1.2 4-Hydroxy-3-methylbut-2-enyl diphosphate reductase 5 − 0.07 − 0.41 − 0.30
1.17.7.3 (E)-4-hydroxy-3-methylbut-2-enyl-diphosphate synthase 9 0.03 − 0.07 − 0.39
5.3.3.2 Isopentenyl-diphosphate delta-isomerase 7 0.48 0.01 −1.07
5.1.3.1 Ribulose-phosphate 3-epimerase 17 − 0.08 0.02 − 0.53
2.2.1.1 Transketolase 27 0.42 − 0.05 − 0.43
4.1.2.22 Xylulose-5-phosphate/fructose-6-phosphate phosphoketolase 3 0.52 N.D.b N.D.
Polyprenyl diphosphate synthases
2.5.1.1 Geranyl diphosphate synthase 1 0.68 − 0.38 − 0.09
2.5.1.10 Farnesyl diphosphate synthase 14 0.43 − 0.35 −1.08
2.5.1.29 Geranylgeranyl diphosphate synthase, type III 10 1.44 0.75 −1.64
2.5.1.29 Geranylgeranyl diphosphate synthase, type II 5 0.37 0.09 − 0.75
2.5.1.91 Decaprenyl-diphosphate synthase subunit 1 7 0.68 0.80 −1.09
Triterpenoid hydrocarbon biosynthesis
2.5.1.21 Squalene synthase/farnesyl-diphosphate farnesyltransferase 12 − 0.19 − 0.48 − 0.68
2.1.1.41 Sterol 24-C-methyltransferase 32 0.28 − 0.45 −1.26
2.1.1.143 24-Methylenesterol C-methyltransferase 3 0.44 0.00 0.50
1.14.14.17 Squalene monooxygenase 8 0.47 0.05 − 0.22
Triterpenoid sterol biosynthesis
5.4.99.8 Cycloartenol synthase 4 − 0.10 − 0.20 0.55
1.14.13.72 Methylsterol monooxygenase 17 0.52 0.68 −1.37
5.5.1.9 Cycloeucalenol cycloisomerase 7 0.85 0.20 −1.06
1.14.13.70 Sterol 14-demethylase 14 0.33 − 0.03 − 0.45
1.3.1.70 Delta14-sterol reductase 10 − 0.34 − 0.25 − 0.55
5.3.3.5 Cholestenol Delta-isomerase 5 0.51 0.05 0.13
1.3.1.21 Cholesterol 7-dehydrogenase 13 2.10 0.75 0.41
1.3.1.21 7-Dehydrocholesterol reductase 9 1.37 1.45 −1.67
1.1.1.170 Sterol-4alpha-carboxylate 3-dehydrogenase (decarboxylating) 12 − 0.76 − 0.54 − 0.24
1.14.13.159 Vitamin D 25-hydroxylase 1 − 0.86 −4.87 N.D.
3.1.1.13 Bile salt-stimulated lipase 2 −1.03 −4.22 N.D.
mostly exhibited similar expression patterns, that is, tran-scriptionally upregulated at the early phase of cobalt enrichment, then recovered following 2 days of cultivation but downregulated quickly after a long time of treatment (8 days).
Discussion
The high oil content of B. braunii makes it extremely economically valuable, and it can synthesize a variety of hydrocarbons. Hence, extracting the hydrocarbon
is more convenient than other lipids secreted by other algae. More encouragingly, the cosmopolitan green colo-nial microalga B. braunii stores photosynthetic carbon in the form of liquid hydrocarbons, which need no chemi-cal conversion to provide biofuel crude [25]. B. braunii belongs to three races defined by their synthesized hydro-carbon products. Strains of races A, B, and L are present. The hydrocarbons synthesized for each race are specific to this race. B. braunii race A strains mainly accumulate C23–C33 odd carbon diolefins or triolefins derived from
Table 3 (continued)
EC # Enzyme description Unigene
number LogFC (2 days)
a LogFC (4 days) LogFC (8 days)
Tetraterpenoid biosynthesis
2.5.1.32 Phytoene synthase 5 0.06 0.15 −1.18
1.3.5.5 15-cis-phytoene desaturase 6 0.42 0.31 − 0.18
1.3.5.6 Zeta-carotene desaturase 5 0.42 0.59 − 0.03
5.2.1.13 Prolycopene isomerase 4 0.30 0.08 − 0.19
5.5.1.18 Lycopene epsilon-cyclase 3 − 0.22 0.15 − 0.67
5.5.1.19 Lycopene beta-cyclase 5 0.34 0.24 0.10
1.14.13.129 Beta-carotene 3-hydroxylase 2 − 0.09 − 0.45 − 0.45
1.14.99.45 Carotene epsilon-monooxygenase 4 0.64 0.29 0.14
1.14.13.90 Zeaxanthin epoxidase 10 0.00 − 0.36 − 0.24
1.23.5.1 Violaxanthin de-epoxidase 4 − 0.17 0.00 − 0.59
Meroterpenoid quinone biosynthesis
1.3.1.83 Geranylgeranyl reductase 7 0.30 0.37 − 0.62
2.5.1.62 Chlorophyll synthase 5 0.15 0.52 − 0.34
2.5.1.116 Homogentisate phytyltransferase/homogentisate
geranylgeranyl-transferase 5 0.86 0.53 − 0.24
5.5.1.24 Tocopherol cyclase 3 0.20 − 0.96 0.34
2.1.1.95 Tocopherol O-methyltransferase 9 − 0.03 − 0.67 0.14
2.5.1.117 Homogentisate solanesyltransferase 3 0.52 0.12 − 0.83
2.5.1.74 1,4-Dihydroxy-2-naphthoate octaprenyltransferase 3 0.39 0.64 −1.29
2.5.1.39 4-Hydroxybenzoate polyprenyltransferase 4 0.40 0.24 0.08
2.1.1.64 Polyprenyldihydroxybenzoate methyltransferase 7 − 0.73 1.00 − 0.40
1.14.13.- Ubiquinone biosynthesis monooxygenase Coq7 2 − 0.17 −3.14 −3.75
1.14.13.- Ubiquinone biosynthesis monooxygenase Coq6 6 0.97 0.07 − 0.05
2.1.1.201 2-Methoxy-6-polyprenyl-1,4-benzoquinol methylase Coq5 14 − 0.22 0.00 − 0.14
Biosynthesis of gibberellic acid diterpenes
1.14.11.12 Gibberellin 20-oxidase 1 −1.78 − 0.37 −1.18
S-adenosylmethionine regeneration
3.3.1.1 Adenosylhomocysteinase 27 0.14 − 0.32 0.19
2.1.1.10 Homocysteine S-methyltransferase 4 − 0.08 − 0.44 − 0.52
2.1.1.13 5-Methyltetrahydrofolate–homocysteine methyltransferase 24 0.23 0.07 − 0.71
2.1.1.14 5-Methyltetrahydropteroyltriglutamate–homocysteine
methyltrans-ferase 8 − 0.86 0.87 − 0.27
2.5.1.6 S-Adenosylmethionine synthetase 26 0.28 0.07 − 0.24
a Summation of all FPKM values of unigenes that associated with the same enzyme were used for logFC calculation b N.D. means could not detect
very long chain fatty acids [6]. B race strains of B. brau-nii mainly accumulate triterpenoids (C30–C37 botryococ-cenes) [6] and methylated squalenes [26]. L race strains of B. braunii mainly accumulate the tetraterpene lyco-padiene [6, 16]. Recently, studies have discovered new S race strains of B. braunii. Race S strains synthesize C18 alkylene oxides and C20 saturated alkanes [27]. Com-pared with hydrocarbons synthesized by B. braunii race A, their carbon chains are much shorter, and the number of carbon atoms is even. In our previous studies, Cheng et al. [12] reported that B. braunii SAG 807-1 can tolerate high cobalt concentration under biofilm attached culture. In this research, the algae with suspension culture could also adapt with the high concentration of cobalt. A cer-tain low concentration of cobalt in medium could stimu-late algae growth when relatively higher concentrations are toxic. The role of cobalt in photosynthesis is contro-versial. Its toxic effect takes place by the inhibition of PSII activity. It inhibits either the reaction center or compo-nent of PSII acceptor by modifying secondary quinone electron acceptor QB site [28].
In green algae and high plants, glycerolipids biosynthe-sis is presumably carried out by two distinct pathways, namely, the prokaryotic pathway (located in the chloro-plast) and the eukaryotic pathway (which occurs in the endoplasmic reticulum) [29]. As expected, besides many unigenes associated with the prokaryotic pathway were found in SAG 807-1 transcriptome, and 17 unigenes named fatty acid synthase (animal type, EC 2.3.1.85) were also identified, which implies that fatty acid elon-gation might take place not only in the chloroplasts but also in the cytosol. A previous research indicated that an alternate pathway for TAG synthesis in yeast, plants, and green algae is present, and it involves phospholipid: diacylglycerol acyltransferase (PDAT) to generate TAG using phospholipids as donors. Interestingly, nine PDAT unigenes were retrieved in the SAG 807-1 transcriptome.
At present, the study of gene function in B. braunii is not perfect. Only the genome sequence of the Showa strain of B. braunii race B has been initially completed [24]. The transcriptome analysis of race A strains [11, 23], race B strains [21], and race L strains have been reported [16]. The average GC content estimated using all non-redundant sequences was 49.5% for B. braunii race A BOT-88-2 [23] and 50.8% for B. braunii race B Showa [24]. In this study, our results showed race A SAG 807-1 has an average GC content of 51.7% for unigenes (Table 1). Overall, B. braunii has a lower GC proportion than in other green algae (such as Chlamydomonas and Chlorella, which are great that 65% [30, 31]). Known tran-scriptomes and their annotation information have good reference information, which can help with subsequent detailed annotation of the Showa genome. Studies on
key enzymes and genes involved in hydrocarbon synthe-sis are present but limited. The degenerate PCR primers were designed by Okada et al. [32] through the conserved amino acid sequence region of squalene synthase. The cDNA was synthesized by reverse transcription PCR and then was used as probes to obtain the cloned fragment of squalene synthase gene in B race strains of B. braunii.
The biosynthetic precursors of diolefins and triolefins in A race strains of B. braunii are long-chain fatty acids or ultra-long-chain fatty acids. At first, these precursors catalyzed by long-chain fatty acid coenzyme A ligase to form long-chain fatty coenzyme A. The long-chain fatty coenzyme A is further catalyzed by fatty acyl-CoA reduc-tase to form long-chain fatty aldehydes [23]. Finally, the aldehyde decarboxylase catalyzes fatty aldehyde to form olefins having a terminal double bond or a medium chain double bond. However, some studies have isolated a decarboxylase containing cobalt porphyrin from B. brau-nii race A. The decarboxylase can catalyze fatty aldehydes to form alkanes [33].
Baba et al. [23] firstly analyzed the transcriptomes of B. braunii race A BOT-88-2 in 2012. They sequenced the constructed cDNA library with the Roche 454 pyrose-quencing instrument. They discovered several genes involved in the hydrocarbon biosynthetic pathway through BlastX annotation. The non-redundant tran-scriptomes of B. braunii BOT-88-2 has 29,038 ESTs, and its fatty acid synthesis pathway is very active in fatty acid anabolism. Its fatty acid chain extends similar to bacteria and plants and is achieved by a series of single-function enzymes, namely, the type II system. In addition to fatty acid metabolism pathway, its glycerol phospholipid meta-bolic pathway is also very active, and the high oil content of B. braunii race A may be related to it. However, they have not found a key gene for the biotransformation of ultra-long-chain fatty acids to form the final hydrocarbon in B. braunii BOT-88-2. We speculate that the functional gene in B. braunii race A may be unique. Thus, finding a homologous gene to identify it is impossible.
waiting for exploring in B. braunii race A. Based on the de novo splicing transcriptomes, this study revealed the functional enrichment analysis of B. braunii 779 intracel-lular before and after nitrogen starvation treatment, the transcriptional regulation direction after nitrogen starva-tion treatment, and the funcstarva-tional comparison between transcriptomes.
Functional enrichment analysis of B. braunii 779 genomes revealed that ESTs involved in energy metabo-lism were abundantly expressed. The authors speculated that the slow growth of B. braunii may be its photosyn-thetic energy being used to synthesize oils and hydro-carbons [11]. After nitrogen starvation treatment, they found that the EST expression values involved in pho-tosynthesis and ribosomal proteins are downregulated. Nitrogen starvation significantly increased the accumu-lation of oils and hydrocarbons in B. braunii 779. How-ever, the long-chain fatty acid metabolism pathways of precursors for biosynthesis of diolefins and triolefins in B. braunii 779 were not significantly upregulated or downregulated.
Unlike race A strains, the botryococcenes and tetrater-penoids produced by the races B and L were produced by the terpenoid biosynthetic pathway [6, 21]. After analyzing two transcriptomes of B. braunii BOT-70 and BOT-22, Ioki obtained de-redundant transcriptomes containing 1868 and 27,427 ESTs, respectively [34, 35]. Combined with two transcriptome analyses, we found that the synthetic pathway of DMAPP and IPP was an MVI synthesis pathway independent of mevalonate, and no enzyme was related to the mevalonate synthesis path-way in the transcriptome. They did not find major bot-ryococcene synthase enzymes involved in the synthesis of race B strains hydrocarbon end products in the B. braunii BOT-70 and BOT-22 transcriptomes.
Niehaus et al. [36] suggested that the catalytic synthe-sis mechanism of botryococcene hydrocarbon synthase should be similar to that of squalene synthase. Thus, they should have similar amino acid sequence domains. Compared with gene clone and transcriptome data analysis, they found three squalene synthase sequences, namely, SSL-1, SSL-2, and SSL-3 and described the cat-alytic mechanisms of these three enzymes in B. brau-nii race B. Molnar et al. [21] subsequently analyzed the transcriptomes of B. braunii races B Showa. They found that the measured quantity and quality were higher and better than other transcriptome data of B. braunii race B. The final number of spliced ESTs was 46,422. Sub-sequently, they reconstructed the B. braunii Showa biological metabolic pathway based on the annotations of the B. braunii Showa transcriptomes and the exist-ing KEGG data. Finally, they gave the terpene precur-sor synthesis pathway, the steroid carbon skeleton
synthesis pathway, the triterpenoid synthesis pathway, other anthraquinone synthesis pathways, triacylglycerol synthesis pathways, and starch synthesis pathways [21].
Recently, Thapa et al. [16] discovered two squalene synthase sequences in L race strains of B. braunii with transcriptome sequencing. One is LSS, which is the squalene synthase sequence in B. braunii race L. The other is LOS, which catalyzes the biosynthesis of lyco-paoctaene synthase in B. braunii race L. The late dis-covery of S race strains of B. braunii led to no recent reports on its transcriptomes.
Under different concentrations of cobalt, B. brau-nii can establish a series of adaptation or tolerance mechanisms to maintain chlorophyll a good physi-ological functions. Photosynthetic response is one of the important tolerance mechanisms [37]. However, excessively high concentration of cobalt (45 mg/L) will hinder the growth of algae cells. One of the reasons is that some complex proteins on the chloroplasts of algal cells can enhance the light-absorbing ability of the pho-tosynthetic system and promote cell growth during the photosynthetic process. However, excessively high con-centrations of metal can damage complex proteins on the chloroplast. It may be due to lack of constructional matters for maintaining the photosynthetic machin-ery [38]. Thus, based on studies of the photosynthetic response characteristics of algal cells on the stress of cobalt, understanding the limiting factors of slow growth of B. braunii is helpful.
and further understand the limiting factors of the slow growth of B. braunii is necessary.
Conclusions
Botryococcus braunii is a unicellular green alga with a simple cell structure. It is sensitive to metal toxicity, especially photosynthetic activity during growth [42]. At present, studies on the photosynthetic response of algae cells in response to metal mainly focus on the studies of chlorella, microcystis aeruginosa, and other aquatic envi-ronments by Cu2+, Zn2+, and Mn2+ Plasma [43, 44]. This study, to our knowledge, is the first report of exploring genes and metabolic pathways expression profile under cobalt treatment in B. braunii. Transcriptomic dynam-ics tracked via messenger RNA sequencing over four time points during cobalt treatment revealed that under high concentration, the genes that were most strongly expressed were fatty acid biosynthesis and metabolism and oxidative phosphorylation, whereas the most down-regulated ones were from carbohydrate metabolism, pho-tosynthesis, and amino acid metabolism. The transcript patterns of global genes showed that diverse expression dynamics probably contributes to the different pheno-types under cobalt enrichment. This study provided us not only a comprehensive picture of metal toxicity adap-tive mechanisms from physiological perspecadap-tive, but also a number of key metabolic nodes might be exploited as target genes for further genetic modification. Thus, these findings serve as foundation for monitoring the meta-bolic changes in this and related oleaginous algae for an optimized and controllable production of hydrocarbon-based biofuels.
Materials and methods
Algae strain and culture conditions
The microalgae species B. braunii SAG 807-1 was pur-chased from SAG culture collection, University of Göttin-gen, Germany and grown in a modified Chu 13 medium [45]. The alga seed was firstly cultivated with glass bub-bling columns (diameter = 5 cm) for about 7 days to prepare the inoculum in tube culture. Each of these col-umns contain 0.8 L of algal broth and was continuously illuminated by cold-white fluorescent lamps (NFL28-T5, NVC, China) with light intensity of 100 µmol/m2/s. The temperature for algal broth was 25 ± 2 °C during the cul-tivation. Air bubble that contained 1% CO2 (v/v) was con-tinuously injected into the bottom of the columns with a speed of 1 vvm to agitate the algal broth as well as supply carbon resource.
Growth analysis
The biomass concentration of an “algae disk” (DW, g/L) was measured using gravimetric method. Each time
10 mL volume algae cells were washed down and resus-pended with deionized water and then filtered to a pre-weighed 0.45 µm GF/C filter membrane (Whatman, England; DW0, mg). The membrane was oven dried at 105 °C for 12 h and then cooled down to room tempera-ture to measure dry weight (DW1, mg). The DW was cal-culated as follows:
where 10 was the volume of each sample.
Hydrocarbon extraction and analysis
The algal cells were harvested by washing down with de-ionized water and centrifugation at 3800×g for 10 min (Allegra X-22R, Beckman coulter, America). The algal pellets were washed three times with de-ionized water to remove the attached salt. Hydrocarbon was deter-mined according to the procedures described in Cheng et al. [12]. Exactly 50 mg of lyophilized cell biomass were homogenized and soaked in n-hexane. The extraction process was repeated several times until the supernatant was colorless and then combined in a pre-weighed glass vial. The crude hydrocarbon extract was dried under gen-tle flow of nitrogen gas (> 99%). The residue remained in the glass vial was considered as the crude hydrocarbon.
Physiological parameter analysis
The contents of total chlorophyll were determined using a modified method described by Sükran et al. [46]. The centrifuged pellets were resuspended in 96% ethanol and vortexed to extract pigments. Cellular debris was pelleted by centrifugation, and chlorophyll-a and -b levels were determined spectrophotometrically in the supernatant by measuring optical absorbance at 645 and 663 nm.
According to the operating procedures on the Dual-PAM-100 (Walz, Effeltrich, Germany), the maximum photochemical efficiency of photosystem II of algal sam-ples was detected by measuring variable to maximum fluorescence ratio (Fv/Fm). The following operation pro-cedure was according to Fan’s methods [19]. The samples were kept in the dark for 15 min before measurement. The original fluorescence (F0) was determined under the irradiance of measuring light. A saturation pulse was applied to obtain maximum fluorescence (Fm) in the dark-adapted samples. All experiments were conducted in triplicate. The effective PSII quantum yield was calcu-lated as follows:
POD activity was determined by the guaiacol meth-ods, and it catalyzed the oxidation of specific substrates by H2O2 with characteristic light absorption at 470 nm. Glutathione reductase (GR) catalyzed the regeneration of GSH by NADPH reduction GSSG while continuously
DW= (DW1−DW0)/10,
consuming NADPH to generate NADP+. NADPH had a characteristic absorption peak at 340 nm. The rate of NADPH dehydrogenation was determined by measur-ing the rate of decrease in absorbance at 340 nm and then calculating GR activity. SOD was determined by the xanthine oxidase method (hydroxylamine method). Malondialdehyde (MDA) was determined through vis-ible spectrophotometry. MDA is condensed with TBA to form a red product with a maximum absorption peak at 532, and the absorbance at 600 nm was measured at the same time. The difference in absorbance at 532 nm and 600 nm was used to calculate the content of MDA.
Electron microscopy observation
To determine the effect of cobalt on cell morphology, cells were fixed and imaged. Cells were collected dur-ing the culture time of 0, 4, and 8 days. Sodium phos-phate buffer (pH 7.5) to preserve morphologies as well as to prevent any potential chemical degradation. Gently, resuspended cells were imaged with an AxioCam MrC camera (Carl Zeiss, Germany).
NGS data collection and sequence assembly
Fourteen samples were collected from the bioreactors at 0, 2, 4, and 8 days at both cobalt enrichment and normal conditions and then immediately centrifuged at 6000×g for 5 min at 4 °C for later processing. Total RNA was extracted from fresh B. braunii cells using RNeasy Mini Kit (Qiagen, Germany) and checked for a RIN (RNA integrity number) to inspect RNA integrity by an Agilent Bioanalyzer 2100 (Agilent technologies, USA). Quali-fied total RNA was further puriQuali-fied by RNAClean XP Kit (Beckman Coulter, USA) and RNase-Free DNase Set (Qiagen, Germany). The collected RNA solutions were stored at − 80 °C for subsequent library preparation.
Libraries were constructed from about 4 µg of RNA using VAHTS Stranded mRNA-seq Library Prep Kit for Illumina®. The peak insert size of each library was about 400–450 bps (Additional file 1: Table S1). The stand-ard Illumina protocol was used in library construction. Subsequently, the mRNA-seq libraries were sequenced on an Illumina HiSeq 2000 platform. Over 6 Giga Raw bases from each library were generated (Q20 ratio > 95%) (Additional file 1: Table S2).
Default parameters were used to pass reads using the Seqtk pipeline (https ://githu b.com/lh3/seqtk ). After removal of adapters, poly-N strands, ribosome RNA reads, and low-quality reads, all filtered reads (a total of 659 million) were examined by FastQC (http://www. bioin forma tics.babra ham.ac.uk/proje cts/fastq c/) to confirm data quality (Additional file 1: Table S3). All the clean reads from both conditions were pooled and subjected to de novo assembly using CLC Genomics
Workbench (version: 6.0.4, Word-size = 45, Minimum contig length > 400). CAP3 software [47] were adopted to further generate the final UniGenes (also named ESTs/cDNAs/scaffolds/contigs). As a result, 196,276 non-redundant Unigenes were obtained with average length of 1086 bp, N50 of 1419 bp, and GC content of 51.76% (Table 1).
The mRNA-seq paired-end sequencing data are avail-able at the NCBI’s Sequence Read Archive database with an accession number SRP161189.
Transcriptome functional annotation and differential expression analysis
The general unigenes (unique transcripts) were sub-jected to sequence homology comparison against the NCBI non-redundant protein database and Uni-Prot using the BlastX algorithm with a cut-off E-value ≤ 10−5. Gene Ontology (GO) classification of each gene model was carried out using Blast2go software. KOG (eukaryotic ortholog group) and COG (cluster of orthologous groups of proteins) analysis were car-ried out using rpstblastn program. Kyoto encyclopedia of genes and genomes (KEGG) classification was per-formed using KASS and KEGG automatic annotation sever.
Reads counts per unigene and its normalized level of FPKM (fragments per kilobase of exon model per mil-lion mapped reads) were obtained using eXpress soft-ware. Differential expression analysis of the samples was conducted using the edgeR software [48], with a thresh-old q-value of ≤ 0.005. Fold changes between different time points were calculated using log2 ratios. Genes were regarded as differentially expressed when these showed at least a twofold change and ≤ 5% false discovery rate (q value). GO and KEGG pathway enrichment were analyzed based on hypergeometric test and Bonferroni adjustment (corrected P value (FDR) ≤ 0.05).
Quantitative real‑time PCR validation
Statistical analysis
All the algal growth experiments were repeated three times independently, and data were measured as the mean with standard deviation (SD). For mRNA-sequencing, two separate biological replicates were analyzed in parallel. Statistical analyses were performed using the Spearman correlation analysis (SPSS19.0). For all of the data analysis, P value < 0.05 was considered statistically significant.
Additional files
Additional file 1. Additional Tables S1–S4 and Figures S1–S12.
Additional file 2: Dataset S1. Annotation of the de novo-assembled unigenes from NCBI nr database.
Additional file 3: Dataset S2. Annotation of the de novo-assembled unigenes from Gene Ontology database.
Additional file 4: Dataset S3. KEGG pathway annotation of the de novo-assembled unigenes.
Additional file 5: Dataset S4. Unigene counts of GO enrichment upon high cobalt treatment (2 days).
Additional file 6: Dataset S5. Unigene counts of GO enrichment upon high cobalt treatment (4 days).
Additional file 7: Dataset S6. Unigene counts of GO enrichment upon high cobalt treatment (8 days).
Additional file 8: Dataset S7. KEGG metabolic pathways enrichment upon high cobalt treatment (2 days).
Additional file 9: Dataset S8. KEGG metabolic pathways enrichment upon high cobalt treatment (4 days).
Additional file 10: Dataset S9. KEGG metabolic pathways enrichment upon high cobalt treatment (8 days).
Additional file 11: Dataset S10. List of unigenes that differentially expressed upon high cobalt treatment (2 days).
Additional file 12: Dataset S11. List of unigenes that differentially expressed upon high cobalt treatment (4 days).
Additional file 13: Dataset S12. List of unigenes that differentially expressed upon high cobalt treatment (8 days).
Additional file 14: Dataset S13. Comparison of qRT-PCR with RNA-seq results using 10 randomly selected unigenes.
Abbreviations
NGS: next generation sequencing; KOG: eukaryotic ortholog group; COG: cluster of orthologous groups of proteins; GO: gene ontology; KEGG: kyoto encyclopedia of genes and genomes; TAG : triacylglycerols; VLCFA: very long chain fatty acids; POD: peroxidase; GR: glutathione reductase; SOD: superoxide dismutase; MDA: malonaldehyde; FPKM: fragments per kilobase of exon model per million mapped reads; PDAT: phospholipid:diacylglycerol acyltrans-ferase; DW: dry weight.
Authors’ contributions
PC, CZ, YW and ZX carried out the sample collection and experiments. TL, XY, HW, XZ and JX provided technological assistance. PC, JF, DZ, YZ wrote the paper. MT and QY performed qPCR and compared to the RNA-seq data. JF, XY and PC conceived and designed the paper. All authors read and approved the final manuscript.
Author details
1 College of Food and Pharmaceutical Sciences, Ningbo University, Ningbo 315211, People’s Republic of China. 2 State Key Laboratory of Bioreac-tor Engineering, East China University of Science and Technology, 130 Meilong Road, Shanghai 200237, People’s Republic of China. 3 Department of Applied Biology, East China University of Science and Technology, Shanghai 200237, People’s Republic of China. 4 Institute of Hydrobiology, Chinese Academy of Sciences, Wuhan 430072, People’s Republic of China. 5 Key Laboratory of Biofuels, Qingdao Institute of Bioenergy and Bioprocess Technology, Chi-nese Academy of Sciences, Qingdao 266101, People’s Republic of China. 6 Poy-ang Lake Eco-economy Research Center, JiujiPoy-ang University, JiujiPoy-ang 332000, People’s Republic of China. 7 Key Laboratory of Marine Biotechnology of Zheji-ang Province, Ningbo University, 818 Fenghua Road, Ningbo 315211, People’s Republic of China.
Acknowledgements
We thank the funding from the National Natural Science Foundation of China, and the Natural Science Foundation of Shanghai and Jiangxi Province.
Competing interests
The authors declare that they have no competing interests.
Availability of data and materials
All data generated or analyzed during this study are included in this published article.
Consent for publication
All the authors listed have approved the manuscript, agreed to authorship and submission of the manuscript for publication.
Ethics approval and consent to participate Not applicable.
Funding
This work was sponsored by National Natural Science Foundation of China 31560724 and 31872608, the China Postdoctoral Science Foundation 2017T100583 and 2016M600616, the Natural Science Foundation of Jiangxi Province 20171BAB214014, the Natural Science Foundation of Shanghai 18ZR1410100 and 17ZR1406700, Shanghai Pujiang Program 18PJD008, Open Funding Project of the State Key Laboratory of Bioreactor Engineer-ing 2018021, Key Laboratory of Poyang Lake Ecological Environment and Resource Development PK2017001, and the K. C. Wong Magna Fund in Ningbo University.
Publisher’s Note
Springer Nature remains neutral with regard to jurisdictional claims in pub-lished maps and institutional affiliations.
Received: 19 September 2018 Accepted: 5 December 2018
References
1. Wijffels RH, Barbosa MJ. An outlook on microalgal biofuels. Science. 2010;330(6006):913.
2. Dickinson S, Mientus M, Frey D, Amini-Hajibashi A, Ozturk S, Shaikh F, Sengupta D, El-Halwagi MM. A review of biodiesel production from microalgae. Clean Technol Environ. 2017;19(3):637–68.
3. Tasić MB, Pinto LFR, Klein BC, Veljković VB, Maciel Filho R. Botryococ-cus braunii for biodiesel production. Renew Sustain Energy Rev. 2016;64:260–70.
4. Banerjee A, Sharma R, Chisti Y, Banerjee UC. Botryococcus braunii: a renew-able source of hydrocarbons and other chemicals. Crit Rev Biotechnol. 2002;22(3):245–79.
5. Hirose M, Mukaida F, Okada S, Noguchi T. Active hydrocarbon biosyn-thesis and accumulation in a green alga, Botryococcus braunii (race A). Eukaryot Cell. 2013;12(8):1132–41.