64
Supporting Engagement or Engaging
Support?
Leanne Rylandsa and Don Shearmanb
Corresponding author: [email protected]
a
School of Computing, Engineering and Mathematics, University of Western Sydney, Sydney NSW 2751, Australia
b
Mathematics Education Support Hub, University of Western Sydney, Sydney NSW 2751, Australia
Keywords: mathematics, support, engagement, first-year
International Journal of Innovation in Science and Mathematics Education, 23(1), 64-73, 2015.
Abstract
The need for learning support in first year mathematics subjects in universities in Australia is increasing as student diversity increases. In this paper we study the use of learning support in a first year mathematics subject for which there is no assumed mathematics knowledge. Many students in this subject have a poor mathematics background, noticeably worse than five years previously. The interplay between learning support and engagement is found to be significant and the use of support can be used as a measure of engagement. The success of support is tied up with the success of engagement, making it difficult to measure the success of learning support. However student outcomes appear to be substantially improved through both mechanisms. We also highlight some concerns and consequences of the declining level of mathematics preparation of incoming students.
Introduction
There is currently great concern in Australia about the lack of mathematical preparation of many students entering science, technology, engineering, and mathematics (STEM) disciplines at university. Rylands and Coady (2009) and many, many others have written about this problem, yet students in Australia are less prepared mathematically now than they were five years ago. Students are doing less mathematics at school, a greater proportion is doing no mathematics in the final year of secondary school and of those who do choose to do mathematics, a greater proportion is doing the lower levels (Chubb 2012, p. 19, 20). In 2010, of final year students doing mathematics, the percentage taking Elementary Mathematics was roughly 50% (Chubb 2012, p. 19, 20). (When referring to secondary school mathematics subjects we will use the terminology of Barrington and Brown (2005) to describe the secondary school subjects in Australia; they are classified as Elementary, Intermediate and Advanced Mathematics.)
The problem of poorly prepared students has worsened recently as the diversity of student backgrounds increases under the new ‘demand driven system’ in which caps on the number of student places in university have been removed. The Australian government now supports universities for all domestic bachelor degree students they admit (this does not apply to medicine). Between 2009 and 2013 government supported undergraduate places in public universities increased by 22% (Kemp & Norton, 2014).
65
Taylor, Ward and Warnaar (2014, p.6) list some major concerns about the declining level of school mathematics taken by incoming students. Three of their concerns are ‘Reducing the content or intellectual level of the subject’, ‘Redirection of resources to support the subject (increased expense per student)’ and ‘Reduced standards at graduation’.
Many universities in Australia offer mathematics learning support. The University of Western Sydney (UWS) does this via a separate unit with five staff who provide mathematics support across three campuses. It has grown in size in the last few years; an example of the concerns of Hughes et al. (2014) about increased expense given in the previous paragraph.
The aim of support could be to increase the pass rate, to improve skills and knowledge, to increase confidence or perhaps to increase retention. MacGillivray (2008; p.2) sees the focus as ‘building mathematical fitness, confidence and transferability, all with reference to the specific courses being taken by the students’. MacGillivray (2009, p.457) gives a definition:
Learning support in mathematics and statistics in universities is any facility or program providing extra optional assistance in mathematics and statistics for students during their enrolled study in a university degree program, with such assistance being outside the formally scheduled classes and activities of their enrolled course.
MacGillivray (2009) and Gordon and Nicholas (2012) both analysed student data from their universities and found that support was effective for those who had at least one hour of support in total. Results in the subject were used to measure success and Gordon and Nicholas (2012) found that support increased the percentage who completed the subject.
Pass rates of those who use support can be used to measure success, however, if those who seek support are the weakest students then success might not be visible as such students might not gain enough to reach a passing grade. MacGillivray (2009, p.465) found that it was students with a better mathematics background who were more likely to make use of the mathematics learning centre. Measuring improvement of those who seek support would be useful. Student feedback could be part of the evaluation of support but is not considered in this paper.
As the use of learning support is optional, not all students who need support will engage with learning support provided, even if targeted and strongly encouraged to do so. Mac an Bhaird, Fitzmaurice, Nί Fhloinn and O’Sullivan (2013) studied learning support for first year mathematics students in Ireland. They found that ensuring high levels of engagement is the main challenge. Of 1024 students who did not make use of learning support the two most popular responses were ‘do not need help’ at 48.8% and ‘times do not suit’ at 28.8%. ‘Build it and they will come’ (common misquote from the movie ‘Field of dreams’, Robinson (1989)) does not apply to mathematics learning support.
It does not seem surprising that engagement with learning support by some who need it most is a problem as students need to take extra time to engage with support; time beyond what is required by their classes and commitments with their subjects. Engagement is critical to the success of learning support.
66
outcomes and also about institutions such as involve, empower, learning experience. She points us to Kuh (2009, p.683) who puts these notions together:
Student engagement represents the time and effort students devote to activities that are
empirically linked to desired outcomes of college and what institutions do to induce
students to participate in these activities.
Trowler (2010, p.3) describes engagement as,
Student engagement is concerned with the interaction between the time, effort and other relevant resources invested by both students and their institutions intended to optimise the student experience and enhance the learning outcome and development of students and the performance, and reputation of the institution.
There is an institutional dimension to these descriptions of engagement. UWS, like most Australian universities, has invested in a mathematics learning centre which is available to all current students. The UWS centre, the Mathematics Education Support Hub (MESH), offers a variety of services and is responsive to student demands, for example, running extra or special workshops if students in a class request it. HOTmaths, an online tutoring service focused on pre-tertiary mathematics, was also offered to students doing basic mathematics. Attendance was recorded at tutorials partly to encourage students to attend.
A first year university mathematics subject
UWS is a multi-campus university with campuses in the Greater Western Sydney region of Australia. It has over 30,000 undergraduate students. Students come from a variety of backgrounds; many students are the first in their family to attend university; some have just finished secondary school while some have not studied for several decades; some are accepted based on their school results, some come via the various pathways offered by UWS. It is therefore not surprising that some students enter university with a very poor level of mathematics while some have excellent mathematical skills and knowledge. The level varies from those who have excelled at Advanced Mathematics at secondary school to those who, some decades ago, left secondary school early. Few bachelor’s degrees have prerequisites, hence in most degrees we see in our students the whole range of abilities and skills in mathematics.
UWS, via MESH, offers a variety of programs to support students with their mathematics, including workshops for specific subjects, times when students can talk to MESH staff in the university libraries where students are working, online resources (including videos and quizzes) and an online answer service.
67
Basic Mathematics has run on campuses other than where the design students study, but for very different cohorts. Such offerings of this subject are ignored in this paper.
In 2013 the enrolment in Basics Mathematics was 115, of which 102 (89%) were design students for whom the subject is compulsory. The other students are almost all from the sciences and are not required to take this subject.
The information on prerequisites, assumed knowledge and recommended studies published for design students enrolling in degrees in 2013 was;
Bachelor of Design and Technology, a three year bachelor’s degree. Recommended studies: ‘Any two units of English, Design and Technology, Visual Arts, Physics, Mathematics’. There were no prerequisites and no assumed knowledge.
Bachelor of Industrial Design, a four year bachelor’s degree. Assumed knowledge: ‘Design and Technology and any two units of English plus at least two of Business Studies, Visual Arts, Physics, Mathematics’. There were no prerequisites and no recommended studies.
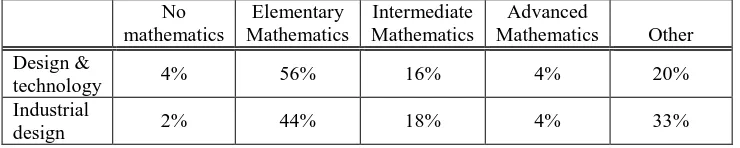
The lack of mathematics prerequisites means that students will not be refused entry if they have not studied mathematics in their last year of secondary school. However, both programs require students to do the first year basic mathematics subject. If a student has the assumed knowledge or recommended studies they still might not have studied mathematics in their last year of secondary school. The proportions of students with the various backgrounds for the design and technology students and for the industrial design students have some similarities. However, for the industrial design students 33% did not finish secondary school in the last 10 years in the state of New South Wales (NSW) and 44% completed Elementary Mathematics, whereas for the design and technology students, 20% had not completed secondary school in the last 10 years in NSW and 56% had done Elementary Mathematics. Table 1 contains more information.
Table 1: The mathematics backgrounds of the 102 design students enrolled in basic mathematics in 2013. Columns 2-5 give the level of mathematics done in the final year of secondary school. ‘Other’ means that they did not complete secondary school in NSW in the previous 10 years.
No mathematics
Elementary Mathematics
Intermediate Mathematics
Advanced
Mathematics Other Design &
technology 4% 56% 16% 4% 20%
Industrial
design 2% 44% 18% 4% 33%
Basic Mathematics had very high failure rates before 2012 (see Table 2). The emphasis on some topics in the subject was shifted at the start of 2012. Calculus, the most difficult topic based on an analysis of final examination results, was moved to the end of semester and now contributes only 13% to the final mark. A greater emphasis was placed on basic algebra. Before 2012, calculus contributed 29% to the final mark. These changes illustrate a consequence of the declining level of secondary school mathematics (see the concerns of Hughes et al. (2014) given in the previous section).
68
examination; they receive a fail grade.) In the past the subject ran on several campuses; only numbers for the campus on which the design students reside are included here. The proportion of absent-fail students remained reasonably steady at between 12% and 17%. Passing grades jumped in 2012 after the emphasis on topics changed, but dropped slightly the year after. The jump in pass rates is almost certainly partly a result of shifting the emphasis off calculus and putting it more on basic skills.
Table 2: The pass, fail, absent-fail rates and cohort size for 2009–2013.
2009 2010 2011 2012 2013
Passing grades 51% 40% 42% 61% 49%
Fail 33% 48% 41% 23% 34%
Absent-fail 16% 12% 16% 16% 17%
Cohort size 114 129 92 93 115
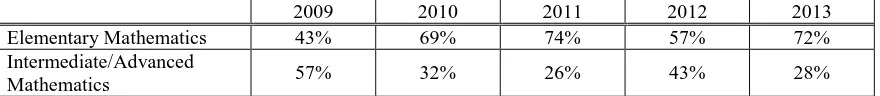
From Table 3 we see that of those who did mathematics in their final year of school in 2013, a much greater proportion chose the lower levels than in 2009. We show the Intermediate and Advanced students as a single group as there were very few or no Advanced Mathematics students in each year. We only had data on design students, but as they are the bulk of the cohort their backgrounds contribute largely to the backgrounds of the cohort overall. There has been an overall decrease in students’ mathematical preparation from 2009 to 2013. The decrease in preparation is the most likely explanation for the decrease in pass rates from 2009 to 2011. The year 2012 was an anomaly; the background of the students was better than expected and the unit emphasis was shifted making it easier to pass. Either or both of these factors could explain the higher pass rate in 2012. The drop in pass rates from 2012 to 2013 aligns with the drop in preparation, possibly exacerbated by the demand driven system which has seen many more, and hence weaker, students admitted to university. The 2009 and 2013 pass rates are much the same, most likely because the decrease in background was counteracted by the change in the subject.
Table 3: The mathematics backgrounds of design students enrolled in the Basic Mathematics in 2009 and in 2013. Only students who completed secondary school mathematics in the previous five years are shown.
2009 2010 2011 2012 2013
Elementary Mathematics 43% 69% 74% 57% 72%
Intermediate/Advanced
Mathematics 57% 32% 26% 43% 28%
69
For the subject itself, each student had a one hour workshop style tutorial each week in which students worked at their own pace on problems individually or in small groups. Marks were not given for attendance at tutorials, however, attendance was recorded as just the act of recording attendance seems to make attendance important to students. Shearman, Rylands and Coady (2013), on workshop style tutorials, recognise the importance of actually doing problems. This is in line with Twigg (2011) who presents a model for mathematics subject design which includes, as a principle for success, that students spend most of their time doing mathematics problems.
A subject website was also developed in the university’s learning management system (LMS). This site included copies of lecture notes, tutorial problems, sample assessment items with solutions, a student discussion forum and links to further resources which were designed to help students in their studies. The system automatically recorded number of accesses per student, time spent in the site and site interactions (among other information). HOTmaths was accessed separately, so the LMS use did not include number of accesses of HOTmaths.
Methods
We had available to us the secondary mathematics results of the students, however, these were de-identified and so could not be used to measure the background of each student. These have been used to provide information about the cohort as a whole. The secondary mathematics results of students some years before were also available, but in a slightly different form. These two sets made it possible for us to compare the change in proportion of students who completed Elementary, Intermediate and Advanced Mathematics in secondary school in the five years before doing Basic Mathematics.
During semester students sat three tests. Test 1 was the best measure available to us of the mathematical background of students as it is run in the fourth week of semester. It covers basic secondary school algebra which was revised in the first two weeks of semester. Because of the revision of this material students’ performance may be affected by their engagement with the first two weeks, as well as by their background. Test 1 was a 10 minute test in which students were given 20 statements and for each they state whether it is true or false, or leave it blank. On each question they score 0.5 if correct, lose 0.5 if incorrect and score 0 if it is left blank. Most questions require simple algebra involving numbers and variables; they range from very simple questions such as stating whether “3+x = x+3” is true or false to multiplying degree 1 and 2 polynomials. We consider anyone scoring less than 8 out of 10 to be at risk of failing Basic Mathematics.
Tests 2 and 3 were both short answer 45 minute tests and covered the topics studied since the previous test. For Test 2 these topics were basic algebra (factorising, expanding, simplifying), solving simple equations (including one involving logs and one involving exponentials) and an inequality, lines (graphing, slopes) and graphing quadratics; the topics assessed in Test 3 were basic trigonometry, introductory probability, basic statistical measures, solving two or three linear equations (use of matrices is optional). The three tests together with a final examination determine the final grade for each student.
70
We have used the number of accesses as a measure of engagement as total time is subject to inflated values if a student leaves the page open in a back tab.
Attendance at the face-to-face support classes was recorded as was the use of HOTmaths. Students were required to register for both the online and face-to-face support, hence we were able to compare results of those who showed an intention to make use of support but didn’t, with those who did.
We recorded students as having used HOTmaths if they were logged on for more than 20 minutes; this is quite low, but the value was chosen as we felt that students who spent less than 20 minutes would not have the opportunity to engage with the material and if a higher value was chosen there would be very few data points. This value is somewhat arbitrary and is a topic for future research. A few students spent many hours with HOTmaths; the largest amount of time spend was 27 hours. Although 52 students registered, only 12 spent more than 20 minutes with HOTmaths.
During semester MESH ran 5 one hour workshops for Basic Mathematics. We recorded students as having participated in the workshops if they attended at least one workshop. The greatest number of workshops attended was three, the least was one; the best attended workshop had 10 students, the worst had one. Fourteen students attended at least one workshop. Every student who registered for a workshop attended at least one.
Some students did not sit the final examination and hence failed the subject. Not sitting the examination may have been a strategic decision as they felt that they could not pass the examination, or they may have just dropped out. Some students withdrew from the subject before the official deadline (roughly one month into semester). These students are treated here as not having enrolled. Students who did not officially withdraw and who did not sit the final or deferred examination are referred to as absent-fail students. The numbers and percentages of such students are shown in Table 2. The absent-fail students are considered together with other students who failed unless they are explicitly considered separately.
Results
Students were classified according to whether they passed or failed the subject overall and according to the interest shown in support. Students who attended at least one workshop or used HOTmaths for at least 20 minutes were classified as ‘Used support’, those who registered for HOTmaths but did not make use of it for at least 20 minutes were classified ‘No support, but registered’ and the rest as ‘No support’. Interestingly, only two of the students who attended workshops also used HOTmaths, suggesting that there may be distinct student groups who have preference for online versus face-to-face support. We have not separated these groups for further analysis due to the relatively small numbers of students in each group.
71
difference in average access between passing and failing students at the five per cent level but not between levels of interest in support. The Spearman correlation coefficient between levels of interest and LMS access, however, is 0.32 (p<0.001) which again implies a relationship when all data points are considered. Finally, the Pearson correlation coefficient between LMS accesses and tutorial attendance is 0.51 (p<0.001), which also shows a strong positive relationship between tutorial attendance and use of online resources available through the LMS. Table 4 displays a continuum of increasing tutorial attendance as we move from the less engaged students (no support) through to the more engaged (support). Those who passed and used support had average tutorial attendance 9.1 out of 11, a very high attendance rate; they also accessed the LMS about four times per week.
Table 4: The class considered by level of interest in support and final result for subject with average tutorial attendance and average LMS accesses shown for each of the six groups. The maximum possible for tutorial attendance is 11.
No support
No support, but
registered Used support All students
Final Result Average tutorial attendance Average LMS accesses Average tutorial attendance Average LMS accesses Average tutorial attendance Average LMS accesses Average tutorial attendance Average LMS accesses
Pass 6.3 38.0 7.4 50.7 9.1 58.2 7.3 46.5
Fail 4.4 29.4 5.4 32.8 8.2 37.8 5.3 31.8
Overall 5.3 33.5 6.4 41.8 8.8 50.2 6.3 39.3
Students who make use of support on average have a slightly weaker mathematics background than others, as shown in the results of Test 1 in Table 5. The standard deviations of the test marks for all six groups in Table 5 were very similar, suggesting homogeneity of the groups. Tests 2 and 3, which tested subject content during the semester, show a decline in marks across the levels of interest although the group who utilised support facilities were the only group to show an increase in average marks from Test 2 to Test 3. There is slight evidence of a reduced decline in the ‘no support but registered’ group when compared to the ‘no support’ group. While these changes were not statistically significant they are indicative of a trend which could be tested in a larger class.
Table 5: For the three subgroups this shows the average results from the three tests carried out during semester.
No support No support, but registered Used support Final Result Test 1 average Test 2 average Test 3 average Test 1 average Test 2 average Test 3 average Test 1 average Test 2 average Test 3 average
Pass 76% 78% 71% 75% 69% 66% 68% 57% 67%
Fail 57% 37% 36% 60% 35% 34% 47% 25% 31%
Overall 66% 57% 55% 68% 52% 51% 60% 45% 53%
72
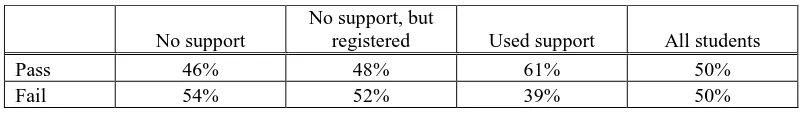
Table 6: Level of interest in support by pass/fail rates.
No support
No support, but
registered Used support All students
Pass 46% 48% 61% 50%
Fail 54% 52% 39% 50%
Discussion and conclusion
The students enrolled in Basic Mathematics entered university with a variety of mathematical backgrounds. A large number, 79% of the cohort, had done neither Advanced nor Intermediate Mathematics in NSW in the previous 10 years. The lack of prerequisites for either of the design degrees and the weak assumed knowledge or recommended studies, could well be taken to mean that no mathematics or only Elementary Mathematics is adequate preparation for the degree. It is therefore not surprising that students have weak mathematics backgrounds and that only 50% passed the subject in 2013. Providing learning support is an obvious strategy to attempt to improve mathematical knowledge and to increase the probability of passing.
The literature gives a positive message about the effects of learning support and mathematics learning support. Our results agree with this, though it was not possible to disentangle support from tutorial attendance and use of the LMS as there is a statistically significant correlation between the three. Clearly together they improve learning and performance. (Note that the online support was not accessed via the LMS.) The strong correlation between level of support, tutorial attendance and use of the LMS suggests that the amount of support used is a good metric for the level of engagement. The relationship between levels of interest in support and traditional measures of engagement (tutorial attendance, use of online resources) also suggests that engagement is not simply a dichotomous variable (present or absent) but may be measured on an ordinal or interval scale. Further, small changes in the level of engagement may have significant effects on subject outcomes.
Further evidence for the positive effects of learning support and/or engagement is the 15% difference in pass rates between the students who made use of support and those who did not, though this is not statistically significant. The main problem is small sample size.
One very obvious feature of our results is the poor engagement with learning support, both online and face-to-face. In this we had the same experience as reported by Mac an Bhaird et al. (2013). It is likely that many UWS students did not think that they needed help, as a show of hands several years previously in the subject showed that at the start of semester, all students expected to achieve a passing grade. It would be interesting to see if the perception of not needing help is the number one reason for not using support in Basic Mathematics, as it was for Mac an Bhaird et al. (2013). In student cohorts where this is the case, strategies are needed to help students to building a realistic view of their skills and knowledge.
73
Measuring any effects of many hours of support versus few hours would be informative. The number of students was too small for this to be tested in Basic Mathematics.
The figures in Table 5 are indicative of a trend of increasing learning as we move from the less engaged students (no support) through to the more engaged (used support). Those who passed and used support had average tutorial attendance 9.1 out of 11 and accessed the LMS 4.2 times per week, as opposed to those who failed and did not seek support where the numbers were average tutorial attendance of 4.4 and 2.1 LMS accesses per week. The small numbers could have been responsible for lack of statistical significance of results on the continuum of improvement during the semester.
Engagement is important, not just support. However, the use of support is measurable evidence of engagement. The link between support and improvement is most likely explained as a link between students who engage in the activities of the subject and those who improve. Further work with larger cohorts might show different effects of various activities.
The changes to Basic Mathematics that took effect in 2012, which include redirecting resources to support, are an example of some of the consequences of admitting weaker students to university. Some of the concerns of Hughes et al. (2014) have been realised.
References
Barrington F.R. & Brown, P. (2005). Comparison of Year 12 pre-tertiary mathematics subjects in Australia 2004–2005, Australian Mathematical Sciences Institute. Retrieved May 9, 2014, from
http://www.amsi.org.au/images/stories/downloads/pdfs/education/comp_y12_pretertiary_aus_2004-05.pdf Chubb, I. (2012). Office of the Chief Scientist. Mathematics, engineering & science in the national interest.
Retrieved May 19, 2014, from http://www.chiefscientist.gov.au/wp-content/uploads/Office-of-the-Chief-Scientist-MES-Report-8-May-2012.pdf
Gordon, S., & Nicholas, J. (2012). Measuring the impact of early mathematics support for student enrolled in an introductory calculus unit of study. In M. Sharma, & A. Yeung (Eds.), Proceedings of the Australian Conference on Science and Mathematics Education, (pp. 99–104). Sydney, Australia: IISME.
Hughes, B., Bean, N., Beswick, K., Johnson, M., King, D., Taylor, D., Ward, J., & Warnaar, O. (2014) Decadal Plan for the Mathematical Sciences, Mathematics and statistics education and training in universities. Kemp, D. & Norton, A. (2014). Review of the demand driven funding system. Retrieved May 19, 2014, from
http://www.education.gov.au/report-review-demand-driven-funding-system
Kuh, G. (2009). What Student Affairs Professionals Need to Know About Student Engagement.Journal of College Student Development, 50(6), pp. 683–706.
Mac an Bhaird, C., Fitzmaurice, O., Nί Fhloinn, E., & O’Sullivan, C. (2013). Student non-engagement with mathematics learning supports. Teaching Mathematics and Its Applications, 32(4), 191–205.
MacGillivray, H. (2008). Learning support in mathematics and statistics in Australian universities: A guide for the university sector. Retrieved May 19, 2014, from http://www.olt.gov.au/resource-learning-support-mathematics-guide-qut-2008
MacGillivray, H. (2009). Learning support and students studying mathematics and statistics. International Journal of Mathematical Education in Science and Technology, 40(4), 455–472.
Rylands L., & Coady. C. (2009). Performance of students with weak mathematics in first year mathematics and science. International Journal of Mathematical Education in Science and Technology, 40(6), 741–753. Shearman, D., Rylands, L., & Coady, C. (2013). Improving student engagement in mathematics using simple
but effective methods. In J. Wright (Ed.), AARE 2012Conference Proceedings, (pp. 1–8). Sydney, Australia: AARE-APERA. Retrieved May 19, 2014, from
http://www.aare.edu.au/publications-database.php/7120/improving-student-engagement-in-mathematics-using-simple-but-effective-methods Trowler, V. (2010). Student engagement literature review. Retrieved May 12, 2014, from
http://www.heacademy.ac.uk/assets/documents/studentengagement/StudentEngagementLiteratureReview.pdf Twigg, C.A. (2011). The math emporium: A silver bullet for higher education. Change: The magazine of higher
learning, 43(3), 25–34.