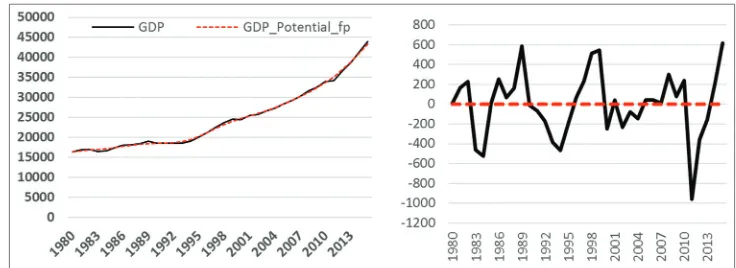
Output Gap Estimates in the WAEMU Zone
Full text
Figure


Related documents
It was decided that with the presence of such significant red flag signs that she should undergo advanced imaging, in this case an MRI, that revealed an underlying malignancy, which
Therefore the aim of this observational study was to assess the utility of the MYMOP2 and W-BQ12 health outcomes measures for measuring clinical change asso- ciated with a course
This framework incorporates macro (structural & symbolic institutions), meso (group), and micro (individual) levels of analysis, the idea of time and life course analysis, and
This essay asserts that to effectively degrade and ultimately destroy the Islamic State of Iraq and Syria (ISIS), and to topple the Bashar al-Assad’s regime, the international
19% serve a county. Fourteen per cent of the centers provide service for adjoining states in addition to the states in which they are located; usually these adjoining states have
The objective of this study was to develop Fourier transform infrared (FTIR) spectroscopy in combination with multivariate calibration of partial least square (PLS) and
The total coliform count from this study range between 25cfu/100ml in Joju and too numerous to count (TNTC) in Oju-Ore, Sango, Okede and Ijamido HH water samples as
Comparability/Predictability: For Phase I, the 24-hour average results of the duplicate Series 8400N monitors were compared by linear regression to the reference measurements


