VOLUME 36, ARTICLE 32, PAGES 905
−
944
PUBLISHED 23 MARCH 2017
http://www.demographic-research.org/Volumes/Vol36/32/ DOI: 10.4054/DemRes.2017.36.32
Research Article
Household production and consumption over the
life cycle: National Time Transfer Accounts
in 14 European countries
Lili Vargha
Róbert Iván Gál
Michelle O. Crosby-Nagy
© 2017 Lili Vargha, Róbert Iván Gál & Michelle O. Crosby-Nagy.
This open-access work is published under the terms of the Creative Commons Attribution NonCommercial License 2.0 Germany, which permits use, reproduction & distribution in any medium for non-commercial purposes, provided the original author(s) and source are given credit.
1 Introduction 906 2 National Transfer Accounts and National Time Transfer Accounts 908 3 Data and methods of constructing harmonised European National
Time Transfer Accounts
910 3.1 Estimating household production by age 912 3.2 Estimating consumption of household production by age 913 3.2.1 Imputing time use to EU-SILC 913 3.2.2 Allocating time within the household 915 3.3 Pricing household production 916
4 Results and discussion 917
4.1 Age profiles of household production by gender 917 4.2 Age profiles of consumption by gender 921 4.3 Age profiles of time transfers by gender 924 4.4 The aggregate value of household production in 14 European
countries
927 4.5 Age profiles of household production, consumption, and net time
transfers by gender in monetary terms
928 4.6 National Time Transfer Accounts combined with National Transfer
Accounts
929
5 Conclusions 931
6 Acknowledgements 932
References 933
Household production and consumption over the life cycle:
National Time Transfer Accounts in 14 European countries
Lili Vargha1
Róbert Iván Gál 2
Michelle O. Crosby-Nagy3
Abstract
BACKGROUND
While the importance of unpaid household labour is recognised in total economic output, little is known about the demographics of household production and consumption.
OBJECTIVE
Our goal is to give a comprehensive estimation on the value of household production and its consumption by age and gender and analyse nonmarket economic transfers in 14 European countries based on publicly available harmonised data.
METHODS
We introduce a novel imputation method of harmonised European time use (HETUS) data to the European Union Statistics on Income and Living Conditions (EU-SILC) in order to assign time spent on home production to consumers in households and estimate time transfers. Moreover, monetary values are attributed to household production activities using data on earnings from the Structure of Earnings Survey (SES).
RESULTS
We show that the nonmarket economic life cycle of men differs from that of women. The gender gap in household production is not evenly distributed over the life cycle. Women of working age contribute the most in net terms, while the main beneficiaries of household goods and services are children and to a lesser extent adult men. These patterns are similar across countries, with variations in the gender- and age-specific levels of home production and consumption.
1 Hungarian Demographic Research Institute. Doctoral School of Demography and Sociology, University of
Pécs, Hungary. E-Mail:[email protected].
2
Hungarian Demographic Research Institute. TARKI Social Research Institute. Corvinus University, Budapest, Hungary.
CONCLUSIONS
In Europe, in the national economy, intergenerational flows are important in sustaining both childhood and old age. In contrast, in the household economy, intergenerational transfers flow mostly towards children.
CONTRIBUTION
We add a new focus to the research on household production: While keeping the gender aspect, we demonstrate the importance of the life cycle component in household production.
1. Introduction
In order to analyse the role of age composition in macroeconomic issues, Lee and Mason (2011a) opened a new chapter in national accounting: National Transfer Accounts (NTA). The project developed a methodology to disaggregate national accounts by age and explored how different generations acquire and use economic resources by examining age patterns in market economic activity and drawing inter-age transfers. Nevertheless, economic flows generated by household production are missing elements in the NTA resource reallocation framework. Services provided in the household – such as care, cooking, shopping, and cleaning – constitute an important part of intergenerational transfers. In order to estimate how these nonmarket economic activities vary by age and by gender and to assess the providers and the beneficiaries of household products and services within these groups, different calculations are needed. The estimations are recently carried out for many countries within the global NTA project network. In this paper we provide comparative calculations for 14 European countries, representing about 80% of the population of the EU.
accounts, the calculations are crucial to make women’s total economic contribution and the resources flowing to children more visible. The comparative quantification would also enable easier observation by policy makers and the public.
By accounting for goods and services carried out for someone else in the household or living in another household, we analyse how nonmarket economic activity varies by age and gender. Following Donehower (2014, earlier version from 2011) we call these estimations the National Time Transfer Accounts (NTTA). These accounts include cross-sectional age profiles (averages by age and gender) of household production and consumption as well as net time transfers. Net time transfers are calculated by subtracting production from consumption, age group by age group, and they show whether an age group is a net beneficiary or net provider of household products and services. In addition, we attribute monetary values to these activities and calculate the value of transfers in the household economy. Adding the age dimension comprehensively is essential to combine and compare intergenerational resource reallocation patterns of national and household economies across countries. In the analysis we cover the following EU member states for which we found data in the HETUS web application: Belgium, Bulgaria, Estonia, Finland, France, Germany, Italy, Latvia, Lithuania, Poland, Slovenia, Spain, Sweden, and the United Kingdom.
Calculation of NTTA is based on time use surveys, wage data, and the methodology by Donehower (2014). In order to use HETUS data, however, we have to supplement this methodology. We introduce a special imputation method of HETUS data to representative surveys (in our case, the EU-SILC) in order to allocate time spent on home production among members in the household. We also use harmonised European wage data (from the SES) so that we end up with comparable home production measures in monetary terms.
We show that the nonmarket economic life cycle of men differs significantly from that of women. Several studies have demonstrated that, even in societies that are sensitive to gender equality, women usually do more unpaid labour in the household than men, while men are more active in the labour market (Goldschmidt-Clermont 1987; Ironmonger 1996; Giannelli, Mangiavacchi, and Piccoli 2011; Miranda 2011; Francavilla et al. 2013). Women’s contribution, unaccounted for in the national income, is higher than that of men. By introducing age next to the gender aspect, we show that this difference holds true not only at the aggregate level, but for all ages. The disparity is not evenly distributed over the life course. There are two clear peaks for women: The first one appears during childbearing age and the second after retirement. In the case of men, the second increase after retirement is more pronounced than the first.
net beneficiaries of household production during almost their entire life cycle. Nevertheless, in cross-section, the amount received by working-age and older men is less than the amount received by children. Intergenerational reallocation in the household economy is more important in financing childhood than in financing old age, and there is a smaller amount of reallocation across genders, especially in older ages.
The paper is structured as follows: In the next section we briefly review the approach of NTA and the first results of NTTA estimations. In section 3 we introduce our data and methods of creating comparative NTTA in 14 countries. In section 4 we present our overall results and point out key country-specific results, along with a brief discussion. In the last section we summarise our results and conclude.
2. National Transfer Accounts and National Time Transfer Accounts
The most important basic activities that determine the economic life cycle are working, consuming, sharing, and saving. NTA measures the age profiles of these economic activities: labour income, consumption, public transfers, private transfers, and asset-based reallocations. NTA also shows how these economic activities vary across different generations. The aggregate numbers of these age profiles are consistent with the European System of Accounts, which administers flows among institutions (government, households, and corporations). The NTA framework therefore introduces the age dimension into national accounting and offers a new way to analyse how resources are reallocated between age groups. The method of NTA was established by Lee (1994a, b) and Mason et al. (2009). An NTA manual was published by the Population Division of the United Nations (United Nations, 2013). A comprehensive introduction to the method, including theoretical foundations, comparative results, and a wide range of country studies can be found in Lee and Mason (2011a).4
During childhood and old age, average consumption is higher than average labour income. This difference between average consumption and average labour income is called life cycle deficit (LCD) if positive and life cycle surplus (LCS) if negative. Labour income in NTA includes wages, most of mixed income, as well as all types of labour-related taxes. Consumption consists of private consumption as well as of consumption of goods and services provided by the public sector (such as public health care, education, general public goods) less taxes levied on consumption. While consumption does not vary much with age, labour income is concentrated in working ages, and it is minimal or zero in childhood and old age. Those of working age tend to consume less than their labour income, which results in an LCS. Meanwhile, those who
are not of working age consume more than their labour income, which results in an LCD.
Whenever consumption exceeds production, there is a period of dependency that has to be financed through monetary flows: by (1) public transfers via government (taxes; benefits and services), or (2) private or familial transfers, mostly within the household, or (3) asset-based reallocations (net capital income and property income). In childhood and old age the average individual is economically dependent because their consumption has to be covered by the output produced by the working-age population. The difference between consuming and producing explains the flows from one generation to another.
There are numerous studies on intergenerational transfers; however, they tend to focus on segments of the reallocation system instead of the system as a whole. NTA provides a framework for such analyses and also makes it possible to analyse the transfer system as whole. There are three major benefits of NTA: first, focusing on the individual instead of institutions; second, covering the full set of transfers in the generational economy including private transfers5; and third, considering each generation in the reallocation system – children, the working age, and older populations. Recent developments in NTA also measure gender-specific production and consumption patterns and reallocation between genders (e.g., Hammer, Prskawetz, and Freund 2015; Renteria et al. 2016).
NTA, however, only partly covers resource reallocation within the household because it does not include household production. Activities such as different types of housework and care (such as cooking, cleaning, making home repairs, or caring for children or others) also play an important role in the process of reallocating resources between age groups and genders.
Extending measures of national income with the value of goods and services produced at home is not new. These estimations require special considerations, as the output of home production is not observed by surveys, and there is no market mechanism that values it. Calculations are based on time use surveys and a pricing procedure. First estimates of Household Satellite Accounts (HSA) were published in the late 1990s and early 2000s (e.g., Ironmonger 1996; Holloway, Short, and Tamplin 2002; Soupourmas and Ironmonger 2002; Sik and Szép 2003). Comparative accounts are also accessible, mostly for European and OECD countries (Goldschmidt-Clermont and Pagnossin-Aligisakis 1995; Giannelli, Mangiavacchi, and Piccoli 2011; Miranda 2011).
5 NTA estimates age patterns of primary allocation and secondary redistribution of income as well as a
Adding the dimension of age into the household economy, and incorporating transfers of household goods and services in the general reallocation system is a new direction of research that extends the basic NTA and HSA frameworks. The first initiative was Phananiramai (2011) on estimating time transfers for Thailand, followed by the elaboration of a comprehensive methodology by Donehower (2014), after which many researchers began to apply national time use surveys to estimate NTTA and to extend NTA with them. The first results and analyses on Europe are available for Austria (Hammer 2014), France (Solaz and Stancanelli 2012; d’Albis et al. 2013), Germany (Kluge 2014), Hungary (Gál, Szabó, and Vargha 2015), Italy (Zannella 2015), Slovenia (Sambt, Donehower, and Verbic 2016), and Spain (Renteria et al. 2016), all of which provide insightful analysis about the reallocation patterns of individual countries. As a part of the Counting Women’s Work Project,6 research teams in Africa, Latin America, and Asia also work on estimating household goods and services flowing across different ages and genders.
Full comparative NTTA is still missing in Europe. Pioneer approximations of comparative accounts have been presented by Zagheni and Zannella (2013), Hammer, Prskawetz, and Freund (2015), and Zagheni et al. (2015). These estimations, however, have limitations, for they fail to account for children in their intergenerational accounts of household goods and services, while tending to focus on working ages, older populations, and gender disparities in production patterns. We find this problematic as economic dependency cannot be fully explained by accounting for only two of the three generations. As an improvement upon these earlier works, we include all generations of children in our analysis, and in this way account for all time that is produced and consumed in the households. Also, the pioneer approaches do not price household labour, making it impossible to extend NTA with NTTA, or they use a single wage for all activities of household labour. In this paper we differentiate between the values of various household production activities.
3. Data and methods of constructing harmonised European National
Time Transfer Accounts
The main steps of constructing NTTA by Donehower (2014) are (1) identifying time spent on household production activities by age and gender in time use surveys; (2) finding appropriate wages to impute the value of time spent on the chosen activities; and (3) estimating consumption of household labour by allocating the time produced by members of the household. The last step is performed using the household roster of
time use surveys that includes information about the household composition as well as the age and gender of all household members.
Researchers could easily apply this method by using national time use surveys. However, for international comparisons working with separate national datasets, it is often not feasible or would require considerable resources and time. The publicly available HETUS7 and the Multinational Time Use Study (MTUS)8 have the advantage that they include harmonised and comparable European data. Activities and other important variables are already standardized, making the first part of creating European NTTA relatively straightforward.
These data sources, however, are insufficient in that they do not include the household roster and contain only limited information about household composition. Moreover, the HETUS application calculates user-defined and comparable statistical tables, but it is not a micro-database per se. Consequently, more assumptions and methodological decisions are required when using harmonised time use data for estimations of consumption of household goods and services than when using national time use surveys. We therefore supplement the original methodology by Donehower (2014) to account for these special features of the harmonised data that is available. To allocate time spent on home production among consumers in the households, we introduce a special imputation method of harmonised time use data to representative survey samples. The estimations have some flaws and limitations because of this data structure, which we discuss in more detail below. The method, however, makes it possible to calculate comparative gender and age-specific household production and consumption in as many European countries as possible. In this article we present results based on the HETUS database. HETUS provides time use data at a high level of comparability as harmonisation is done prior to data collection. Results calculated using MTUS, which are also are generated in a time series for several countries, are discussed by Vargha et al. (2016) and Šeme et al. (2016).
In the following section we present our methodology in more detail: (1) how we calculate production by age and gender, (2) how we allocate the household goods and services produced among household members for estimating consumption of unpaid household labour, and (3) how we introduce harmonised pricing of European household production based on the SES. Our gender- and age-specific estimations are accessible at http://witt.null2.net/shiny/agenta/.
7 HETUS is an effort by the EU to harmonise European time use surveys. All important information,
documentation, and metadata can be found on its website:https://www.h2.scb.se/tus/tus/default.htm. 8
MTUS offers harmonized episode and context information encompassing over 60 datasets from 25 countries. See more by Fisher and Gershuny (2016) and on the website of the project:
3.1 Estimating household production by age
We estimate average time spent on unpaid household labour by age and gender on an average day by using data downloaded from the HETUS website.9We select activities of household production10 based on the ‘third-person principle’: activities that can be done by someone else (a third person) on behalf of the respondent, such as cooking, cleaning, making repairs, shopping, or caring for someone else. Table 1 summarizes the selected activities of household production in the case of the HETUS data. We also omitted parallel activities.11Averages in minutes were downloaded by gender for every age in each country, giving us three types of household production age profiles: general housework, childcare, and inter-household labour.12
Table 1: Categories of household production activities in HETUS
HETUS
Total household production
General housework activities
Food preparation; dish washing; cleaning the dwelling; other household upkeep tasks; laundry; ironing; handicrafts; gardening; tending domestic animals; caring for pets; walking the dog; construction and repairs; shopping and services; other domestic work; organisational work; travel related to shopping
Childcare activities Physical care and supervision of child; teaching, reading, and talking to a child; transporting a child
Inter-household activities Informal help provided to other households
The gender-specific age profiles are smoothed one by one with Friedman’s Super Smoother in Stata (supsmooth by Luedicke 2015). We smooth production age profiles for a specific age group. The youngest age groups (usually below age 10), whose household production values are 0, are not included in the smoothing procedure, nor is
9
In Table A-1 we summarise the details of representative national time use surveys included in HETUS and our analysis (such as the year of the national data collection, sample size, and the age of the population covered).
10 Parts of household production are included in national income, such as food production for own
consumption and construction of the owner-occupied house. Since we add up intergenerational transfers in the national and the household economy, it would be preferable to avoid double registration of activities. However, we are not able to filter out these activities using the HETUS data, and the activities are therefore included in both accounts. Such overlaps are marginal in Europe but could be more significant in other regions.
11
Time use questionnaires usually allow parallel (or ‘secondary’) activities, such as cleaning the dishes and helping a child with homework, to be recorded at the same time. However, as a result of the apparent variance in the coding practice in the national samples – and in line with the Donehower methodology – we left these secondary activities out of our analysis.
12
the oldest old age group, in our case 80 years old or older. The reason for this latter step is twofold: We do not want to underestimate household production for the 79-year-old or younger, nor to overestimate household production for the 80-year-old and older. For this reason, we use the unsmoothed value in the 80+ age group.
3.2 Estimating consumption of household production by age
NTTA introduces two novelties into the analysis of time use and to HSA. First, it measures household production by age. Second, it measures age-specific consumption of the goods and services produced in the household. In the following section we introduce our novel imputation method of HETUS data to nationally representative household surveys in order to assign time spent on home production to consumers in households.
3.2.1 Imputing time use to EU-SILC
Time use surveys do not record the consumption of the products and services of nonmarket labour. Consequently, consumers have to be identified indirectly. In the case of allocating intra-household production, estimations are based on household structure and the time spent on household production for each member in each household. However, as mentioned above, the HETUS data is not microsurvey dataper seand does not allow for individual variation of production. HETUS allows downloading only multidimensional tables with a minimum cell frequency of 25 persons. Following this structure we can only use these cell averages by different combinations of the characteristics of the producers. The other constraint is that we have only limited information on household structure as the data does not include the household roster and contains only limited information about household composition. For example, we know how many children13there are in the age groups 0–7 and 7–17, and we also know the age of the youngest child in the household, but we do not have information about the exact ages of all children in the household.
For these reasons, we impute average time figures of production in each country to a survey sample by age, gender, and household type. This allows us to consider information on the household structure taken externally from national representative surveys. In order to calculate consumption of household services by age and gender, we
aggregate the imputed time values at the household level and allocate it to the members of each household, using various sharing rules that depend on the type of activity.
In developing this procedure we depart from Bruil and van Tongeren (2014), who imputed production values of unpaid household labour by age group and gender to the Dutch census for estimating consumption by age. Giannelli, Mangiavacchi, and Piccoli (2011) also applied an imputation method using a simple variable called ‘life cycle’ that combines large age groups with the family status of the individual. They imputed HETUS time use by gender and life cycle to EU-SILC for a cross-country analysis of total home production in Europe. Our aim is to use as many household types as possible in order to keep the maximum variation of household production. We extend both of these methods for our purposes by imputing values of production by smaller age groups, gender, and a more detailed household structure. In characterising the household structure, one of the most important pieces of information is the age of children living in the household as previous estimations by Hammer (2014) have shown that the age of the child is a crucial factor in explaining the amount of childcare and other services produced in the households. Using information of the HETUS dataset about the household of the producer,14 we create 12 types of households in the case of allocating time spent on housework15 and 18 types of households in the case of allocating time spent on childcare.16 For every combination of age, gender, and household type, two average values are calculated, one for housework and one for childcare. Then in each national sample these time measures are assigned to each individual matching their gender, age, and household type. We do not have access to censuses for many countries; therefore, we use the harmonised register sample of the EU-SILC survey.17
14
The HETUS variables applied in our household taxonomy are number of household members, number of children younger than age 7, number of children aged 7–17, and the age of the youngest child in the household.
15 Originally, we created nine default household types: 1. Single with no children; 2. Two or more household
members with no children; 3. One child aged 0–3; 4. One child aged 4–6; 5. One child aged 7–17; 6. Two children, one aged 0–3, the other aged 7–17; 7. Two children, one aged 4–6, the other aged 7–17; 8. Two or more children, with a minimum of two aged 0–6 and the youngest aged 0–3; 9. Two or more children aged 7– 17 but no smaller children. Three extra household types had to be added because the default HETUS types did not cover a few individuals in the EU-SILC sample. In these cases we could use information about the youngest child. These are as follows: 10. Youngest child aged 0–3; 11. Youngest child aged 4–6; 12. Youngest child aged 7–17.
16
In the case of childcare, only one HETUS variable is used in the taxonomy of households: the age of the youngest child (age 0, 1, 2, 3, etc., up to the age of 17). Thus, the first type constitutes households with the youngest child aged 0; the second type includes households with the youngest child aged 1, etc., up to the 18th type, which includes households with the youngest child aged 17.
17
The imputation is not without deficiencies. Due to limitations of HETUS, it is not possible to extend the imputation process with more dimensions. We do not include variables such as activity status, marital status, educational level, and so on, which most likely affect time use and particularly the time spent on domestic housework and childcare. We think that a variable set of age, gender, and a detailed household structure best fits our purposes to estimate consumption of household goods and services by age and gender. Our estimations are also comparative across the 14 European countries. For more detailed microeconomic analysis, the original surveys have to be used.
3.2.2 Allocating time within the household
Once intra-household production values are assigned to every individual in each household, we could aggregate the time spent on nonmarket activities at the household level and allocate it to each member. Estimating economic flows of home production between individuals living together relies on a simple model of the household. Since goods and services produced by housework (e.g., cleaning) usually represent household public goods, following Donehower (2014) we assume that each household member consumes the same share of these services.18
Childcare is consumed only by children, and the allocation is straightforward in all households with only one child present. If there is more than one child living in the household, time has to be distributed among these children. For this we apply data-driven weights (an equivalence scale) generated separately for each country.19 Having the production age profiles by different household type allows us to identify childcare performed in households without children, such as when grandparents care for their non-cohabiting grandchildren. This time is allocated in the same way as time consumed by children within the household and added to the general childcare consumption age profile. Inter-household labour is distributed by intra-household consumption patterns.
After allocating consumption to household members, we calculate the age averages for men and women by taking means over age groups in the different EU-SILC samples. The final gender-specific age profiles are smoothed separately for
18 Institutionalized elder populations are excluded from the survey populations of the HETUS surveys and
EU-SILC samples as well. This does not distort our results, however, because the transfers that these populations receive are through the market, captured by NTA (mostly private or public health care services).
19 We have downloaded average time spent on childcare for all households with the smallest child being 0, 1,
housework, childcare, and inter-household unpaid work, using Friedman’s Super Smoother. In the case of housework consumption, smoothing is done for the age group 0–80+. For childcare we smooth consumption age profiles for ages 0–17. For infants (0-year-olds) the original unsmoothed value is used so as not to underestimate the value (Donehower 2014). The total amount of household production in a country has to be consumed by the population; therefore, some minor adjustments are needed after the calculations in EU-SILC. For adjusting consumption profiles by age and gender to total household production figures, we use Eurostat population data by age and gender. To see whether our HETUS estimates are robust across countries, we compare our profiles with the age profiles estimated from national time use surveys. In the Appendix we describe these robustness checks for France (1999) by using estimations by Solaz and Stancanelli (2012) and for Italy (2003/2008) by using calculations by Zannella (2015).
3.3 Pricing household production
In order to account for the value of home production in NTTA, we apply a pricing procedure. The literature distinguishes between the output and the input method of valuing household production. In principle, output pricing would be preferable, as it allows the differences in productivity and economies of scale to be taken into account (see Gál, Szabó, and Vargha 2015; Vargha et al. 2016). However, time use surveys or any other comparative household surveys do not include information about the output of household production. Other data on output – such as the imputed rent of a home and the value of household durables – is also very limited. For this reason we follow almost all studies on the value of household production and apply the input approach by assigning wages to the different household activities. Since much of household work requires basic or no skills, the opportunity cost approach (using the wage of the person who is doing the household work) assigns higher value to household labour than the replacement wage approach assigns, in particular for tasks done by men. We therefore apply the specialist replacement wage, in line with Donehower (2014).
Most skills applied in household production in fact belong to the unskilled category; no higher degree is required to perform these activities. This would make any pricing of household labour based on average wages overpriced. In order to present a more fine-tuned and representative picture of household economies by country, we match activities to occupation categories. Data for valuing home production for the 14 HETUS countries comes from the four-yearly waves of the SES.20 Our calculations are
20
based on the 2002 wave. Pricing of time use profiles from HETUS is conducted in four steps: assignment of HETUS activities to ISCO occupational codes,21 extraction of wages per minute by occupation using the SES,22 adjusting to employer-paid taxes and contributions,23 and rescaling for cross-country comparisons.
4. Results and discussion
4.1 Age profiles of household production by gender
Figure 1 shows the average time spent on household production by age and gender in the 14 countries. Total production is shown on the right panel, and the three different activities (housework, childcare, and inter-household unpaid labour) are shown separately on the left panel. People start working in the household at a young age, probably at even younger ages than indicated here, because most national samples exclude children below the age of ten. A gender gap is present already in childhood, as girls spend more time with unpaid household labour than boys. The gap grows larger with age and reaches its maximum between ages 30 and 40. Around this age, there is a peak in the amount of unpaid work provided by women in all countries because of the provision of childcare. On average women in their 30s work more than 5 hours at home per day, while the average time spent on home production by men of the same age is only 2.5 hours – almost 3 hours less. For men, the peak at this age is less pronounced than for women, as they spend significantly less time on childcare – on average, 0.5
Eurostat. More information about SES can be found here: http://ec.europa.eu/eurostat/web/microdata/ structure-of-earnings-survey.
21
For each household production activity one occupational code is chosen using the International Standard Classification of Occupations (ISCO-88) applied in SES 2002 (see Table A-4 for a more detailed list of codes).
22 We use the median hourly earnings by occupation. The average is sensitive to extreme values and the
median value provides a better representation of the central tendency of these occupational wages. We did not access the SES 2002 microdata for Germany and Slovenia; therefore, in these two cases we use wages from the Eurostat website based on the SES 2002 survey. For these countries we have to limit ourselves to the major ISCO-88 groups. The Eurostat website provides the average hourly earnings by occupation, which we then adjust with an average mean–median ratio calculated from the microdata. In the case of the activity ‘Teaching, reading and talking to a child’ we use wages of ISCO 4 not to overestimate the value with the wage of ISCO 3. Similarly to this approach if SES microdata for certain chosen ISCO codes are occasionally missing for some countries in the database, we substitute the value with the adjusted data from the Eurostat website. This happened in the cases of Belgium (ISCO 83, ISCO 91–93) and Finland (ISCO 33) only.
23 The SES provides employee gross earnings with the exclusion of taxes and contributions paid by
hours. The peak in the childcare age profile for men is also shifted a few years forward, as the average age of becoming a father is higher than that of becoming a mother.
Time spent on producing goods and services in the household increases again after retirement, and this increase is higher for men. The curve for men increases until the age of 70 and reaches a maximum of 4 hours of household production, while for women the maximum is 6 hours at the age of 64 on average in the 14 European countries. Consequently, the gender gap in household production gets smaller with age. On average the second peak for women in their 60s is only a little higher than the first peak for women in their 30s.
Figure 1: Daily per capita production of childcare, housework, and inter-household unpaid labour by age and gender in hours in 14 European countries around 2000
Notes: Simple average of the 14 countries with comparative time use data from early 2000s
Source: Own calculations based on HETUS data
Sweden at this age interval (and also at older ages). Cultural as well as institutional settings (such as paid parental leave entitlements for mothers and fathers, access to day care and preschool, school systems) have an effect on these differences. In Belgium, for example, paid maternity and parental leaves are shorter, but those reserved for fathers are among the highest among the countries. The Swedish system is similar (OECD Family Database24). In contrast, in Italy and Poland, paid maternity and parental leaves are longer, but father-specific parental leaves are the shortest, and participation in formal childcare is also rather low (OECD Family Database).
There is considerable variation across countries in the shape of the production profile around retirement age as well. There are countries with a sharp increase, such as Germany and Lithuania (for women), and countries showing a smoother transition, such as Latvia. Country-specific retirement processes might explain this variance. The most time spent on production by older men is found in Bulgaria and Estonia, mainly as a result of high values in gardening, tending domestic animals, and construction and repairs. The least time spent on household production by men is in Italy and Spain.
Figure 1 also shows that, in general, inter-household unpaid labour, as well as childcare provided (most likely) by grandparents, are small compared to intra-household home production. Between age 60 and 75 the average time spent on inter-household care and childcare combined is only 14 minutes for men, and it is only 18 minutes for women on an average day. The highest values can be found in France, Poland, and Slovenia, where these figures are higher than 20 minutes for both genders. It is hard to use diaries to capture informal help provided to other households because this help does not typically take place every day; therefore, the figures might be somewhat underestimated.25 This is also a reason why these numbers are so much lower than those for intra-household activities.
24 The OECD Family Database was developed to provide cross-national indicators on family outcomes and
family policies across the OECD countries:http://www.oecd.org/els/family/database.htm.
25
Figure 2: Daily per capita production of childcare, housework, and inter-household unpaid labour by age and gender in hours in HETUS countries around 2000
Notes: X axis: Age; Y axis: Average hours per day
4.2 Age profiles of consumption by gender
Figure 3 shows the gender and age-specific consumption of household goods and services, in other words the average time consumed in the 14 European countries by age and gender. Total consumption is shown on the right panel, and the three activities (housework, childcare, and inter-household unpaid labour) are shown separately on the left panel. The figure demonstrates that consumption of household services for both genders is relatively small in active age but twice as much in old age and even more for small children ‒ a pattern that is found in all countries (Figure 4). Consumption is highest for the newborn: An average child aged 0 consumes almost 7 hours of household production in the 14 European countries. The left panel of Figure 3 shows that the high consumption of young children is due to the high value of care they receive in time. The consumption of childcare time decreases steeply with age. On average it is 5 hours for infants (0-year-olds), 4 hours for 1-year-olds, and 3 hours for 2-year-old children in the 14 European countries, while an 8-2-year-old child receives 1 hour and a 12-year old only half an hour. The age profile of childcare consumption falls to a mere 8 minutes by the age of 17.
For working-age adults (age 19–65) the consumption of goods and services produced by housework is 2.9 hours per day on average, and the consumption curve reaches its minimum between age 30 and 40, with a value around 2 hours. After age 40 consumption starts to rise because of the increase in the production of housework activities other than childcare, and also because children grow older and start to work more and more in the household as well. Eventually they move out from the household, which results in more consumption by the older age groups. The per capita consumption by the elderly (65+) is on average 4.4 hours in all countries combined, and the consumption age profile reaches a second maximum (4.7 hours) around age 70. Receiving pensions allows the population to abstain from paid work and devote the time to household production, which is then mostly consumed by the same age groups. Since consumption of housework is distributed evenly, consumption patterns are similar for men and women.
Figure 3: Daily per capita consumption of childcare, housework, and inter-household unpaid labour in hours by age and gender in 14 European countries around 2000
Notes: Simple average of the 14 countries with comparative time use data from early 2000s
Source: Own calculations based on HETUS data
factor, fertility, also has an effect on the results of childcare consumption, as lower fertility tends to increase time transfers per child (Vargha and Donehower 2016).
Figure 4: Daily per capita consumption of childcare, housework, and inter-household unpaid labour by age and gender in hours in HETUS countries around 2000
Notes: X axis: age; Y axis: average hours per day
For working ages the average time consumed in a day is 2.9 hours. National values vary between 2.5 hours (Sweden) and 3.2 hours (Bulgaria, Estonia, and Slovenia). Per capita consumption by the elderly (65+) is on average 4.4 hours in all countries combined. It is the highest in Estonia (5.1 hours) and the lowest in Spain (3.8 hours), where the contribution of men in production is among the lowest.
4.3 Age profiles of time transfers by gender
Net time transfers are calculated by subtracting production from consumption, age by age. They are the nonmarket counterpart of life cycle deficit and surplus (LCD/LCS) of the national economy. They show the amount of household goods and services flowing among people of different age groups and genders in net terms. Age profiles of net time transfers by gender are presented in hours in the 14 European countries, indicating whether an age group is a net giver or receiver of home goods and services. Age groups with negative values are net givers of time transfers, while age groups with positive values are net receivers. The figure shows that while men are generally net beneficiaries, women produce a huge surplus in the household economy. Women are net providers above age 21 almost until they die, and the average net time they give is 1.7 hours of work on an average day.
Figure 5: Daily per capita household production and consumption and net time transfers by age and gender in hours in 14 European countries around 2000
Notes: Simple average of the 14 countries with comparative time use data from early 2000s
On average, the main receivers of services produced within the households are clearly young children in the 14 countries. The biggest givers are their mothers, usually women at age 25 to 45. Above this age the surplus that women produce declines gradually, shown by the increase of the red line on the right panel of the graph. Women are still net givers, but with their children growing up and becoming independent, they give less and less time to others in net terms on average. Table 2 shows that while working-age women contribute 2 hours, older women (65+) give 0.9 hours of household work in net terms. Men, on the other hand, are net givers only between ages 30 and 49. After the childrearing period, the net time transfer benefiting men increases with age and reaches a maximum for the oldest old (age 80+) with 0.8 hours of net time transfers.26 There is a clear inter-gender reallocation in the household economy, especially at the end of the life cycle. Net time transfers received by adult men, however, is lower than the per capita net transfers flowing to children, even in countries where men’s participation in household production is the lowest, such as Italy and Spain. Women 80 years old or older also receive some time transfers on average, although not in every country.
Table 2: Daily per capita household production and consumption and net time transfers in hours in 14 European countries around 2000
All ages
Age group
0–17 18–64 65–
Total Men Women Total Men Women Total Men Women Total Men Women
Production 3.2 2.2 4.1 0.5 0.4 0.6 3.6 2.4 4.7 4.7 3.8 5.3
Consumption 3.2 3.0 3.3 3.4 3.3 3.4 2.7 2.6 2.7 4.4 4.2 4.4
Net Time
Transfers 0 0.8 –0.8 2.9 2.9 2.8 –0.9 0.2 –2.0 –0.3 0.4 –0.9
Notes: Simple average of the 14 countries with comparative time use data from early 2000s
Source: Own calculations based on HETUS data, EU-SILC, and Eurostat population data
26
Figure 6: Daily per capita net time transfers by age and gender in hours in HETUS countries around 2000
Notes: X axis: age; Y axis: average hours per day
Source: Own calculations based on HETUS, EU-SILC, and Eurostat population data
well as during childrearing ages. The contribution of Italian, Polish, and Spanish women of childbearing age in net terms is almost an hour more than that of women in Belgium and Latvia of the same age. In some countries, such as Italy and Latvia, all age groups of men are dependent on the housework of women. In these countries there are no age groups of men who are net providers of household goods and services. In Bulgaria as well as in Spain, the surplus they provide is also very small (less than five minutes per capita). In these countries the amount received by younger adult men who are in their 20s and 30s is also higher than elsewhere. Nevertheless, in Sweden (and to a lesser extent in Belgium, Finland, Germany, and Poland) the net contribution of men around childrearing ages is significantly higher, compared to the average.
4.4 The aggregate value of household production in 14 European countries
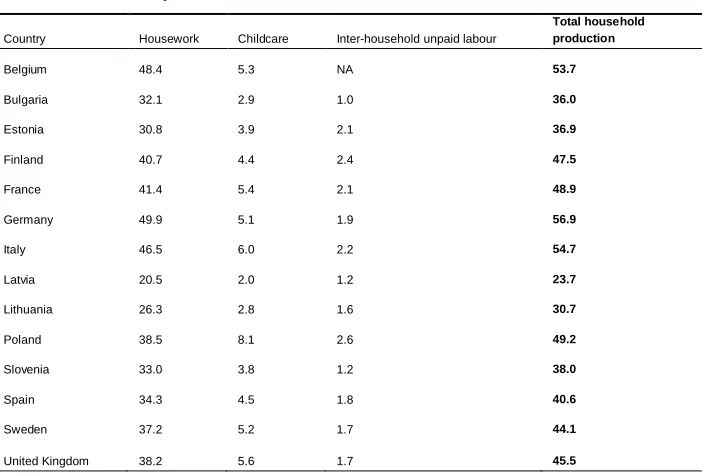
After pricing time use activities, we can give an approximation of the total value of household labour and estimate economic activity that is not accounted for in national accounts. Table 3 shows the estimated value of labour devoted to home production of the various nonmarket services as a percentage of GDP in each country using the HETUS time use profiles and SES wages. The total value of household production varies between 23.7% in Latvia and 56.9% in Germany; the average ratio in the 14 countries is 43.3%.27 Most of this value constitutes housework (between 20.5% and 49.9% of GDP in Latvia and Germany, respectively), while a smaller amount is produced as childcare (between 2% and 8.1% of GDP in Latvia and Poland, respectively). The value of services provided for other households varies between 1% of GDP in Bulgaria and 2.6% of GDP in Poland.
27 These results are similar to Giannelli, Mangiavacchi and Piccoli (2011). They estimate the gross value of
Table 3: Total aggregate value of household production by type of activity and country as share of GDP in 2002 (%)
Country Housework Childcare Inter-household unpaid labour
Total household production
Belgium 48.4 5.3 NA 53.7
Bulgaria 32.1 2.9 1.0 36.0
Estonia 30.8 3.9 2.1 36.9
Finland 40.7 4.4 2.4 47.5
France 41.4 5.4 2.1 48.9
Germany 49.9 5.1 1.9 56.9
Italy 46.5 6.0 2.2 54.7
Latvia 20.5 2.0 1.2 23.7
Lithuania 26.3 2.8 1.6 30.7
Poland 38.5 8.1 2.6 49.2
Slovenia 33.0 3.8 1.2 38.0
Spain 34.3 4.5 1.8 40.6
Sweden 37.2 5.2 1.7 44.1
United Kingdom 38.2 5.6 1.7 45.5
Notes: Values represent the total labour cost of household production activities. (See more at section 3.3.)
Source: Own calculations based on HETUS, SES, Eurostat National Accounts, and population data
4.5 Age profiles of household production, consumption, and net time transfers by gender in monetary terms
beneficiaries of home production receiving on average an equivalent of 4% of per capita GDP. Among men 80 years old or older, it grows up to 11%.
Figure 7: Per capita household production and consumption and net transfers of household products and services in monetary terms by age and gender in 14 European countries in 2002
Notes: Age profiles are normalised on per capita GDPs of the respective countries. Simple average of countries with comparable data from early 2000s
Source: Own calculations based on HETUS, EU-SILC, SES, Eurostat National Accounts, and population data
Looking at population-weighted country results, children receive 4% of aggregate GDP in Latvia against 15% of GDP in Poland in the form of household goods and services, with 40% and 56% of these services, respectively, provided as childcare. Net time transfers flowing to adult men (18 years old or older) are the highest in Italy and Spain, with 5% and 4% of aggregate GDP, respectively. Even in these two countries, however, which are characterised by the smallest male contribution to household production, the time transfers that children receive are, in aggregate terms, twice those of adult men (11% of GDP in Italy and 8% in Spain). The high levels of household goods and services provided by working-age women also appear in population-weighted terms. Even in Latvia, where the smallest amount is found, working-age women transfer 4% of aggregate GDP in the form of household goods and services. In Italy, where the population-weighted net contribution of working-age women is the highest, the value of net time transfers reaches 13% of GDP.
4.6 National Time Transfer Accounts combined with National Transfer Accounts
the household economy (the NTTA) (see Figure 8).28 In the national economy consumption is rather smoothly distributed over the life cycle, while production is concentrated predominantly in the working ages. The age profile of labour income and consumption in the left panel of the figure illustrates these patterns in nine European countries, representing 57% of the population of the EU.29 In Europe, hardly any potential new entrants to the labour market can get a job without completing secondary education. Consequently, the labour income profile rises steeply between the ages of 16 and 25. In contrast, people start working at a younger age in the household. As we have seen, the curve of home production has two peaks. Market labour income mostly disappears after retirement age, but people keep working in the household practically as long as they live. In this respect the dashed line in the centre panel resembles the age profiles characterising hunter-gatherer societies (see Lee and Mason 2011b).
Figure 8: Per capita production and consumption and the resulting life cycle deficit/surplus in monetary terms in the national economy, the household economy, and the total economy in nine European countries around 2000
Notes: Respective age profiles of NTTA are adjusted to the year of NTA data. Age profiles are normalised on the per capita value of labour income for people between age 30 and 49 in the respective countries. Total economy: combination of the national economy and the household economy.
Source: Own calculations based on NTA, HETUS, EU-SILC, HuTUS, SES Eurostat National Accounts and population data.
The solid lines in the first two panels represent LCD/LCS in the national economy and its equivalent in the household economy, net time transfers. The two curves are markedly different due to differences in the production and consumption profiles of the
28
Unfortunately we are not able to combine age profiles by gender, as NTA estimations by gender are not yet available for so many countries.
29
two sectors. In the national economy we find two streams of resources flowing in opposite directions from the working-age population to children and the elderly (above age 60 according to the LCD/LCS curve on the graph). In contrast, the household economy is characterised by a unidirectional flow from parents to children (in these nine European countries at least). The net amount of household services and goods received is high in childhood and much lower above the age of 60 (even for men). The youngest generation till the age of 6 receives more resources from the household economy than from the national economy, and the majority of these resources are from the childcare provided by parents and grandparents.
On the right panel of Figure 6 we combine the market and nonmarket sectors of the economy. Compared to the national economy we find that production of older ages is higher in the total economy and that the total LCD of children is larger than the total LCD of the elderly. Consequently, there are more resources flowing to children than previously thought once the household economy is accounted for; and these additional resources are provided mostly by the working-age groups. In the European case, families and welfare states are the most important vehicles of life cycle financing through intergenerational transfers; their respective roles, however, are different in the reallocation system (see more details in Gál, Vanhuysse, and Vargha 2016).
5. Conclusions
We showed how economic resources are produced and consumed in the household economy of 14 European countries. By comparing the age patterns of household production and consumption, we also demonstrated how home goods and services are transferred among different generations and genders. We found that reallocation in the household economy is important, principally in funding the consumption of children and to a lesser extent of adult men. Women are net providers of net time transfers once they grow up, and working-age women contribute by far the most in net terms, while men are net beneficiaries through most of their lives. The results reveal important differences across the countries in this regard that are linked to public policies for families and children. In Italy, all generations of men are dependent on the housework of women; there is no single male age group generating any household production surplus. In Sweden, however, net time given by working-age men is significant, the highest among the countries analysed. These two countries represent the two extremes in general: They have, respectively, the highest (Italy) and the lowest (Sweden) gender gap in the household economy at almost all ages.
in Italy). In childrearing the size and value of nonmarket economic transfers approximate those of market economic transfers. The investment of parents – in particular mothers – in the human capital of their children through the provision of household goods and services is sizeable in all European countries. Our calculations are crucial to make the resources flowing to children, and women’s total economic contribution, more visible. Older age groups hardly benefit from intergenerational time transfers in net terms. Yet household production plays an important role in their lives because, after retirement, they produce a considerable value in the household, where they keep working practically as long as they live. Our analysis demonstrates that there is a strong life-stage component next to the gender aspect in the reallocation patterns of the household economy.
6. Acknowledgements
References
Bruil, A. and van Tongeren, J. (2014). Analyzing wealth through an integrated economic and demographic framework: The case of the Netherlands. Paper presented at the Tenth Meeting of the Working Group on Macroeconomic Aspects of Intergenerational Transfers, Beijing, China, November 10–14, 2014. d’Albis, H., Bonnet, C., El Mekkaoui, N., Greulich, A., Navaux, J., Pelletan, J., Solaz,
A., Stancanelli, E., Toubon, H., Wolff, F.-C., and Xuan, H. (2013). Etude portant sur la répartition des prélèvements et des transferts entre générations en France. Paris: Commissariat Général à la Stratégie et à la Prospective.
Donehower, G. (2014). Incorporating gender and time use into NTA: National Time Transfer Accounts methodology, Version 4. [Unpublished manuscript]. Berkeley: University of California at Berkeley, Department of Demography. Fisher, K. and Gershuny, J. (2016). Multinational time use study: User’s guide and
documentation pertaining to data release 7. Oxford: Centre for Time Use Research.
Folbre, N. (2008). Valuing children: Rethinking the economics of the family. Cambridge: Harvard University Press.
Francavilla, F., Giannelli, G.C., Mangiavacchi, L., and Piccoli, L. (2013). Unpaid work in Europe: Gender and country differences. In: Bettio, F., Plantenga, J., and Smith, M. (eds.).Gender and the European labour market. London: Routledge: 53–72.
Gál, R.I., Szabó, E., and Vargha, L. (2015). The age-profile of invisible transfers: The true size of asymmetry in inter-age reallocations.Journal of the Economics of Ageing 5(1): 98–104.doi:10.1016/j.jeoa.2014.09.010.
Gál, R.I., Vanhuysse, P., and Vargha, L. (2016). Pro-elderly states, or child-oriented societies? Incorporating family cash and time into intergenerational transfers analysis. Vienna: AGENTA Working Paper Series (WP-2016-5).
Gershuny, J. (2011). Time-use surveys and the measurement of national well-being. Swansea: Office for National Statistics.
Goldschmidt-Clermont, L. (1987). Economic evaluations of unpaid household work: Africa, Asia, Latin America and Oceania. Geneva: International Labour Office. Goldschmidt-Clermont, L. and Pagnossin-Aligisakis, E. (1995). Measures of
unrecorded economic activities in fourteen countries. New York: Human Development Report Office (Occasional papers no. 20).
Hammer, B. (2014). The economic life course: An examination using National Transfer Accounts. [PhD thesis]. Vienna: Vienna University of Technology.
Hammer, B., Prskawetz, A., and Freund, I. (2015). Production activities and economic dependency by age and gender in Europe: A cross-country comparison.Journal of the Economics of Ageing 5: 86–97.doi:10.1016/j.jeoa.2014.09.007.
Holloway, S., Short, S., and Tamplin, S. (2002). Household satellite account (experimental) methodology. London: Office for National Statistics.
Ironmonger, D. (1996). Counting outputs, capital inputs and caring labor: Estimating gross household product. Feminist Economics 2(3): 37–64. doi:10.1080/13545 709610001707756.
Kluge, F. (2014). The economic lifecycle by gender – results combining monetary and time use estimates.Comparative Population Studies 39(4): 707–726.
Lee, R.D. (1994a). The formal demography of population aging, transfers, and the economic life cycle. In: Martin, L. and Preston, S. (eds.). The demography of aging.Washington, DC: National Academy Press: 8–49.
Lee, R.D. (1994b). Population age structure, intergenerational transfers, and wealth: A new approach with applications to the US. Journal of Human Resources 29(4): 1027–1063.doi:10.2307/146133.
Lee, R.D. and Mason, A. (eds.) (2011a). Population aging and the generational economy: A global perspective. Cheltenham: Edward Elgar.
Lee, R.D. and Mason, A. (2011b). Lifecycles, support systems, and generational flows: Patterns and change. In: Lee, R.D. and Mason, A. (eds.): Population aging and the generational economy: A global perspective. Cheltenham: Edward Elgar: 79–106.doi:10.4337/9780857930583.
Mason, A., Lee, R.D., Donehower, G., Lee, S.H., Miller, T., Tung, A.C., and Chawla, A. (2009). National Transfer Accounts manual. Hawaii: East-West Center (NTA Working Papers WP-2009-08).
Miranda, V. (2011). Cooking, caring and volunteering: Unpaid work around the world. Paris: OECD Publishing (OECD social employment and migration working papers WP No. 116).doi:10.1787/5kghrjm8s142-en.
National Transfer Accounts (2017). Counting women’s work: Measuring the gendered economy in the market and at home. Hawaii: East-West Center (NTA Bulletin, No. 11).
Phananiramai, M. (2011). Incorporating time into the National Transfer Accounts: The case of Thailand. In: Lee, R.D. and Mason, A. (eds.):Population aging and the generational economy: A global perspective. Cheltenham: Edward Elgar: 528– 541.doi:10.4337/9780857930583.00043.
Renteria, E., Scandurra, R., Souto, G., and Patxot, C. (2016). Intergenerational money and time transfers by gender in Spain: Who are the actual dependants?
Demographic Research 34(24): 689–704.doi:10.4054/DemRes.2016.34.24. Sambt, J., Donehower, G., and Verbic, M. (2016). Incorporating household production
into the National Transfer Accounts for Slovenia. Post-Communist Economies
28(4): 249–267.doi:10.1080/14631377.2016.1164962.
Šeme, A., Vargha, L., Istenič, T., and Sambt, J. (2016). The patterns of non-monetary transfers in Europe: A historical NTTA analysis by age and gender. Paper presented at the Demographic Dividend and African Development, 11th global meeting of the NTA network, Dakar, Senegal, June 20–24, 2016.
Sik, E. and Szép, K. (eds.) (2003). A háztartási termelés értéke a mai Magyarországon. (The value of household production in contemporary Hungary). Budapest: Hungarian Central Statistical Office.
Solaz, A. and Stancanelli, E. (2012). Time transfers within households along the lifecycle: A NTA and gender perspective. Paper presented at the Fifth European NTA Workshop, Stockholm, Sweden, November 8–9, 2012.
United Nations (2013). National Transfer Accounts manual: Measuring and analysing the generational economy. New York: United Nations.
Vargha, L., Šeme, A., Gál, R.I., Hammer, B., and Sambt, J. (2016). European National Time Transfer Accounts [electronic resource]. Vienna: Austrian Academy of Sciences. http://witt.null2.net/shiny/agenta/.
Vargha, L. and Donehower, G. (2016).The quantity-quality tradeoff: A cross-country comparison of market and nonmarket investments per child in relation to fertility. Paper presented at the European Population Conference, Mainz, Germany, September 1–3, 2016.
Zagheni, E., Zannella, M., Movsesyan, G., and Wagner, B. (2015). A comparative analysis of European Time Transfers between generations and gender. New York: Springer.
Zagheni, E. and Zannella, M. (2013). The life cycle dimension of time transfers in Europe. Demographic Research 29(35): 937–938. doi:10.4054/DemRes.2013. 29.35.
Appendix
Household production and consumption over the life cycle: National Time Transfer Accounts in 14 European countries
Table A-1: Summarised information on national time use surveys included in the HETUS database
Country Fieldwork period
Age of population covered
in the national survey Sample size
Age of population on HETUS website
Belgium 2005 12+ 12824 12+
Bulgaria 2001/2002 7+ 7603 10+ Estonia 1999/2000 10+ 5728 10+
Finland 1999/2000 10+ 5332 10+ France 1998/1999 15+ 15441 15+
Germany 2001/2002 10+ 12655 10–75 Italy 2002/2003 3+ 55760 10+
Latvia 2003 10+ 3804 10+
Lithuania 2003 10+ 4768 10+
Poland 2003/2004 15+ 20264 16+ Slovenia 2000/2001 10+ 6190 10+
Spain 2002/2003 10+ 46774 10+ Sweden 2000/2001 20–84 3998 20–84
United Kingdom 2000/2001 8+ 10366 10+
Table A-2: Survey years used for constructing NTTA in 14 EU countries
Country
Year of time use survey fieldwork period (Source: HETUS)
Population (Source: Eurostat)
Year of EU-SILC fieldwork period*
Year of SES fieldwork period
Belgium 2005 2005 2004 2002 Bulgaria 2001/2002 2002 2007 2002
Estonia 1999/2000 2000 2004 2002 Finland 1999/2000 2000 2004 2002
France 1998/1999 1999 2004 2002 Germany 2001/2002 2002 2005 2002
Italy 2002/2003 2003 2004 2002 Latvia 2003 2003 2005 2002
Lithuania 2003 2003 2005 2002 Poland 2003/2004 2004 2005 2002
Slovenia 2000/2001 2001 2005 2002 Spain 2002/2003 2003 2004 2002
Sweden 2000/2001 2001 2004 2002
United Kingdom 2000/2001 2001 2005 2002
Table A-3: Equivalence scales for allocating childcare with two or more children living in a household
Robustness checks
To see whether our HETUS estimates are robust across countries, we compare our profiles with the age profiles estimated from national time use surveys. We are able to compare our profiles with the age profiles estimated from national time use surveys in two cases: for France (1999) and Italy (harmonised results from 2003 with results from national profiles of 2008). Solaz and Stancanelli (2012) estimate French production and consumption age averages from the original national time use survey, the source of the French HETUS aggregates we used. Production profiles are similar: the shape of the profiles are the same, and there is only some difference in the production figures for all ages. The reason for this general difference in household production age profiles is probably the inter-household unpaid labour, which is included in the HETUS calculations. Because different methods are used for distributing childcare, the estimations of consumption patterns are somewhat different.
The flatter childcare consumption age profile at early ages in the case of the calculations by Solaz and Stancanelli (2012) and the steeper age profile in the HETUS estimations are the result of two factors: using different equivalence scales for allocating childcare in a household and using different smoothing techniques. The HETUS estimations apply a higher weight for smaller children, and the value of consumption for infants (age 0) is not smoothed. Inter-household childcare and transporting a child are allocated in the HETUS estimations among children and not in the estimations by Solaz and Stancanelli (2012). Apart from these differences, age profiles for people older than 3 have the same shape using the different sources and methods.
Table A-4: ISCO-88 categories used for the different home production activities
HETUS category
of home production activities
ISCO-88
occupational code Label of ISCO-88 code
Food preparation 51 Personal and protective services workers Dish washing 91 Sales and services elementary occupations Cleaning dwelling 91 Sales and services elementary occupations Other household upkeep 91 Sales and services elementary occupations Laundry 91 Sales and services elementary occupations Ironing 91 Sales and services elementary occupations
Handicraft 73 Precision, handicraft, craft printing and related trades workers Gardening 92 Agricultural, fishery and related labourers
Tending domestic animals 92 Agricultural, fishery and related labourers Caring for pets 92 Agricultural, fishery and related labourers Walking the dog 92 Agricultural, fishery and related labourers
Construction and repairs 93 Labourers in mining, construction, manufacturing and transport Shopping and services 91 Sales and services elementary occupations
Physical care, supervision of child 51 Personal and protective services workers Teaching, reading, talking with child 33 Teaching associate professionals Other domestic work 51 Personal and protective services workers Organisational work 41 Office clerks
Travel related to shopping 83 Drivers and mobile plant operators Transporting a child 83 Drivers and mobile plant operators Other domestic travel 83 Drivers and mobile plant operators Informal help to other households 51 Personal and protective services workers
Notes: Detailed explanations of the ISCO-88 codes may be found on the website of the International Labour Organisation: