VOLUME 38, ARTICLE 4, PAGES 109,126
PUBLISHED 9 JANUARY 2018
http://www.demographic-research.org/Volumes/Vol38/4/ DOI: 10.4054/DemRes.2018.38.4
Descriptive Finding
The digital divide and body size disparity among
Chinese adults
Chih-Chien Huang
Scott T. Yabiku
© 2018 Chih-Chien Huang & Scott T. Yabiku.
This open-access work is published under the terms of the Creative Commons Attribution 3.0 Germany (CC BY 3.0 DE), which permits use, reproduction, and distribution in any medium, provided the original author(s) and source are given credit.
1 Introduction 110
2 Data and methods 110
2.1 Study population 110
2.2 Measures 111
2.3 Statistical analyses 112
3 Descriptive statistics 113
3.1 Women 113
3.2 Men 113
3.3 Differences in ICT screen-viewing activities 113
4 Results of FE regressions 117
4.1 Women 117
4.2 Men 120
5 Discussion 120
The digital divide and body size disparity among Chinese adults
Chih-Chien Huang1 Scott T. Yabiku2
Abstract
BACKGROUND
The rapid development of information and communication technology (ICT) in China has increased people’s sedentary behavior and raised a number of related issues. ICT screen-viewing activities are increasingly considered to contribute to obesity, and sociodemographic characteristics such as gender, income, age, education, and geographical location seem to magnify the digital divide.
OBJECTIVE
This study first examines dissimilar stages of ICT transition, and then establishes how ICT screen-viewing activities relate to the Chinese obesity epidemic. Finally, this study assesses whether unequal access to digital resources and technology by geographic location and gender reinforces existing obesity disparities in China.
METHODS
This study uses longitudinal data drawn from 10,616 households and 17,377 person-years of those aged 18–55 who participated in the 2006, 2009, and 2011 China Health and Nutrition Survey (CHNS). Fixed effect linear regression models capture the link between ICT screen-viewing activities and body mass index (BMI).
RESULTS
The results show that while between 91.37% and 96.70% of individuals had access to televisions during 2006–2011, there is a significant disparity in terms of Internet activity by gender and geographical location. The results show that Internet use could
decrease a rural women’s BMI by .87 kg/m2, while playing computer games could
increase a rural man’s BMI by .42 kg/m2.
CONTRIBUTION
This study highlights that unequal access to digital resources and technology might reinforce existing obesity disparities in China.
1 Corresponding author. Department of Sociology and Social Work, Saint Anselm College, USA. Email:[email protected].
1. Introduction
The invention of modern information and communications technologies (ICT), such as cellular phones, the Internet, computers, and televisions (TVs), have brought about a radical change in the way we perceive, organize, and communicate information. China has made considerable advances in socioeconomic development in recent decades, while facing the issues and challenges of rapid ICT development. For example, age, education, and geographical location seem to magnify inequality in access to ICT, a phenomenon known as the digital divide (Fong 2009; Harwit 2004; Zhu and Wang 2001, 2005). In addition, the rapid expansion and use of ICT has shifted Chinese lives to a more sedentary routine, and screen-viewing activities using ICT are increasingly recognized as an important factor in the development of obesity (Eisenmann, Bartee, and Wang 2002; Foster, Gore, and West 2006; Grøntved and Hu 2011; Jakes et al. 2003; Robinson and Killen 1995; Thorp et al. 2011; Vandelanotte et al. 2009; Vioque, Torres, and Quiles 2000). Obesity is associated with many medical complications, including heart disease, type 2 diabetes, and bone and joint disease, and is rapidly becoming the primary cause of preventable death in China (Bray 2004; Wang et al. 2007).
China’s experience provides us with an opportunity to examine the different stages of ICT transitions and investigate how these transitions relate to Chinese obesity epidemics and disparities. The aim of this descriptive paper is first to examine dissimilar stages of ICT transition, and then establish how ICT screen-viewing activities relate to the Chinese obesity epidemic. Finally, this study tests whether unequal access to digital resources by geographic location and gender reinforces existing obesity disparities in China.
2. Data and methods
2.1 Study population
Chongqing (Zhang et al. 2014). While the CHNS is not a nationally representative survey, the key physical composition and dietary data trends in the CHNS are similar to past nationally representative surveys (Ge et al. 1994; Wang et al. 2007).
This study omits the 1989–2004 surveys because they lack information regarding the individuals’ ICT activities. This study therefore includes household members aged 18–55 who underwent detailed physical examinations that included obtaining their weight and height, and who participated in the CNHS survey waves for 2006, 2009, and 2011 (18,912 person-years from 11,199 households). Among the 18,912 person-years, those who were disabled, pregnant, or breastfeeding during any given survey were omitted. The final subsample therefore included 8,187 male person-years and 9,190 female person-years from 10,616 households.
2.2 Measures
Dependent variable.Body mass index (BMI) is a measure of body fat based on height
and weight, ( )
( ), in its continuous form that applies to adult men and women.
This study uses the WHO Asia-specific cut-off point when referring to obese individuals (BMI ≥ 25) in the analysis (World Health Organization Expert Consultation 2004).
TV and Internet usage pattern. At each survey wave during 2006–2011 the CHNS collected information regarding each individual’s participation in (1) TV viewing, (2) watching movies and videos online, (3) surfing the Internet, (4) participating in chat rooms, and (5) playing computer games. These five variables were coded as dichotomous variables in the regression models.
SES indicators: Educational attainment and household gross income.In this study, educational attainment was recoded into three categories. Household gross income was estimated by summing nine potential sources of income in each household. The CHNS project team imputed the missing data when any component was incomplete. Details of the imputation are described in the CHNS (2013a). For interpretability, household gross income was logged in the regression models.
Physical activity, daily food energy consumption, and demographic background.
occupational activities, transportation activities, and home activities collected by the CHNS.
Other covariates that we have controlled for in our statistical models include (a) current age in each survey year, (b) marital status, (c) currently smoking, and (d) currently drinking.
2.3 Statistical analyses
This study used fixed effect (FE) linear regression models to examine whether changes in ICT activities are associated with changes in BMI during the period 2006–2011. The FE linear regression models serve to difference out any time-invariant factors among unobserved variables (Allison 2009). In other words, ordinary least squares regressions that suffer from omitted variable bias due to unmeasured factors are likely to correlate with both the outcome and independent variables, whereas FE models are intended to examine the changes in an individual by controlling for potential unobserved heterogeneity bias. The final FE models with time-invariant covariates in this study are written as
∆ = ∆ + ∑ ( – )( − ) + ∆ .
We used the FE to evaluate the BMI variation value of individualiin householdj
at timet between 2006 and 2011 by gender and geographic location.∆ is an intercept
variation, is vector of coefficients, and represents time-varying covariates,
including one of five independent variables: TV viewing, watching movies and videos online, surfing the Internet, participating in chat rooms, and playing computer games. Other covariates that have been controlled for in this study are age, marital status, education, physical activities, daily food energy consumption, current smoking and drinking status, and log household gross income at the household level. The error
terms represents the idiosyncratic errors.
the unobserved, time-invariant characteristics of the establishments to play a separate role in the BMI variation. Finally, all longitudinal linear analyses were estimated using Stata 13.1.
3. Descriptive statistics
Tables 1 and 2 show the descriptive statistics for the variables in this study, divided by gender and geographical location.
3.1 Women
Rural women were not only heavier but also had a higher rate of increasing obesity prevalence over the period 2006–2011. Specifically, from 2006 to 2011 the average
BMI increased from 22.93 to 23.38 kg/m2 for urban women and from 23.17 to 23.71
kg/m2 for rural women. The obesity rate (BMI ≥ 25) increased substantially from
22.03% to 26.49% for women living in urban areas and from 26.72% to 32.09% for women living in rural areas.
3.2 Men
The data for men showed that the average BMI increased from 23.73 to 24.55 kg/m2 for
urban residents and from 23.11 to 23.94 kg/m2 for rural residents during the period
2006–2011. The male obesity rate also increased considerably, from 33.76% to 39.42% in urban areas and from 25.34% to 34.14% in rural areas.
3.3 Differences in ICT screen-viewing activities
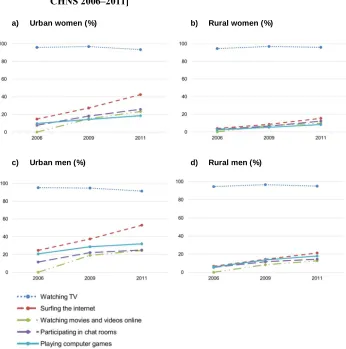
Figure 1: ICT screen-viewing activities by gender and geographical location, CHNS 2006‒2011]
a) Urban women (%) b) Rural women (%)
c) Urban men (%) d) Rural men (%)
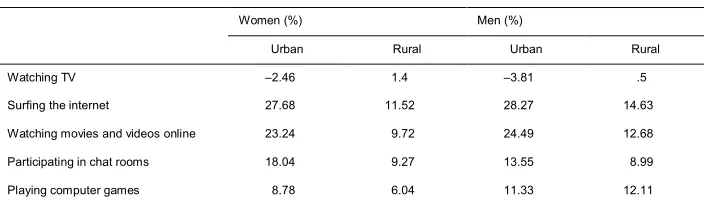
Table 3: Change in ICT screen-viewing activities by gender and geographical location (CHNS, 2006–2011)
Women (%) Men (%)
Urban Rural Urban Rural
Watching TV ‒2.46 1.4 ‒3.81 .5
Surfing the internet 27.68 11.52 28.27 14.63 Watching movies and videos online 23.24 9.72 24.49 12.68 Participating in chat rooms 18.04 9.27 13.55 8.99 Playing computer games 8.78 6.04 11.33 12.11
4. Results of FE regressions
4.1 Women
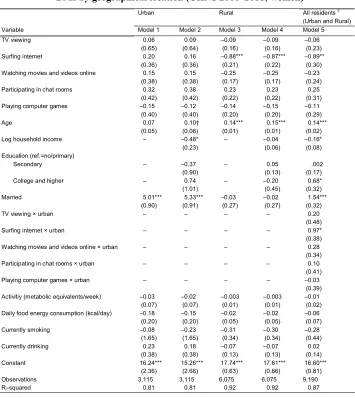
In Table 4, Model 1 indicates no significant effects of participation in ICT screen-viewing activities on BMI for urban women, and Model 2 shows that after controlling for the differential of SES among urban women this pattern remained. However, Model 3 shows that the BMI of rural women who actively surfed the Internet decreased
significantly by .88 kg/m2 during the period 2006–2011, and Model 4 indicates that this
pattern remained after controlling for SES indicators. The models were merged to compare the impact of ICT screen-viewing activities on BMI by geographic area; however, a significant body weight disparity between rural and urban women was only found for Internet surfing (Model 5).
Numerous studies have demonstrated that increased BMI is significantly associated with the aging process (Gordon-Larsen et al. 2004; Wang and Beydoun 2007); our study also finds age to be an important factor in the increase of BMI. Table 4
shows that while a rural woman’s BMI increased by .15 kg/m2 each year on average
between 2006 and 2011, her BMI could have decreased by .88 kg/m2 if she had surfed
the Internet. In other words, a rural woman with an average height of 154.50 cm could gain 1.14 kg (2.51 pounds) of total body weight within a five-year period (2006–2011); however, Internet surfing could buffer her weight by 2.07 kg (4.56 pounds). Further, a significant in difference BMI was seen between urban and rural women (Model 5). As Model 5 in Table 4 shows, on average, urban women have BMIs that are approximately
Table 4: Fixed-effects linear regression for ICT activities predicting mean BMI by geographical location (CHNS 2006‒2011; women)
Urban Rural All residents3
(Urban and Rural) Variable Model 1 Model 2 Model 3 Model 4 Model 5 TV viewing 0.06 0.09 ‒0.09 ‒0.09 ‒0.06
(0.65) (0.64) (0.16) (0.16) (0.23) Surfing internet 0.20 0.16 ‒0.88*** ‒0.87*** ‒0.89**
(0.36) (0.36) (0.21) (0.22) (0.30) Watching movies and videos online 0.15 0.15 ‒0.25 ‒0.25 ‒0.23
(0.38) (0.38) (0.17) (0.17) (0.24) Participating in chat rooms 0.32 0.38 0.23 0.23 0.25
(0.42) (0.42) (0.22) (0.22) (0.31) Playing computer games ‒0.15 ‒0.12 ‒0.14 ‒0.15 ‒0.11
(0.40) (0.40) (0.20) (0.20) (0.29) Age 0.07 0.10† 0.14*** 0.15*** 0.14***
(0.05) (0.06) (0.01) (0.01) (0.02) Log household income ‒ ‒0.48* ‒ ‒0.04 ‒0.16* (0.23) (0.06) (0.08) Education (ref.=no/primary)
Secondary ‒ ‒0.37 ‒ 0.05 .002 (0.90) (0.13) (0.17) College and higher ‒ 0.74 ‒ ‒0.20 0.68* (1.01) (0.45) (0.32) Married 5.01*** 5.33*** ‒0.03 ‒0.02 1.54***
(0.90) (0.91) (0.27) (0.27) (0.32) TV viewing × urban ‒ ‒ ‒ ‒ 0.20
(0.48) Surfing internet × urban ‒ ‒ ‒ ‒ 0.97* (0.38) Watching movies and videos online × urban ‒ ‒ ‒ ‒ 0.28
(0.34) Participating in chat rooms × urban ‒ ‒ ‒ ‒ 0.10
(0.41) Playing computer games × urban ‒ ‒ ‒ ‒ ‒0.03
(0.39) Activitiy (metabolic equivalents/week) ‒0.03 ‒0.02 ‒0.003 ‒0.003 ‒0.01
(0.07) (0.07) (0.01) (0.01) (0.02) Daily food energy consumption (kcal/day) ‒0.18 ‒0.15 ‒0.02 ‒0.02 ‒0.06
(0.20) (0.20) (0.05) (0.05) (0.07) Currently smoking ‒0.08 ‒0.23 ‒0.31 ‒0.30 ‒0.28
(1.65) (1.65) (0.34) (0.34) (0.44) Currently drinking 0.23 0.18 ‒0.07 ‒0.07 0.02
(0.38) (0.38) (0.13) (0.13) (0.14) Constant 16.24*** 15.26*** 17.74*** 17.61*** 16.60***
(2.36) (2.66) (0.63) (0.66) (0.81) Observations 3,115 3,115 6,075 6,075 9,190 R‒squared 0.81 0.81 0.92 0.92 0.87
Standard errors in parentheses *** p<.001, ** p<.01, * p<.05, †p<.10.
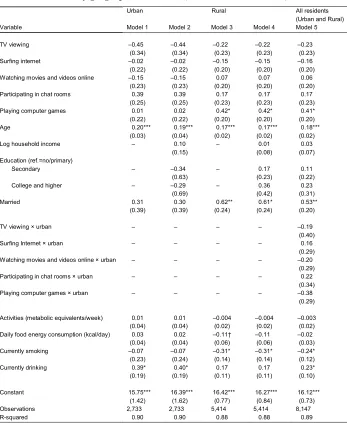
Table 5: Fixed-effects linear regression for ICT activities predicting mean BMI, by geographical location (CHNS 2006-2011; men)
Urban Rural All residents (Urban and Rural) Variable Model 1 Model 2 Model 3 Model 4 Model 5
TV viewing ‒0.45 ‒0.44 ‒0.22 ‒0.22 ‒0.23 (0.34) (0.34) (0.23) (0.23) (0.23) Surfing internet ‒0.02 ‒0.02 ‒0.15 ‒0.15 ‒0.16
(0.22) (0.22) (0.20) (0.20) (0.20) Watching movies and videos online ‒0.15 ‒0.15 0.07 0.07 0.06
(0.23) (0.23) (0.20) (0.20) (0.20) Participating in chat rooms 0.39 0.39 0.17 0.17 0.17
(0.25) (0.25) (0.23) (0.23) (0.23) Playing computer games 0.01 0.02 0.42* 0.42* 0.41* (0.22) (0.22) (0.20) (0.20) (0.20) Age 0.20*** 0.19*** 0.17*** 0.17*** 0.18***
(0.03) (0.04) (0.02) (0.02) (0.02) Log household income ‒ 0.10 ‒ 0.01 0.03
(0.15) (0.08) (0.07) Education (ref.=no/primary)
Secondary ‒ ‒0.34 ‒ 0.17 0.11 (0.63) (0.23) (0.22) College and higher ‒ ‒0.29 ‒ 0.36 0.23
(0.69) (0.42) (0.31) Married 0.31 0.30 0.62** 0.61* 0.53**
(0.39) (0.39) (0.24) (0.24) (0.20)
TV viewing × urban ‒ ‒ ‒ ‒ ‒0.19 (0.40) Surfing Internet × urban ‒ ‒ ‒ ‒ 0.16
(0.29) Watching movies and videos online × urban ‒ ‒ ‒ ‒ ‒0.20
(0.29) Participating in chat rooms × urban ‒ ‒ ‒ ‒ 0.22
(0.34) Playing computer games × urban ‒ ‒ ‒ ‒ ‒0.38
(0.29)
Activities (metabolic equivalents/week) 0.01 0.01 ‒0.004 ‒0.004 ‒0.003 (0.04) (0.04) (0.02) (0.02) (0.02) Daily food energy consumption (kcal/day) 0.03 0.02 ‒0.11† ‒0.11 ‒0.02
(0.04) (0.04) (0.06) (0.06) (0.03) Currently smoking ‒0.07 ‒0.07 ‒0.31* ‒0.31* ‒0.24* (0.23) (0.24) (0.14) (0.14) (0.12) Currently drinking 0.39* 0.40* 0.17 0.17 0.23* (0.19) (0.19) (0.11) (0.11) (0.10)
Constant 15.75*** 16.39*** 16.42*** 16.27*** 16.12*** (1.42) (1.62) (0.77) (0.84) (0.73) Observations 2,733 2,733 5,414 5,414 8,147 R-squared 0.90 0.90 0.88 0.88 0.89
4.2 Men
In Table 5, Model 1 shows that participation in an ICT screen-viewing activity was not related to BMI for men in urban areas, and this pattern remains after controlling for SES indicators (Model 2). Model 3 shows that playing computer games was related to higher BMIs for rural men, and this pattern remains after controlling for SES indicators (Model 4). Model 5 merged urban and rural residents into the same model and tested the interaction between geographical location and ICT screen-viewing activities; however, no significant effect was found for the interactions between geographical location and ICT screen-viewing activities.
Our findings indicate that a rural man who played computer games during the
period 2006–2011 had significant BMI increases of .42 kg/m2 (Model 4). In other
words, in China, a rural man with an average height of 164.8 cm could gain 2.34 kg (5.16 pounds) in body weight during a five-year period (2006–2011); however, playing computer games could add an additional 1.15 kg (2.54 pounds) to his body weight.
As a final point, like the aging process, which has been shown to be an important factor associated with weight gain and increased BMI, the effect of surfing the Internet or playing online video games on changing BMI was significant in rural areas. However, in this study these effects were found to be insignificant in urban areas.
5. Discussion
Over the past three decades, as China experienced astonishing social and economic
progress
,
the population of obese adults has increased considerably (Jiang et al. 2015).the past two decades have the potential to increase BMI in the Chinese population. Our study provides a perspective on issues related to the digital divide in body weight disparity by geographic area and gender in China. The results show that online chatting, watching movies and videos online, and TV viewing were not linked to BMI, regardless of gender or geographic location.
References
Ainsworth, B.E., Haskell, W.L., Whitt, M.C., Irwin, M.L., Swartz, A.M., Strath, S.J., Leon, A.S. (2000). Compendium of physical activities: An update of activity
codes and MET intensities. Medicine and Science in Sports and Exercise 32(9;
suppl. 1): S498–S504.
Allison, P.D. (2009).Fixed effects regression models: Quantitative applications in the
social sciences 160. Los Angeles: Sage.doi:10.4135/9781412993869.
Bray, G.A. (2004). Medical consequences of obesity. The Journal of Clinical
Endocrinology and Metabolism 89(6): 2583–2589.doi:10.1210/jc.2004-0535. Brodie, M., Flournoy, R.E., Altman, D.E., Blendon, R.J., Benson, J.M., and
Rosenbaum, M.D. (2000). Health information, the internet, and the digital
divide.Health Affairs 19(6): 255–265.doi:10.1377/hlthaff.19.6.255.
China Health and Nutrition Survey (2013a). Household income variable construction.
Chapel Hill: Carolina Population Center.http://www.cpc.unc.edu/projects/china/
data/datasets/Household%20Income%20Variable%20Construction.pdf.
China Health and Nutrition Survey (2013b). Chinese food composition table. Chapel
Hill: Carolina Population Center. http://www.cpc.unc.edu/projects/china/data/
faq.html.
Eisenmann, J.C., Bartee, R.T., and Wang, M.Q. (2002). Physical activity, TV viewing,
and weight in US youth: 1999 Youth Risk Behavior Survey. Obesity Research
10(5): 379–385.doi:10.1038/oby.2002.52.
Fong, M.W. (2009). Digital divide between urban and rural regions in China. The
Electronic Journal of Information Systems in Developing Countries 36.
doi:10.1002/j.1681-4835.2009.tb00253.x.
Foster, J.A., Gore, S.A., and West, D.S. (2006). Altering TV viewing habits: An
unexplored strategy for adult obesity intervention?American Journal of Health
Behavior 30(1): 3–14.doi:10.5993/AJHB.30.1.1.
Ge, K., Weisell, R., Guo, X., Cheng, L., Ma, H., Zhai, F., and Popkin, B.M. (1994).
Body mass index of Chinese adults in the 1980s.Asia Pacific Journal of Clinical
Gordon-Larsen, P., Adair, L.S., Nelson, M.C., and Popkin, B.M. (2004). Five-year obesity incidence in the transition period between adolescence and adulthood:
The National Longitudinal Study of Adolescent Health. The American Journal
of Clinical Nutrition 80(3): 569–575.
Grøntved, A. and Hu, F.B. (2011). Television viewing and risk of type 2 diabetes,
cardiovascular disease, and all-cause mortality: A meta-analysis. Journal of the
American Medical Association 305(23): 2448–2455. doi:10.1001/jama.2011. 812.
Harwit, E. (2004). Spreading telecommunications to developing areas in China:
Telephones, the internet and the digital divide.The China Quarterly 180: 1010–
1030.doi:10.1017/S0305741004000724.
Huang, C.-C., Yabiku, S.T., and Kronenfeld, J.J. (2015). The effects of household
technology on body mass index among Chinese adults.Population Research and
Policy Review 34(6): 877–899.doi:10.1007/s11113-015-9371-z.
Jakes, R.W., Day, N.E., Khaw, K.T., Luben, R., Oakes, S., Welch, A., Bingham, S., and Wareham, N.J. (2003). Television viewing and low participation in vigorous recreation are independently associated with obesity and markers of
cardiovascular disease risk: EPIC-Norfolk population-based study. European
Journal of Clinical Nutrition57(9): 1089–1096.doi:10.1038/sj.ejcn.1601648. Jiang, Y., Xu, Y., Bi, Y., Wang, L., Zhang, M., Zhou, M., Li, Y., Xu, M., Lu, J., Wang,
T., Dai, M., Thang, D., Wang, W., Ning, G., Wang, L., and Zhao, W. (2015). Prevalence and trends in overweight and obesity among Chinese adults in 2004–
2010: Data from three nationwide surveys in China. The Lancet 386: S77.
doi:10.1016/S0140-6736(15)00658-3.
Murray, E., Lo, B., Pollack, L., Donelan, K., Catania, J., White, M., Zapert, K., and Turner, R. (2003). The impact of health information on the internet on the
physician-patient relationship: Patient perceptions. Archives of Internal
Medicine 163(14): 1727–1734.doi:10.1001/archinte.163.14.1727.
Norris, P. (2001). Digital divide: Civic engagement, information poverty, and the
internet worldwide. New York: Cambridge University Press. doi:10.1017/ CBO9781139164887.
Popkin, B.M., Du, S., Zhai, F., and Zhang, B. (2010). Cohort profile: The China Health and Nutrition Survey ‒ monitoring and understanding socio-economic and health
change in China, 1989–2011. International Journal of Epidemiology 39(6):
Robinson, T.N. and Killen, J.D. (1995). Ethnic and gender differences in the relationships between television viewing and obesity, physical activity, and
dietary fat intake.Journal of Health Education 26(suppl. 2): S91–S98.
Thorp, A.A., Owen, N., Neuhaus, M., and Dunstan, D.W. (2011). Sedentary behaviors and subsequent health outcomes in adults: A systematic review of longitudinal
studies, 1996–2011. American Journal of Preventive Medicine 41(2): 207–215.
doi:10.1016/j.amepre.2011.05.004.
Vandelanotte, C., Sugiyama, T., Gardiner, P., and Owen, N. (2009). Associations of leisure-time internet and computer use with overweight and obesity, physical
activity and sedentary behaviors: Cross-sectional study. Journal of Medical
Internet Research 11(3): e28.doi:10.2196/jmir.1084.
Vioque, J., Torres, A., and Quiles, J. (2000). Time spent watching television, sleep
duration and obesity in adults living in Valencia, Spain.International Journal of
Obesity 24(12): 1683–1688.doi:10.1038/sj.ijo.0801434.
Wang, Y. and Beydoun, M.A. (2007). The obesity epidemic in the United States: Gender, age, socioeconomic, racial/ethnic, and geographic characteristics: A
systematic review and meta-regression analysis. Epidemiologic Reviews 29(1):
6–28.doi:10.1093/epirev/mxm007.
Wang, H., Du, S., Zhai, F., and Popkin, B.M. (2007). Trends in the distribution of body
mass index among Chinese adults, aged 20–45 years (1989–2000).International
Journal of Obesity 31(2): 272–278.doi:10.1038/sj.ijo.0803416.
Wang, Y., Mi, J., Shan, X.Y., Wang, Q.J., and Ge, K.Y. (2007). Is China facing an obesity epidemic and the consequences? The trends in obesity and chronic
disease in China. International Journal of Obesity 31(1): 177–188.doi:10.1038/
sj.ijo.0803354.
World Health Organization Expert Consultation (2004). Appropriate body-mass index for Asian populations and its implications for policy and intervention strategies.
The Lancet363: 157‒163.doi:10.1016/S0140-6736(03)15268-3.
Zhang, B., Zhai, F.Y., Du, S.F., and Popkin, B.M. (2014). The China health and
nutrition survey, 1989–2011. Obesity Reviews 15(S1): 2–7. doi:10.1111/obr.
12119.
Zhu, J. and Wang, E. (2001).Operational definition and preliminary test of the Digital
Zhu, J.J. and Wang, E. (2005). Diffusion, use, and effect of the internet in China.