M E T H O D O L O G Y
Open Access
Fast automated yeast cell counting algorithm
using bright-field and fluorescence microscopic
images
Dongpyo Hong
1,2†, Gwanghee Lee
2†, Neon Cheol Jung
2*and Moongu Jeon
1*Abstract
Background:The faithful determination of the concentration and viability of yeast cells is important for biological research as well as industry. To this end, it is important to develop an automated cell counting algorithm that can provide not only fast but also accurate and precise measurement of yeast cells.
Results:With the proposed method, we measured the precision of yeast cell measurements by using 0%, 25%, 50%, 75% and 100% viability samples. As a result, the actual viability measured with the proposed yeast cell counting algorithm is significantly correlated to the theoretical viability (R2= 0.9991). Furthermore, we evaluated the performance of our algorithm in various computing platforms. The results showed that the proposed algorithm could be feasible to use with low-end computing platforms without loss of its performance.
Conclusions: Our yeast cell counting algorithm can rapidly provide the total number and the viability of yeast cells with exceptional accuracy and precision. Therefore, we believe that our method can become beneficial for a wide variety of academic field and industries such as biotechnology, pharmaceutical and alcohol production.
Keywords: Fast automated counting, Quantitative measurement, Yeast counting, Dual fluorescence
Background
Yeast is an invaluable organism in biological research and industry. It is the simplest unicellular eukaryote. Its small genome size and unicellularity make yeast one of the most central model systems in cell biology and gen-etics, especially when studying cell cycle regulation and signal transduction. Yeast converts carbohydrates to two products, carbon dioxide and alcohol [1]. The former has been utilized for baking and the latter for brewing alcoholic beverages for thousands of years. Recently, the alcohol producing capability of yeast has been applied to bioethanol production using corn and sugar cane [2].
The current method of counting the number of yeast cells is the ASBC (American Society of Brewing Chemists)
method [3]. In this protocol, yeast cells are stained with methylene blue to indicate whether they are viable. The methylene blue is unable to penetrate viable cells leaving them unstained. However dead cells are unable to keep the methylene blue from penetrating the cell membrane, staining the cells blue. Thus, dead yeasts are stained in blue while live yeasts are not. Because of the small size, yeast cells need to be observed in high magnification (e.g., 40× or higher objective lens). The magnification is inversely proportional to FOV (Field Of View). Researchers have to count both live and dead yeasts in the small square of the hemocytometer, move the micro-scope stage to cover a neighboring square and count live and dead yeasts in the next square. Counting continues until a total 0.1μl counting volume is reached. The cen-tral big tile of the hemocytometer corresponds to 25 small squares, and it is a tedious and error-prone process [4]. The statistical significance of the ASBC method is low (25% error is typical) due to human er-rors, human interpretation and low counting volume * Correspondence:[email protected];[email protected]
†Equal contributors
2Logos Biosystems Inc, Pyungchon-dong, Kyunggi 431-755, Korea 1Applied Computing Lab., GIST, Oryong-dong, Gwangju 500-712, Korea
(0.1 μl). Moreover, in case of messy cultures (especially occurring in beer and wine brewing and bioethanol production), manual counting is even more challen-ging. Researchers need to distinguish yeast cells and non-cellular debris (hop in the beer brewing, grape in
the wine brewing and corn mash in the bioethanol production).
In order to overcome the difficulties, many automated cell-counting techniques have been proposed by utilizing digital image processing techniques with microscopic
Figure 1Working principle of yeast counting by using FDA. (A)Chemical formula of FDA.(B)Chemical formula of Fluorescein.(C)Chemical reaction in a yeast cell.
images [5-7]. In spite of such developments and their importance, there have been little research efforts on yeast cell counting [8,9]. In this study, we propose a fast automated yeast cell counting algorithm using bright field and fluorescence microscopic images. In addition, we elaborate our investigations on the characteristics of yeast cells for counting them accurately. Finally, we val-idate our proposed algorithm by evaluating its accuracy, precision, and speed. We describe our proposed algo-rithm and the results in the following sections.
Results and discussion Assay principle for yeast cells
AO (Acridine orange) and PI (Propidium iodide) are nu-cleic acid-binding fluorescent dyes. A cell membrane permeable dye, AO can stain nucleic acids of both live and dead cells so that the entire population can be visu-alized. A cell membrane impermeable dye, PI can only enter and visualize dead cells, of which membrane integ-rity is compromised. Combining AO/PI dual staining and the automated cell counting system enables the
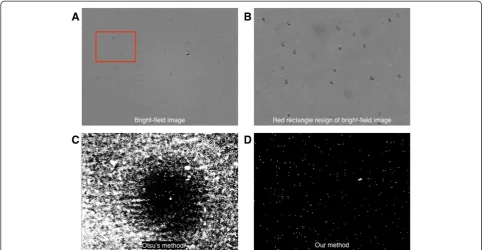
Figure 3Bright-field and binary images. (A)The acquired bright-field images.(B)A regional image (640 × 480) of the original(A)(2592 × 1944). (C)Binary image using Ostu’s method.(D)Binary image using our method.
efficient distinction between live and dead cells, as well as the accurate determination of their cell numbers from various origins. However, in case of yeast, the story is a little different. The fluorescence intensities of AO and PI are proportional to the genome size of the cells. Because a yeast cell has 280-times smaller genome than a human cell, the AO fluorescence from the yeast cell is 280-times weaker and the counting based on the weak signal is neither accurate nor precise. To count various cells containing the small amount of genome, an alternative cell staining dye is required.
FDA (Fluorescein diacetate) is a fluorogenic cell via-bility probe. Due to its membrane-permeable nature, FDA can freely move in and out of the plasma mem-brane of diverse organisms from bacteria to mammalian cells. The internalized FDA is cleaved by intracellular esterases and converted to fluorescein. Fluorescein has an excitation maximum at 494 nm and an emission maximum at 521 nm, so it is compatible with the filter set for the green channel of conventional microscopes. The converted fluorescein carries one negative charge because of carboxylic acid located at the carbon num-bered 3, so it cannot cross the plasma membrane any-more. Its retention capability requires an intact plasma membrane. Therefore, FDA staining measures the meta-bolic activity of esterase enzymes and plasma membrane integrity. The overall working principle is summarized in Figure 1.
Proposed algorithm
Our proposed yeast cell counting algorithm conceptually consists of two main components. The first component is finding objects of interest as yeast candidates. The sec-ond component is determining the yeast candidates as yeast cells based on various conditions such as size, in-tensity level, roundness, and so on. Figure 2 shows the overall procedure of the yeast cell counting algorithm.
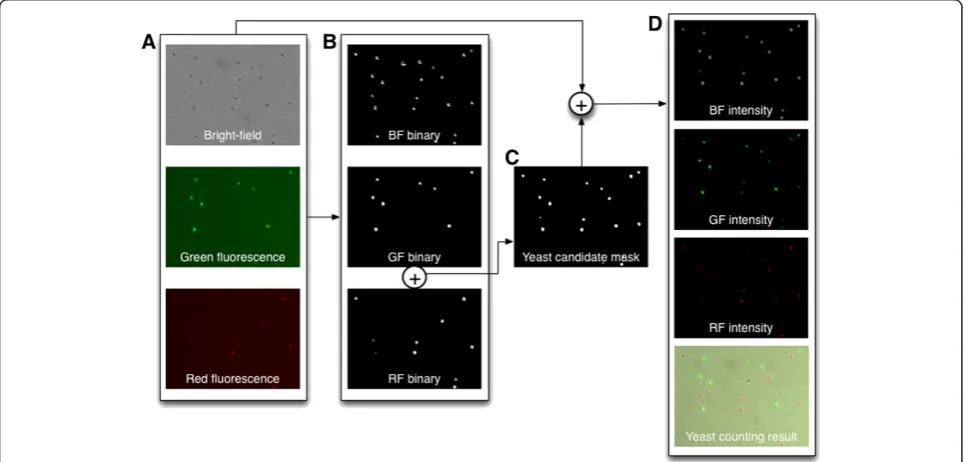
As shown in Figure 2A (from Figure 3A and 3B), the ac-quired bright-field image is converted to a gray scale image. In addition, green and red fluorescence images are separated by green and red channels, respectively. This channel separation of the acquired color images can re-duce memory size as well as counting time because the system deals with 8-bit images instead of 24-bit images. Noise removal and threshold operations are performed on the separated images in order to handle them more effi-ciently. The binary images also enable a reduction of computing time because the system uses 2-bit rather than 8-bit images. With the binary images (Figure 2B), a yeast candidate mask image can be constructed (Figure 2C) by combining the GF (green fluorescence) and RF (red fluorescence) binary images. By combining the yeast candidate mask image and the acquired original color
images (Figure 2D), live and dead yeast cells by compar-ing the GF intensity and RF intensity values, as well as debris can be discriminated by comparing the gray in-tensity values in samples. In addition, yeast cell size can be determined by utilizing bright-field image, which en-ables accurate size calculation. This is in sharp contrast to other methods using only fluorescence microscopic images to measure cell size. It is well known that the cell sizes soly measured by fluorescence images are severly affected by the exposure level of a camera and brightness level of a light source [10,11].
To achieve a best binary image, Otsu’s method has been widely adopted [5,7,12]. In the case of yeast cells, however, we found that Otsu’s method [13] and other similar methods [14] are not applicable if the number of yeast cells is too small or intensities of yeast cells are hardly distinguishable from the background micro-scopic images as shown in Figure 3C. When we observe the histograms of intensities in the image of yeast sam-ples, they are easily modeled as a Gaussian distribution.
From this observation, the threshold value is mapped by function of mean and standard deviation of the image as follows.
μ ¼ 1 MN
X M−1
χ¼0
XN−1
y¼0 Iðχ;yÞ
σ ¼
ffiffiffiffiffiffiffiffiffiffiffiffiffiffiffiffiffiffiffiffiffiffiffiffiffiffiffiffiffiffiffiffiffiffiffiffiffiffiffiffiffiffiffiffiffiffiffiffi
1 MN
X M−1
χ¼0
XN−1
y¼0
Iðχ;yÞ−μ
ð Þ2
v u u t
T ¼μ−α⋅σ
whereI(x,y)is an intensity level of xandy positions in the given image withMwidth andNheight;μandσare the mean and standard deviation of the given image, re-spectively. To estimate the threshold value, T, of the given image, we use the confidential interval constantα. By usingT, we can make binary images like Figure 2B and 3D. From our observations in various yeast cell samples, it is sufficient to use the value ofαas 3.
Viability comparison
To determine the FDA staining principle which can be applied to yeast counting, we applied FDA/PI mixture to overnight cultured yeast cells.
As shown in Figure 4A, FDA can successfully stain all yeast cells when a yeast sample of 100% viability was tested. All yeast cells visible in the bright field image were counted and marked with the green circle. To see if FDA/PI staining can distinguish live and dead yeast cells, we intentionally killed yeast cells by heating at 70°C
for 30 minutes (0% viability sample), and a 50% viability sample was prepared by mixing 100% and 0% viability samples at a ratio of 1:1. As seen in Figure 4B and 4C, FDA/PI staining successfully distinguishes live from dead yeasts even when they are mixed in a single vial. Like the 100% viability sample, all yeast cells were counted and la-beled with green or red circles according to their health status. We next measured the accuracy of yeast cell viabil-ity by using 0%, 25%, 50%, 75% and 100% viabilviabil-ity samples. As shown in Figure 4D, the actual viability measured with the proposed yeast cell counting algorithm is significantly correlated to the theoretical viability with the coefficient of correlation (R2= 0.9991). Taken together, the FDA/PI staining method combined with the proposed algorithm can accurately count live and dead yeast cells.
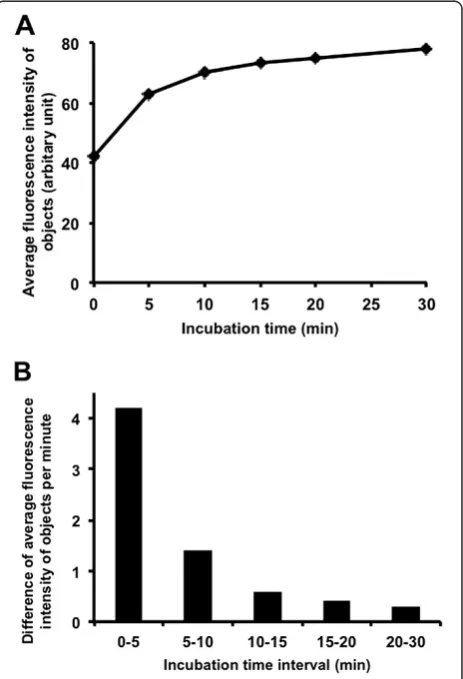
Unlike AO/PI staining, in which two nucleic acid binding dyes bind instantly to genomic DNA, FDA staining makes use of enzymatic reactions for generating fluorescence. Thus, it takes time to reach detectable fluorescence intensity. To measure the optimal time re-quired for fluorescein detection, FDA was added to 100% live yeast cells, and the average fluorescence intensity of objects (yeast cells) was measured at 0, 5, 10, 15, 20 and 30 minutes after the addition of the dye.
As shown in Figure 5A, at 0 or upon addition of the dye, the FDA fluorescence is not distinguishable from the background fluorescent intensity level (i.e., around 40 intensity level). Within the first 5 minutes, the yeast cells rapidly gained the fluorescence signal. The rate of the fluorescein accumulation dropped significantly dur-ing the next 5 minutes and reached a plateau at 10 mi-nutes after the reaction (Figure 5B). For optimal yeast
counting, 10 minutes incubation time of yeast cells with FDA is ideal.
Next, we tested if the proposed algorithm can accur-ately count the total number and measure the viability even in the presence of non-cellular debris. A traditional Korean rice wine was chosen as the example of a messy culture, which can be readily accessible in local markets. Figure 6 shows that the algorithm can successfully dis-tinguish yeast cells from the non-cellular debris (or pos-sibly rice flour). It is also noteworthy that live yeasts were successfully distinguished from dead yeasts even in the messy culture.
Counting performance comparison
To determine the precision of the proposed algorithm, we counted the concentration of yeast cells with
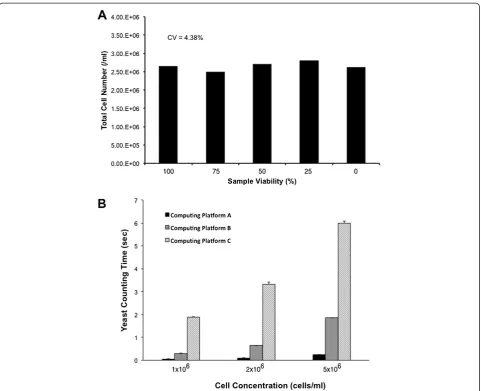
different viabilities from 0% to 100%. Figure 7A shows that the counting results are stable at different viabilities. The CV (coefficient of variation) of counted cells among the different viabilities is 4.38%, which is significantly lower than ASBC method.
To validate the speed of the proposed algorithm, we used different yeast cell concentration samples from 1 × 10⁶to 5 × 10⁶cells/ml (i.e., ranging from 437 to 2,360 cells in the sample images, respectively). Furthermore, we also
Figure 7Counting stability and performance. (A)Yeast cell viabilities are ranged from 100% to 0%. Average cell numbers are 1,140 cells/ml, and CV is 4.8% that is significantly lower than ABSC method.(B)Yeast cell concentrations are ranged from 1 × 10⁶cells/ml (437 cells in the
sample image) to 5 × 10⁶cells/ml (2,360 cells in the sample image). Average counting time is less than 2 seconds in a conventional PC and less than 6 seconds in an embedded system.
Table 1 Computing platforms for counting speed evaluation
A B C
CPU Intel 3.4GHz AMD 1.8GHz Cortex A8 800 MHz
deployed our algorithm into various computing platforms (Table 1) in order to validate feasibility of the proposed algorithm. In this condition, we counted the samples 10 times. Figure 7 shows the result of counting perfor-mances on different samples and different computing platforms.
As shown in Figure 7B, the proposed algorithm counts yeast cells in less than 2 seconds in conventional comput-ing platforms for most cases (e.g., 5 × 10⁶cells/ml≈2,360 cells in a 2529 × 1944 image size) except for computing platform C. At each trial, the standard deviation of count-ing time is less than 90 ms. From this experimental result, our algorithm is correlated to CPU clock speed and RAM size. However, it can be negligible if the CPU clock speed and RAM size are at least as powerful as computing plat-form A. Therefore, the proposed yeast counting algorithm can be applied to any computing platform without loss of its performance.
Conclusions
The proposed yeast cell counting algorithm can calculate the total number and measure the viability of yeast with exceptional accuracy and precision within less than 2 sec-onds in a conventional PC and 6 secsec-onds in an embedded system when combined with FDA/PI and yeast dilution buffer. Because our algorithm can count yeast cells in messy culture as well as in pure culture, this algorithm can benefit a wide variety of fields in academics, biotech-nology, pharmaceuticals and the alcohol industry.
Materials and methods Methods
Saccharomyces Cerevisiaewere cultured overnight in the YPD (Yeast Extract Peptone Dextrose) medium. Conflu-ent yeast were diluted at 1:100 and cultured for an add-itional three hours for mid-log phase cells. After that, cells were again diluted at 1:100 with yeast dilution buf-fer depending on the concentration of the yeast cells. By using a centrifuge, the supernatant was discarded and the pellet was suspended with the yeast dilution buffer (i.e., the mid-log phase yeast). In order to prepare 0% viability of yeast cells, we heated the yeast sample at 70°C for 30 minutes. Then, we incubated the yeast for 10 mi-nutes at room temperature. For viabilities above 0%, we added 1μl of FDA and 1μl of PI to the yeast sample, and incubated it for 10 minutes at room temperature. For the counting, we load 10μl of the stained yeast sample on the counting slide. Finally, we wait for about 1 minute or until all yeast cells are immobile, then we take images from Luna-FL™ (Logos Biosystems, Korea). To test if the yeast counting algorithm can successfully count the total num-ber of yeasts and calculate the viability in a messy culture, a bottle of traditional Korean rice wine was purchased from a local store. After thorough agitation to make
homogenous suspension, the rice wine was diluted at 1:100 yeast dilution buffer. Then, we added 1 μl of FDA and 1μl of PI to the 18μl of yeast sample. After the incu-bation at room temperature for 10 minutes, the yeast staining solution was loaded onto the counting slide of Luna-FL™ and the loaded yeast sample images were ac-quired from Luna-FL™.
Images
The samples used for the experiments are FDA/PI-dyed high-resolution images from Luna-FL™. The acquired each sample has 2529 × 1944 image resolution, and also each sample has bright-field, green and red fluorescence images as a set of the experimental data.
Image processing
The algorithm was implemented with C++ computer language as well as OpenCV (Open Source Computer Vision) library [15]. However, other languages such as Python or Java can be used to utilize OpenCV library. The following functions were used to implement the proposed algorithm. To separate a color image into green, red, and blue channels, split function was used (Figure 2A). A binary image was obtained by threshold function (Figure 2B). To make yeast candidates mask image, bitwise_and function was applied to GF binary image and RF binary image (Figure 2C). In addition, bit-wise_and function was used to make intensity images (Figure 2D). To make overlay image,mergefunction was used (Figure 2D). Furthermore, findContours function was used to find objects from binary images. Meanwhile, the proposed algorithm is also commercially available with the Luna-FL™ automated cell counter (Logos Bio-systems, Korea). The Luna-FL™ automated cell counter automatically processes all the steps shown in Figure 2 including microscopic image capture, image processing, and data display.
Abbreviations
ASBC:American society of brewing chemists; FOV: Field of view; AO: Acridine orange; PI: Propidium iodide; FDA: Fluorescein diacetate; GF: Green fluorescence; RF: Red fluorescence; DNA: Deoxyribonucleic acid;
CV: coefficient of variation; CPU: central processing unit; RAM: random-access memory; YPD: Yeast extract peptone dextrose; OpenCV: Open source computer vision.
Competing interests
The authors (excluding MJ) declare that they have a competing financial interest in Logos Biosystems, Inc.
Authors’contributions
Author details 1
Applied Computing Lab., GIST, Oryong-dong, Gwangju 500-712, Korea.
2Logos Biosystems Inc, Pyungchon-dong, Kyunggi 431-755, Korea.
Received: 4 October 2013 Accepted: 8 November 2013 Published: 11 November 2013
References
1. Novak J, Basarova G, Teixeira JA, Vicente AA:Monitoring of brewing yeast propagation under aerobic and anaerobic conditions employing flow cytometry.J Inst Brew2007,113:249–255.
2. Hu XH, Wang MH, Tan T, Li JR, Yang H, Leach L, Zhang RM, Luo ZW: Genetic dissection of ethanol tolerance in the budding yeast Saccharomyces Cerevisiae.Genetics2007,175:1479–1487.
3. Schisler DO:Comparison of revised yeast counting methods.Journal of American Society of Brewing Chemists1896,44:0081.
4. Szabo SE, Monroe SL, Fiorino S, Bitzan J, Loper K:Evaluation of an automated instrument for viability and concentration measurements of Cryopreserved Hematopoietic cells.Lab Hematol2004,10:109–111. 5. ChengEn L, Xiang B, Guangxi Z, Wenyu L:An efficient image
segmentation method with application to cell images. InProceedings of 9th International Conference on Signal Processing.Edited by Baozong YUAN, QiuqiL RUAN, Xiaofang TANG. Beijing; 2008:1067–1070.
6. Waters JC:Accuracy and precision in quantitative fluorescence microscopy.J Cell Biol2009,185:1135–1148.
7. Al-Khazraji BK, Medeiros PJ, Novielli NM, Jackson DN:An automated cell-counting algorithm for fluorescently-stained cells in migration assays.Biological Procedures Online2011,13:9.
8. Chan LL, Lyettefi EJ, Pirani A, Smith T, Qiu J, Lin B:Direct concentration and viability measurement of yeast in corn mash using a novel imaging cytometry method.J Ind Microbiol Biotechnol2011,38:1109–1115. 9. Chan LL, Kury A, Wilkinson A, Berkes C, Pirani A:Novel image cytometric
method for detection of physiological and metabolic changes in Saccharomyces cerevisiae.J Ind Microbiol Biotechnol2012,39:1615–1623. 10. Wang Q, Niemi J, Tan C-M, You L, West M:Image segmentation and dynamic
lineage analysis in single-cell fluorescence microscopy.Cytometry A2010, 77A:101–110.
11. Peterson EM, Harris JM:Quantitative detection of single molecules in fluorescence microscopy images.Anal Chem2010,82:189–196. 12. Ali R, Gooding M, Szilágyi T, Vojnovic B, Christlieb M, Brady M:Automatic
segmentation of adherent biological cell boundaries and nuclei from brightfield microscopy images.Mach Vis Appl2012,23:607–621. 13. OTSU N:A threshold selection method from gray-level histograms.
IEEE Trans Syst Man Cybern1979,SMC-9:62–66.
14. Sezgin M, Sankur B:Survey over image thresholding techniques and quantitative performance evaluation.Journal of Electronic Imaging2004, 13:146–165.
15. OpenCV.http://www.opencv.org.
doi:10.1186/1480-9222-15-13
Cite this article as:Honget al.:Fast automated yeast cell counting algorithm using bright-field and fluorescence microscopic images.
Biological Procedures Online201315:13.
Submit your next manuscript to BioMed Central and take full advantage of:
• Convenient online submission
• Thorough peer review
• No space constraints or color figure charges
• Immediate publication on acceptance
• Inclusion in PubMed, CAS, Scopus and Google Scholar
• Research which is freely available for redistribution