depreciation mesurement in cost method of valuation in lagos metropolis
Bello, I.K.
Department Of Estate Management,
MOSHOOD ABIOLA POLYTECHNIC, P.M.B. 22210, ABEOKUTA, NIGERIA Phone no. +2348033559708, E-mail: ismailbello@yahoo.com, ismailbellokola@gmail.com
ABSTRACT
Valuation is an important tool for decision making in property transaction and require that the values given by practitioners are reliable and consistent. Unfortunately, this does not occur often in the estimation of depreciation in cost valuation in Nigeria. The aim of this paper is to examine the challenges of measuring the depreciation in the cost method of valuation with a view to providing better information for the practitioners and allied professionals in the built environment. Questionnaire were structured and distributed on registered estate surveyors and valuers firms in Lagos Metropolis where the head offices of the majority of estate surveying and valuation practititioners are accommodated. Stratified sampling technique was adopted in selecting firms within the districts of the study area. 154 questionnaires were distributed but 131 were retrieved for the purpose of analysis. Relative Importance Index method of analysis was adopted with the use of student T-test to determine the relationship between the depreciation generated by S-curve and the method found to be in frequent usage. The paper discovered no significant relationship. The P value (< 0.5) indicated that the variance of methods (S-curve on one hand versus the methods used) were not equal. This showed that the use of depreciation in the cost methods of valuation has accuracy deficiencies. The paper therefore concluded that depreciation measurement in the study area is user friendly, but inaccurate, inconsistent and incapable of separating components. The professional board of Estate Surveyors and Valuation Registration Board of Nigeria (EVERBON) is further challenged to regulate the use of deprecation methods in use among majority of the practititioners in the interest of accuracy, and called for further research in this area in order to develop models that will capture all the indicators of good depreciation measurement.
Key words: Valuation Methods, Property values, practice, obsolescence, accuracy.
INTRODUCTION
In valuation standards across the world, depreciation is seen as a composite term consisting of three items: physical deterioration, functional obsolescence and economic obsolescence (RICS, 2005; NIESV, 2006; IVSC, 2007). Physical deterioration is depreciation that results from wear and tear over time, including the lack of maintenance. Functional obsolescence is caused by advances in technology that result in new assets capable of more efficient delivery of good and services, rendering previously existing assets fully or partially obsolete in terms of current cost equivalents. Economic obsolescence results from changed economic conditions which affect the supply and demand for goods and services produced by the asset or the cost of its operation.
Baum (1991), the Appraisal Institute (2001), the IVSC (2007) variously distinguish between incurable and curable depreciation. Incurable depreciation is the type of depreciation which no amount of capital investment can rectify, for example structural flexibility on building while curable depreciation refer to forms of depreciation for which capital investment can bring about mitigation of the degree of building obsolescence e.g the depreciation for finishes and services. All of these factors must be taken into consideration when arriving at replacement cost of new less depreciation.
74 others. There is however no current consensus within the valuation professionals as to which of the several approaches is to be used in estimating accrued depreciation so as to adequately address the key indices that are of concern to valuers viz; age, level of physical deterioration, functional and economic obsolescence. This study is conceived with the understanding that the development of consensus as to the best way to depreciate replacement cost new of subject properties within the cost approach to valuation is crucial to the development of accurate and consistently operated cost valuation models.
Theoretical framework : The unresolved controversy in cost valuation in the circumstances of the worldwide application of depreciation factors in the cost approach as employed by the valuation professional within the profession, there is a general consensus on the components of depreciation at least at the level of valuation standards. There is also a measure of consensus as to the models available for the measurement of depreciation. A group of such methods are very common and are widely used both in the valuation and accounting professions particularly the age-life methods such as the straight-line reducing balance and sinking fund methods (Gyamfi and Ayittey, 2006).
However the unresolved controversy has to do with the absence of consistency in the depreciation and use of the vast varieties of methods, formulas and types of models adopted by practitioners and researchers. Ogunba (2011) list seven different approaches to the measurement of depreciation available to valuers/appraisers: estimated percentage depreciation, age life models, time series analysis, cross-sectional data to determine average yearly depreciation rates, Hedonic regression equations the breakdown models, and the market extraction model. The first five models are common with UK and Commonwealth standard textbooks such as Johnson et. al. (2000) and Hoesli & MacGregor (2000) while the last two models are set forth in US standard textbooks, Appraisal Institute, (2001). This suggests that there is apparently no consensus between the UK and US standard texts and valuation teaching as to the appropriate models to use in the depreciation of replacement costs.
There is also no consensus as to practitioner choices among the variety of depreciation methods available. For example, in the US, Dotzour (1990) sees the chief perceived disadvantage of the cost approach among practitioners as the difficulty of accurately estimating accrued depreciation. In the UK, Plimmer & Sayce
(2006) note that inconsistency in the cost depreciation approach has resulted in concern amongst UK client public sector organizations which have found that their ability to budget for their core services has been compromised as a result. In Nigeria, Ogunba (2011) noted that there is an absence of institutionalized guidance as to which methods to adopt; valuers freely choose from the variety of available depreciation methods, with the result that the choice of depreciation models does not involve the most sustainable choices. The use of different depreciation models is responsible for variations in valuation estimates prepared by different valuers on the same property contemporaneously (Law, 2004). As a result of such confusions, Wikipedia (2009) suggests that the computation to include the cost approach in US appraisals has dissipated over the last 20 years. The agitations that exist in academic papers are a strong pointer to the significant importance in the choice of appropriate depreciation methods. For example, Hulten and Wyckoff (2003)as well as Follain and Malpezzi (2004) concluded that the straight-line method should be rejected and that a more accelerated depreciation pattern than the straight-line (which is convex to the origin) should be accepted for four types of properties (that is offices, retail stores, factories and warehouse). Jones et al (2004) suggested that the appropriate depreciation method for single-family housing should be concave to the origin, by allowing the depreciation rate to be small at first and more pronounced latter. Taubman and Rashe (1999) and Connaday and Sunderman (2006) in their works in respect of office buildings and single residential properties - that the pattern of depreciation that is supported by the empirical evidence is one that is concave to the origin and that the reverse sum of the years’ digits model most closely approximates the pattern indicated as appropriate by empirical results of their study.
75 the property sold have significant impacts on the observed rate of economic depreciation. Such information is vitally important to policymakers and other interested in accurate modeling of real estate markets.
In Nigeria, Ogunba (2009), observed that the cost approach is relatively simple in concept, but there is still confusion and subjectivity about the estimation of depreciation. Most Surveyors do not account for functional or economic obsolescence in their depreciation calculations. The estimated percentage approach which most surveyors especially in Nigeria adopt does not permit an explicit accounting for such functional or economic obsolescence. Most of the mathematical age life approaches (straight-line approach accelerated depreciation approaches and decelerated approaches) focus only on physical deterioration. Moreover, a necessary input for the age-life methods is the useful life of the building/plant/machinery. But how does one determine the useful life of different types of building? Does a building even have a definite life especially where the depreciation/obsolescence is curable, which implies that with adequate maintenance/refurbishment, the building could well last indefinitely? The above questions demonstrate that there is obviously much need for research into the depreciation aspect of cost approach as well as a need for international standardization of depreciation approach. The latest edition of IVSC (2007) does not yet provide much guidance on these questions.
Against this backdrop, there seems some challenges in the depreciation measurement literature especially in Nigeria, and hence reinforces the need for a thorough research on the subject matter if our valuation report is to be reliable, consistent and accurate. Consequently, this paper intends to fill this vacuum by drawing on the experimental approaches adopted by researchers on the subject (Baum 1997; Hoesli and Macgregor 2000; Johnson 2000; Plimmer and sayce 2006; Ogunba 2009; Ogunba 2011). Thus, the research questions motivating this study are:
What are the current models adopted for the measurement of depreciation
in Depreciated Replacement Cost Approach (DRC) for valuation in Lagos, Nigeria?
What are the patterns that depreciation follows in residential property types?
Methodology
Ideally, a study such as this should cover the whole parts of Nigeria. The increase in numbers of qualified Estate Surveyors and Valuers in the country has necessitated the needs for the establishment of estate firms across the country. However, Lagos metropolis was chosen because it accommodates most of the corporate head offices of most of the commercial establishments in the country. As a result of this, the study focuses on the head offices/branches of the estate surveyors and valuers firms as they afford veritable avenue for the property transactions data and opportunities to get various property types for the purpose of depreciation measurement models in DRC valuation.
76
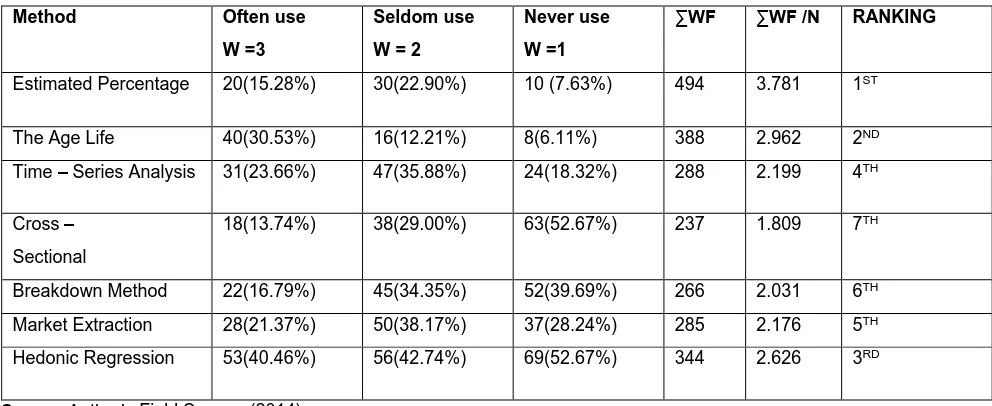
Table 1:Depreciation Models Used by Respondents
Method Often use W =3
Seldom use W = 2
Never use W =1
∑WF ∑WF /N RANKING
Estimated Percentage 20(15.28%) 30(22.90%) 10 (7.63%) 494 3.781 1ST
The Age Life 40(30.53%) 16(12.21%) 8(6.11%) 388 2.962 2ND Time – Series Analysis 31(23.66%) 47(35.88%) 24(18.32%) 288 2.199 4TH
Cross – Sectional
18(13.74%) 38(29.00%) 63(52.67%) 237 1.809 7TH
Breakdown Method 22(16.79%) 45(34.35%) 52(39.69%) 266 2.031 6TH Market Extraction 28(21.37%) 50(38.17%) 37(28.24%) 285 2.176 5TH Hedonic Regression 53(40.46%) 56(42.74%) 69(52.67%) 344 2.626 3RD
Source: Author’s Field Survey, (2014)
Table 1 above revealed that estimated percentage depreciation model has the highest score of 3.781, meaning that this model is almost always used. Age Life models ranked second with a Relative Importance Index score of 2.962, meaning that this group of models is often used. Cross-sectional models ranked
last with a Relative Importance Index score of 1.809, meaning that it is seldom used. This result tallies with the earlier findings of Ogunba (2011) which suggested that most of Estate Surveyors in Lagos employed the estimated percentage method for depreciation modeling, despite the fact that this model is quite subjective.
Table 2: Factors responsible for the Use of the Models
Source: Author’s Field Survey, (2014)
Method model is accurate model is easy use Model is the one other valuers use
Model is the one that taught
Estimated Percentage
49(37.40%) 10(7.63%) 2(1.53%) 70(53.44%)
The Age Life 42(32.06%) 7(5.34%) 3(2.29%) 79(60.31%)
Time–Series Analysis
25(19.08%) 3(2.29%) 10(7.63%) 61(46.56%)
Cross –
Sectional
10(7.63%) 30(22.90%) 8(6.11%) 83(63.33%)
Breakdown Method
11(8.39%) 25(19.08%) 15(11.45%) 80(68.70%)
Market Extraction
8(6.11%) 13(9.92%) 35(26.72%) 75(57.25%)
Hedonic Regression
77 Table 2 above explains the relative importance of the factors responsible for the usage of the models considered. The table shows that most important factor influencing the use of estimated percentage model (53.44%) is that the model was taught in the school. The other important factor considered for this model (37.40 %) is its perceived accuracy . The most important factor (60.31%) influencing the use of the Age life models is that it was taught in school. The other important factor (32.06%) is that the model is considered by some to be accurate in useage. 5.34% of the respondents agreed to ease of use of the model while 2.29% says the model is most favoured for use by valuers whereas the most important factor influencing the use of Time-series analysis is that model that was commonly taught in school (46.56%), 19.08% of the respondents affirms that the model is most accurate, 7.63% were of the opinion that other valuers prefer to their use, while 2.29% indicated that the model is simple due to an ease of use.
The most important factor influencing the cross sectional model of depreciation is that it is most accurate (7.63%), 22.90% says it is the model that is easy to use, 6.11% indicated that it is the model that other valuers use while 63.33% says it is the model
that was taught in school.68.70% indicated that breakdown model is the one that was taught in school, 11.45% say it the model that other valuers use, 19.08% opined that it is easy to use while 8.39% says it is most accurate.
For market extraction, the factors that valuers considered most important are respectively, 57.25% who say it is the as model that was taught in school, 26.72% say it is the model that other valuers use, 9.92% say the model that is easy to use and 6.11% indicated that the model that is most accurate.
Valuers ranked factors that influence their use of the hedonic regression model as follows; it was taught in school (54.20%), 22.90% consider it to be the model that other valuers use, 21.37% look at it as the model that is easy to use while 1.53% believe the factor of accuracy influence its usage
Next, respondents were asked to rank the models according to their user friendliness. The perceptions were ranked on a four – point Likert scale corresponding to very friendly (4), friendly (3) less friendly (2), and not friendly (1).Table 3 presents the respondents’ opinions.
Table 3: Perception of User Friendliness of Depreciation Models
Method Very friendly
W=4
Friendly W =3
Less Friendly W =2
Not Friendly W=1
∑WF ∑WF/N RANKING
Estimated Percentage
90(68.70%) 30(22.90%) 8(6.11%) 3(2.29%) 469 3.5802 1st
The Age Life 88(67.18%) 25(19.08%) 10(7.63%) 8(6.11%) 455 3.4732 2nd
Time – Series Analysis
25(19.08%) 38(29.00%) 45(3.35%) 23(17.55%) 327 2.4961 4th
Cross –
Sectional
15(11.45%) 45(34.35%) 40(30.53%) 31(23.66%) 306 2.3358 5th
Breakdown Method
30(22.90%) 38(29.00%) 40(30.53%) 23(17.55%) 337 2.5725 3rd
Market Extraction
10(7.63%) 15(11.45%) 50(38.16%) 56(42.75%) 241 1.8397 6th
Hedonic Regression
5(3.82%) 10(7.63%) 55(46.56%) 61(46.56%) 221 1.6870 7th
Source: Author’s Field Survey, (2014)
Table 3 shows that respondents believe that estimated percentage depreciation is the most user friendly model with an RII score of 3.5802, while hedonic
78
Pattern of Depreciation for Residential Property: The section addresses the objective number two which requires the examination of two issues: first the expected physical life of residential property and second the pattern of depreciation over time. Accordingly, respondents were asked to estimate: (a) the expected physical life for a typical 3 bedroom property in their study area and, (b) the pattern of depreciation rates they would adopt for every 5 years of the estimated physical life of these 3 bedroom flats. We note that many models of depreciation (particularly the age life models) rely on property’s physical and
economic life. As earlier explained, the physical life is the length of time the property will continue to earn rental value. Economic life is the physical life plus whatever life span the property would have in addition to the physical life due to renovation and refurbishment.
In this , the respondents were asked to provide their opinion on the physical life of the residential and commercial of property types which was measured with the use of a Likert scale of 1-5
Table 4: Physical Life of Residential Property: A typical Block of 3-bedroom Flat in Lagos Metropolis
Period of Physical life
Year
Very Strongly Agree W=5
Strongly Agree
W =4
Weakly Agree
W =3
Disagree
W = 2
Strongly Disagree
W = 1
∑WF ∑WF/N Rank
0- 5 0(0.00%) 0(0.00%) 0(0.00%) 0(0.00%) 47(100%) 47 1.000 7th
6 -10 0(0.00%) 0(0.00%) 0(0.00%) 2(4.25%) 45(95.74) 49 1.0425 6th
11 -15 0(0.00%) 0(0.00%) 0(0.00%) 3(6.38%) 44(93.62%) 50 1.0638 5th
16 -20 0(0.00%) 0(0.00%) 0(0.00%) 7(14.89%) 40(85.11%) 54 1.1489 4th
21 -25 0(0.00%) 2(4.25%) 5(10.64%) 15(31.91%) 25(53.19) 78 1.6596 3rd
26 -30 2(4.26%) 5(10.64%) 10(21.28%) 15(31.91%) 15(31.91%) 105 2.2340 2nd
31 -35 10(21.28%) 5(10.64%) 15(31.91%) 10(21.28%) 7(14.89%) 142 3.0213 1st
36 -40 10(21.28%) 5(10.64%) 15(31.91%) 10(21.28%) 7(14.89%) 142 3.0213 1st
41 – 45 10(21.28%) 5(10.64%) 15(31.91%) 10(21.28%) 7(14.89%) 142 3.0213 1st
46 – 50 2(4.26%) 5(10.64%) 10(21.28%) 15(31.91%) 15(31.91%) 105 2.2340 2nd
51 -55 0(0.00%) 2(4.25%) 5(10.64%) 15(31.91%) 25(53.19) 78 1.6596 3rd
Source: Field Survey, (2011
Table 4 above shows the opinions on the physical life of a block of 3-bedroom flat at Ikeja, Lagos. The table confirms that a 3-beroom flat reaches it physical life at the age of 40 - 45 years. This is so from the three RII
scores of 3.0213 corresponding to 31 – 35, 36 -40 and 41 – 45 years and all ranked first. The highest of these was selected as the expected physical life.
Table 5: Depreciation Pattern of Residential Property: A Typical Block of 3-bedroom Flats in Lagos Metropolis
Period of Physical life Year
79
0 -5% 6 – 10% 11 – 15% 16 -20% 21% and
above
WF ∑WF/N
0- 5 0(0.00%) 0(0.00%) 0(0.00%) 0(0.00%) 0(0.00%) 00 0..000
6 -10 0(0.00%) 0(0.00%) 0(0.00%) 0(0.00%) 0(0.00%) 00 0.0000
11 -15 0(0.00%) 0(0.00%) 0(0.00%) 3(6.38%) 44(93.62%) 47 1.0040
16 -20 0(0.00%) 0(0.00%) 0(0.00%) 7(14.89%) 40(85.11%) 48 1.0050
21 -25 0(0.00%) 2(4.25%) 5(10.64%) 15(31.91
%)
25(53.19) 67 1.3001
26 -30 2(4.26%) 5(10.64%
)
10(21.28%) 15(31.91 %)
15(31.91%) 110 2.3400
31 -35 10(21.28
%)
5(10.64% )
15(31.91%) 10(21.28 %)
7(14.89%) 138 2.9342
36 -40 10(21.28
%)
5(10.64% )
15(31.91%) 10(21.28 %)
7(14.89%) 151 3.2120
41 – 45 10(21.28
%)
5(10.64% )
15(31.91%) 10(21.28 %)
7(14.89%) 148 3.1489
46 – 50 2(4.26%) 5(10.64%
)
10(21.28%) 15(31.91 %)
15(31.91%) 144 3.0638
51 -55 0(0.00%) 2(4.25%) 5(10.64%) 15(31.91
%)
25(53.19) 139 2.9543
Source: Field Survey, (2014)
Figure 1: An S-Curve Graph of Residential Property Depreciation Rate in Lagos Metropolis
years
Time Series Analysis of Depreciation pattern of Residential property in Lagos metropolis
80 Table 5 above and the diagram that follows show the pattern depreciation follows over time according to the collective perceptions of the valuers. The shape is in
the form of an S which resembles the S shape found by Connellan (1997) in the UK. The pattern was based on a physical life of 43 years
.
Table 6: Mean Scores of the Pattern of depreciation of Physical life of a Block of 3-bedroom flat in Lagos Metropolis using S Shape time series versus Estimated percentage, Straight line, and Reducing Balance models.
Year of physical life
S shape Depreciation
Estimated % Depreciation
Straight line Depreciation
Reducing Balance Depreciation
2.50 0.00 0.00 0.50 7.70
8.00 0.00 0.50 0.80 5.90
13.00 0.30 1.00 1.20 4.50
18.00 0.70 1.50 1.50 3.50
23.00 1.00 1.80 1.80 2.70
28.00 2.10 2.20 2.00 2.00
33.00 2.90 2.50 2.30 1.60
38.00 3.20 2.70 2.80 1.20
43.00 3.10 3.00 3.00 0.90
48.00 3.00 3.20 3.30 0.70
Source: Field Survey, (2014)
Figure 2:
-1 0 1 2 3 4 5 6 7 8 9
0 10 20 30 40 50 60
y(S shape D)
y1(EPD)
y2(SLD)
y3(RBD)
Source: Field Survey, (2014) Table 6 and figure 2 shows that the depreciation
pattern of the accurate S curve is clearly different from the pattern of the Estimated Percentage Depreciation, Straight line depreciation model and the reducing
81 used below to show if there is a statistical difference between the S-curve depreciation rates and those of
estimated percentage, straight line and reducing balance depreciation models.
Table 7: Student T- Test of Relationship between S shaped time series model and models used in Lagos Metropolis
Variables T value P value Conclusion
S shaped Time series vis-à-vis estimated % depreciation
1.5700 0.00 Variance not equal at 5%
S shaped Time series vis-à-vis straight line Depreciation
1.6300 0.00 Variance not equal at 5%
S shaped Time series vis-à-vis Reducing Balance Depreciation
2.2900 0.00 Variance not equal at 5%
Source: Field Survey, (2014)
Table 7 shows the result of the T tests which examines the proposition that the variance of two groups are equal. A small P value (< 0.5) indicates that this proposition is false at 5% level of significance. P values for the relationship between S curve versus Estimated Percentage Depreciation (EDP), Straight line Depreciation (SLD) and Reducing Balance Depreciation (RBD) are all below 0.05, meaning that there is significance difference between the depreciation patterns. This means that the use of EPD, SLD and RBD is substantially inaccurate.
Implications of Findings: The findings demonstrate that the most often use models are estimated percentage depreciation and the Age life models (i.e. straight line depreciation and other models such as reducing balance depreciation etc). However, the analysis also showed that though the most often used models and most user friendly models are not necessarily the most consistent models and they are not necessarily the models that separate the components of depreciation. In fact, the analysis showed that the most often used model scored the least in term of separation of the components of depreciation. The implication here is clear; user friendliness is not the only yard stick for a good depreciation model. The most appropriate model will be the model that is not only user friendly but also consistent in use, capable of separating and identifying depreciation components according to IVSC (2007) standards and also capable of accurately followed the pattern that depreciation follows over useful life of the property.
A further source of worry is prosperity of valuers in their application of depreciation models. This called for special concerted guidance from professional
regulatory bodies such as (NIESV and ESVERBON) as to the most accurate, consistent and user friendly models which also separate between depreciation components? We note in the UK, the RICS regularly provides valuation information papers which guide valuers in their usage of valuation models. Perhaps, in Nigeria valuation regulatory bodies might wish to consider doing the same.
RECOMMENDATIONS
The most important findings in this study is that depreciation models most often used are inaccurate compared with what the S curve pattern. This study accordingly recommends as follows.
It is confirmed that depreciation of residential property follows an S shape in all the six cities that were studied. Nigerian valuation regulatory bodies (NEISV and ESVERBON) should publicize the results of this study so as to demonstrate to valuers that the models that are frequently used are not necessarily the best from the available options. The goal of valuers should be to ensure that the depreciation models used are consistent, accurate and user friendly and that they that they distinguish between valuation components according to IVSC standards. Estate surveyors should know the accurate depreciation rate to use at different stages of the physical life of the property.
82 are preoccupied with valuation models taught in old UK textbooks. More recently depreciation modeling in the UK and the USA has broadened to include several innovative models which most valuers in the study areas are not very aware of. It could be useful to further examine the relative merit and disadvantages and applicability of these new models painstakingly and particularly consider those emerging models in USA appraisal such as the breakdown model and the market extraction model.
CONCLUSION
The study has attempted to bridge a research gap arising from the paucity of empirical research into the depreciation measurement in DRC valuation in Nigeria. It has also added to the limited body of knowledge in study of valuation methodology and practice in the country. The study discovered that most of the valuers in Nigeria use Age life and estimated percentage depreciation when using cost method of valuation. The physical life of residential property varies between 41 and 45 years of age and depreciation follows closely an S-curve shape depreciation pattern like was found in the UK. However, the depreciation patterns of the models used by valuers are significantly different from this accurate S shaped pattern. Inaccurate patterns would no doubt produce inaccurate and inconsistent measurement of depreciation. The study has recommended that regulatory bodies should endearvour to provide valuation guidelines where all the criteria of depreciation measurement would be accommodated. Depreciation measurement should be consistent, accurate, user friendly and capture all the component of depreciation.
In view of all the above, the study conclude that depreciation measurement in Southwestern Nigeria is inaccurate, inconsistent and incapable of separating depreciation components. A number of policy implications have been identified in this study which should logically address this ugly situation. It is hoped that Nigeria regulatory bodies will adopt the political will to implement these recommendations and policy implications so that valuers will not be accused of providing inappropriate valuation which could potentially misguide their clients and bring the profession into ridicule.
REFERENCES
Ajayi, C.A. (1996). “Theories, Techniques and Practice of Development Appraisal” Being the text of an invited paper presented at a National Training Workshop of the Nigerian Institution of Estate Surveyors and
Valuers. Lagos. 1 – 12.
Appraisal Institute (2001) “The Appraisal of Real Estate”12th edition, Illnois.
Barras R. and Clark P (1996). “Obsolescence and Performance in the Central London Office Market” Journal of Property Valuation and Investment14 (4):13 -22.
Baum, A.(1991). “Property Investment Depreciation and Obsolescence”5th edition Routledge; London. Baum A. (1997). “The Causes and Effects of Depreciation
in Office Buildings: A Ten year Update RTCS Conference, the Cutting Edge.
Baum, A. and Macgregor, B.(1992). “The Initial yield revealed: Explicit Valuation and the Future Investment” Journal of Property Valuation and Investment 10 (2):2 -10
Bello, O.M. (2007). “The Influence of Contemporary Models on Valuation Practice in Nigeria” FIG Working Week 2007, Hong Kong, China.
Carnaday R.F. and Sundaman M.A. (2006). “Estimation of Depreciation for Single Family Appraisals Journal 14 (2): 5 -11
Coe, R. (1995)” Investment Behaviour: The Measurement of Depreciation and Tax Policy”American Economic Review65 (6):2 -13.
Connellan, O.P. (1997). “Valuation of Specialized Public Sector Assets” Journal of Property Management 15 (4): 5- 12.
Corgel, J. et al (1998). “The Concept and Estimation of Economic life in the Residential Appraisal Process”. The Society of Real Estate Appraisers Foundation5 (2):16 – 23
Crusby, N., and Murray C. (2009). “Measuring Depreciation in European Office Markets – Just another Valuation Problem?” Paper presented at the European Real Estate Society Conference; 29, June, 2009, Stockholm.
Cui, Ping Ping, Hao, Shng Yu (2006). “The study of Cost Approach in Real Estate Appraisal Bassed on Fuzzy Mathematics”. The CRIOM 2006 International Symposium on Advancement of Construction
Management and Real Estate.
Dixon, T.(2007). “A Critical review of methodologies for measuring rental Depreciationapplied to UK Commercial real estate” Journal of property Research 16 (2):16 –23.
Doms, T. (2003). “The Analytical Derivation and Empirical Test of a Tax-Adjusted Fundamental Value Model” Journal of Accounting Research 30 (5):23 -31. Dotzour, F. (2005). “The Economic Theory of Replacement
83 Follain, J. and Malpezzi, S. (2004). “Dissecting Housing
Value and Rent: Estimates of Hedonic indexes for Thirty-nine large SMSA’s” The Urban Institute. Gyamti F. and Ayitey J. (2006). “Assessing Depreciation
Valuation Purpose – A Decomposition Approach” 5th
FIG Regional Conference Accra, Ghana.
Hall, R. (1999). “The Measurement of Quality Changes from Vintage Price Data.” In Price Indexes and Quality Change, Harvard University Press; Cambridge.
Hill, R.J.. and HillT. T.P (1999). “A New Coneptual Approach to the Measurement of Capital Gains, Depletion and Net National Products” University of New South Wales
Discussion Paper UNSW, Sydney.
Hill, T.P. (1999). “Capital Stocks, Capital Services and Depreciation” Economic Commission of European
Community, Sydney.
Hoesli, M. and Macgregor B. (2000). “Property Investment Principles and Practice of Portfolio Management”6th edition; Pearson Education Limited, England.
Hulten, C. and Wykoff, C. (2003). “The Feasibility of Equating Tax to Economic Depreciation, Compendium of Tax 23 (2):21 -28.
IPD (2009). “IPD Global Property Index, London” Investment Property Databank.
IVSC (2007).” Valuation Information Paper IV – The Cost Approach for Financial Reporting” International
Valuation Standard Commission.
Johnson, T. (2000). “ Modern Methods of Valuation” 9th edition, Estate Gazette Ltd. London.
Jonas, F. et al(2004). “A Competitive Testing Approach to Models of Depreciation in Housing” Journal of Economics Business, 33 (3):42 -48.
Khalid, A.(1992). “Hedonic Estimation of the Financial Impact of Obsolescence on Commercial offices Building” 2nd edition; University of Reading, UK.
Law V. (2004). “The Definition and Measurement of Rental Depreciation in Investment Property”. University of Reading, UK.
NIESV (2006). “Valuation Standards and Guidiance Notes” 1st edition; The Nigerian Institution
Ogunba O.A. (2009).“Toward Sustainable Depreciation Measurement in Depreciated Replacement Cost Valuation: A Study in Nigeria”. Proceedings of the 4th International Conference of the Faculty of Environmental Design and Management, Obafemi Awolowo University, Ile-Ife.
Ogunba O.A. (2011). “An Examination of Depreciation Sustainability in DRC Valuations” Journal of Property Investment and Finance, 23 (2) 45 - 53.
Plimmer, F. and Sayce, S. (2006).” Depreciated Replacement Cost: Consistent Methodology? Shaping the Change XXIII FIG Congress, Munich, Germany. RICS (2005) “RICS Appraisal and Valuation Standard, (The
Red Book)” 4th edition; The Royal Institution of Charted Surveyors. London,
Taubman, P. and Rasche, R. (1999). “Economic and Tax Depreciation of Office Building.” National Tax Journal 22 (3): 02 -112.
Wikipedia (2009):www.wikipedia.com.
Willer, R. (2004).” Research Surveys” 5th edition; Pitman and Sons Ltd London,
Winfrey, M.(2000). “Engineering Valuation and Depreciation”. 5th edition McGraw-Hill, London. Wykoff, F. and Hulten, C. (2000). “Tax and Economic
Depreciation of Machinery and Equipment: A Theoretical and Empirical Appraisal, Phase II Report.” Economic Depreciation of the U.S. Capital Stock: A First Step. U.S. Department of the Treasury, Office of Tax Analysis; Washington, DC.