R E S E A R C H
Open Access
Taxa-function robustness in microbial
communities
Alexander Eng
1and Elhanan Borenstein
1,2,3*Abstract
Background:The species composition of a microbial community is rarely fixed and often experiences fluctuations of varying degrees and at varying frequencies. These perturbations to a community’s taxonomic profile naturally also alter the community’s functional profile–the aggregate set of genes encoded by community members–ultimately altering the community’s overall functional capacities. The magnitude of such functional changes and the specific shift that will occur in each function, however, are strongly dependent on how genes are distributed across community members’genomes. This gene distribution, in turn, is determined by the taxonomic composition of the community and would markedly differ, for example, between communities composed of species with similar genomic content vs. communities composed of species whose genomes encode relatively distinct gene sets. Combined, these observations suggest that community functional robustness to taxonomic perturbations could vary widely across communities with different compositions, yet, to date, a systematic study of the inherent link between community composition and robustness is lacking.
Results:In this study, we examined how a community’s taxonomic composition influences the robustness of that community’s functional profile to taxonomic perturbation (here termedtaxa-function robustness) across a wide array of environments. Using a novel simulation-based computational model to quantify this taxa-function robustness in host-associated and non-host-associated communities, we find notable differences in robustness between communities inhabiting different body sites, including significantly higher robustness in gut communities compared to vaginal communities that cannot be attributed solely to differences in species richness. We additionally find between-site differences in the robustness of specific functions, some of which are potentially related to site-specific environmental conditions. These taxa-function robustness differences are most strongly associated with differences in overall functional redundancy, though other aspects of gene distribution also influence taxa-function robustness in certain body environments, and are sufficient to cluster communities by environment. Further analysis revealed a correspondence between our robustness estimates and taxonomic and functional shifts observed across human-associated communities. Conclusions:Our analysis approach revealed intriguing taxa-function robustness variation across environments and identified features of community and gene distribution that impact robustness. This approach could be further applied for estimating taxa-function robustness in novel communities and for informing the design of synthetic communities with specific robustness requirements.
Keywords:Microbial community, Taxa-function relationship, Robustness
* Correspondence:[email protected] 1
Department of Genome Sciences, University of Washington, Seattle, WA 98102, USA
2Department of Computer Science and Engineering, University of
Washington, Seattle, WA 98102, USA
Full list of author information is available at the end of the article
Background
The examination and characterization of microbial com-munities have become increasingly important as their impacts on human health, industrial processes, and the environment have been recognized. These communities have been studied both in terms of their taxonomic and functional compositions, elucidating important commu-nity features and revealing intriguing disease- and
environment-associated variation. A community’s
taxo-nomic composition is often determined via targeted 16S
rRNA sequencing [1], a technique that uses
hyper-variable regions of the 16S rRNA gene to identify the microbes present in a given community and estimate their relative abundances. Such taxonomic information can provide insight into inter-microbial or host-microbe interactions and facilitate the detection of shifts in com-munity ecology that may be associated with host disease
[2–6]. The functional composition of a community, in
turn, can be estimated via whole metagenome shotgun sequencing followed by gene annotation. Using such data, gene-level analyses have provided insight into the functional capacities of various microbial communities
[7,8] and how those capacities change over time or vary
with altered environmental conditions [9,10].
Indeed, these two facets of microbiome composition, namely its taxonomic structure and its functional capaci-ties, offer different but complementary views into micro-bial communities. These two aspects of microbiome organization, however, are clearly not independent as the composition of genes in the metagenome is a direct derivative of the genes encoded by the community
mem-bers’genomes and the relative abundance of each
mem-ber in the community. Moreover, this link can be represented as a simple set of linear equations wherein the abundance of each gene in the metagenome is the
sum of that gene’s copy number in each community
member’s genome weighted by the relative abundance of
each community member (Fig. 1a) [11]. This inherent
link between a community’s taxonomic composition and
its functional profile, here referred to as the
taxa-func-tion relataxa-func-tionship[12], has many practical applications in the analysis of microbial communities. For example, this relationship is explicitly utilized by tools such as
PICRUSt [13] and Tax4Fun [14] for predicting overall
community gene content based on the community taxo-nomic profile and available reference genomes. Other studies have similarly used the taxa-function relationship to identify taxonomic drivers of disease-associated func-tional shifts [15] or to estimate differences in community
metabolic capacities [16]. Such methods for integrated
analysis of multi-omic microbiome data offer unique, mechanistically driven insights into how taxonomic composition affects community function through fea-tures such as gene abundances and metabolism.
Conceptually, the taxa-function relationship can be viewed as a structure-to-function landscape, whose top-ology is determined by the distribution of genes across community genomes. As such, it is similar to the fitness
landscape concept used in evolutionary biology [17–20],
but instead of describing how changes in genotype map to changes in phenotype, it describes how changes in a
microbial community’s composition map to changes in
the community’s functional capacities. Characterizing
the topology of this taxa-function landscape is similarly crucial for understanding how constraints on commu-nity ecology restrict commucommu-nity function and should be considered when designing the targeted manipulation of community composition. One important manifestation of the taxa-function landscape is the degree to which a
shift in a community’s taxonomic composition will
im-pact its functional capacities (a property that we refer to
here astaxa-function robustness). Specifically, depending
on the local topology of the taxa-function landscape around a given community, changes in the abundance of its members could result in a minor or major alteration to the community’s functional profile [21–24] (Fig. 1b; analogous to the impact of the fitness landscape on
gen-etic robustness [25, 26]). As noted above, the topology
of the landscape around a given community, and conse-quently, its taxa-function robustness depends solely on the manner in which genes are distributed among the
genomes of that community’s members (Fig. 1c). For
ex-ample, if a specific gene family (or pathway) is encoded by a single species in the community, any perturbation
to that species’ abundance will directly translate to
changes in the abundance of this gene family in the
metagenome and ultimately in the community’s
func-tional profile. If, however, this gene family is encoded by multiple species in the community, its abundance is less likely to substantially change in the face of taxonomic perturbations as a decrease in the abundance of one spe-cies that encodes this gene family could be compensated
for by an increase in the abundance of another [21–24].
Moreover, if multiple genes tend to co-occur across the
various genomes in a community [27], then those genes
(and the functions associated with them) will shift in a similar manner as the taxonomic composition is per-turbed. Combined, these observations suggest that the taxonomic composition of a community (which in turn also determines the distribution of genes across
commu-nity members) directly impacts the taxa-function
robust-ness of that community and may therefore vary
substantially from community to community.
a
c
d
e
b
genotype-to-phenotype relationship regardless of ob-served evolutionary trajectories). As such, it may not
necessarily correspond to conventional notions of
ecological robustness or to the resilience or stability of mi-crobial community function. Yet, characterizing such underlying taxa-function robustness and its determinants is essential for gaining a profound understanding of commu-nity dynamics and function. For example, this feature of a
community’s local taxa-function landscape could indicate
how susceptible a community’s functional capacities are to stochastic fluctuations in the community’s composition and can be used as a null model when studying community dy-namics in response to environmental change. More gener-ally, while microbiome perturbations, be they minor stochastic fluctuations or major shifts in response to envir-onmental modulation, are often characterized as ecological changes, in many cases, the most important consequences of these perturbations are shifts in overall community func-tion. In the context of disease-associated dynamics, taxa-function robustness will also determine whether the func-tional capacities of a community could be maintained in the face of ecological dysbiosis. For example, the function of the gut microbiome is robust enough to maintain normal function despite day-to-day fluctuations in taxonomic
com-position [28], but may become disrupted following a more
drastic perturbation as in the case of Clostridium difficile
infection [29]. Determining a community’s functional ro-bustness can further help estimate the functional impact of a planned targeted perturbation (e.g., via a particular pro-biotic) or evaluate candidate synthetic communities during the design process to gauge how susceptible they are to dis-ruption of function.
Here, we set out to systematically characterize and study the taxa-function robustness of communities from diverse environments. This requires a comprehensive, systematic, and unbiased mapping of the local topology
of the underlying taxa-function landscape around each community composition. Unfortunately, currently avail-able experimental data does not adequately or compre-hensively survey functional shifts associated with small changes to a particular taxonomic composition. We ad-dress this challenge by using a simulation-based ap-proach, uniformly and systematically simulating a range of possible perturbations (including small perturbations)
to each community’s taxonomic composition. This
ap-proach, combined with the prediction of community functional profiles associated with each such perturb-ation, allows us to generate a large set of perturbed com-positions relative to each original community and to sample the taxa-function landscape around these com-munities. Given this simulation-based approach, below, we first define two factors that characterize a
commu-nity’s taxa-function robustness. We then present an
ana-lysis of how taxa-function robustness varies within and between body sites in human-associated communities as well as across several non-host-associated communities. We extend this analysis to the robustness of individual functions and pathways, identifying universally robust functions and noting that environment-specific pressures may influence robustness variation in specific functions. Next, we investigate how the manner in which genes are distributed across microbial genomes is associated with
a community’s taxa-function robustness and use this
in-formation to predict robustness directly from taxonomic composition. Finally, we confirm that our robustness es-timates are in agreement with observed taxonomic and functional shifts measured from experimental data.
Results
Characterizing and defining taxa-function robustness
Consider the taxa-function mapping discussed above,
linking a community’s taxonomic and functional
(See figure on previous page.)
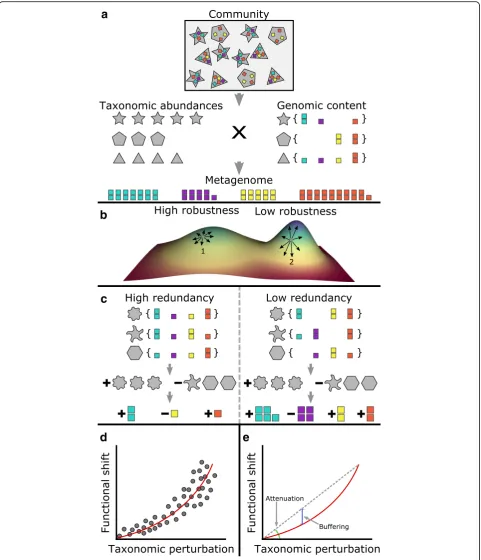
Fig. 1An illustration of the taxa-function relationship and response curves.aThe functional profile of a community is a linear combination of the
functional profile of each taxon in a community (the copy number of each gene in each taxon’s genome) weighted by the abundance of each
taxon in that community. Note that here, a taxon need not be a species, but can instead represent any subpopulation of the community with
shared genomic content (such as a single strain of a particular species).bThe taxa-function relationship can be modeled as a high-dimensional
landscape, linking each community composition to the corresponding functional profile. Here, we show an extremely simplified two-dimensional abstraction of this model to illustrate the impact of this landscape on taxa-function robustness. In this illustration, each coordinate on the plane corresponds to a specific taxonomic composition, with points close to one another corresponding to communities with similar taxonomic compositions. The height represents the functional profile of the community (and in this simplified illustration can denote, for example, the abundance of some function). Notably, the local topology of this landscape around a specific taxonomic composition (e.g., point 1) determines whether minor changes in that composition (represented as small movements on this plane; black arrows) will induce small (point 1) or large (point 2) functional
shifts.cDepending on the exact distribution of genes across the genomes of species in a community, changes to the taxonomic composition
of a community can produce functional shifts of varying magnitudes. For example, if the distribution of genes differs markedly between two communities (e.g., high vs. low redundancy), similar taxonomic composition perturbations to both communities may produce drastically different functional
shifts.dTo model the relationship between taxonomic perturbations and functional shifts in a given community, a taxa-function response curve is obtained
by fitting a power function to a large array of measurements of functional shifts associated with many different taxonomic perturbations of
varying magnitudes.eThe taxa-function response curve can be decomposed into two factors:attenuation, which describes how quickly functional
shifts increase in magnitude as taxonomic perturbations increase, andbuffering, which indicates how well functional shifts are suppressed at smaller
compositions. To rigorously characterize how this map-ping impacts taxa-function robustness, we define the
taxa-function response curve, describing the average shift in the functional profile of a community as a function of the taxonomic perturbation magnitude and the stability
of a community’s functional profile when faced with
taxonomic perturbations (Fig. 1d). Response curves are
commonly used in biology to describe how the changes in an organism vary as the magnitude of a particular stimulus is modulated (e.g., drug dosage-dependent physiological effects) and allow quantitative comparisons between the response curves of different individuals
[30–33]. Interpreting a community’s taxa-function
ro-bustness via these response curves could offer insights such as the potential impact of antibiotics on a
commu-nity’s functional capacities or the expected stability of
candidate synthetic communities. For example, a
com-munity’s taxa-function response curve could be used to
identify an antibiotics dosage threshold above which there would be significant disruption to community function. The specific form of the taxa-function re-sponse curve was chosen by comparing the fit of various functions to the relationship between taxonomic per-turbation and functional shift magnitudes across all
communities examined (Additional file1: Supplementary
Text; Additional file2: Figure S1; Methods).
To provide a direct, quantitative, and interpretable comparison of taxa-function robustness differences be-tween communities, we will further specifically focus on two robustness factors that can be derived from the
re-sponse curve (Fig. 1e): The first factor isattenuation or
how rapidly functional shift increases as perturbation magnitude increases. Attenuation describes the slope of the response curve and thus models the intuitive expect-ation that larger perturbexpect-ations should generate larger functional shifts. Technically, attenuation is defined as inversely proportional to the response curve slope, im-plying that increased attenuation leads to smaller func-tional shifts and thus higher robustness. The second
factor is buffering or how well functional shifts are
sup-pressed at smaller perturbation magnitudes. Buffering determines how large a taxonomic perturbation must be before noticeable functional shifts occur. Higher buffer-ing thus indicates that relatively large perturbations are required before a substantial functional shift could be observed. This factor is especially important when con-sidering community robustness in the absence of major external changes, as buffering will determine whether small fluctuations in composition due to stochastic variation, neutral community dynamics, or minor envir-onmental variation will significantly impact the
commu-nity’s function. Indeed, many biological systems can
completely buffer small perturbations, but may be more
susceptible when exposed to larger perturbations [34,
35]. The precise definitions of the response curve and
the two robustness factors are further elaborated in the
“Methods”section.
Taxa-function robustness varies within and between environments
To comprehensively characterize taxa-function robust-ness across the human microbiome and certain non-host-associated ecosystems, we obtained taxonomic compositions from previously assayed communities representing several distinct environments. Specifically, we considered four sites from the human microbiome, including 128 gut communities, 1141 oral communities (pooled from 9 subsites), 285 skin communities (pooled from 3 subsites), and 209 vaginal communities (pooled from 3 subsites), all obtained as part of the Human
Microbiome Project [36]. Additionally, to extend our
study beyond host-associated communities, we included 132 aquatic communities (pooled from 3 subsites) and 199 soil communities (from 4 subsites), collected in
as-sociation with the Earth Microbiome Project [37]. For
each community, we generated 4500 perturbed taxo-nomic compositions at varying magnitudes (using the weighted UniFrac distance between the original and turbed community to measure the magnitude of per-turbation). Compositional perturbations were simulated by randomly modifying the abundances of individual taxa in the original community such that the expected
magnitude of change in each taxon’s abundance was
proportional to its original abundance. We further fil-tered the obtained perturbations to uniformly sample perturbation at a range of taxonomic distances, resulting in an average of 933 ± 186 perturbations per community
and a total of 1,954,447 perturbations (see“Methods”for
complete details). To determine the functional profiles of both the original and perturbed compositions, we
used PICRUSt [13], a computational framework for
in-ferring the functional profile of a given community based on its taxonomic composition as described above. Using these inferred functional profiles, we measured the functional shift associated with each taxonomic per-turbation and obtained a taxa-function response curve for each community as described in the previous section. We further calculated the associated attenuation and buffering values based on the response curve of each
community (“Methods”). With this approach, we were
able to compare response curves and robustness factors between communities and examine how taxa-function robustness varied within and between environments.
magnitude of the taxonomic perturbation (Fig. 2a). Notably, we observed some variation in the extent of functional shifts associated with taxonomic perturba-tions of a similar magnitude. Interestingly, comparing this response curve to the response curve for a
commu-nity from a different environment–the gut–revealed
marked differences, with the gut community displaying
noticeably smaller functional shifts at similar
taxonomic perturbation magnitudes (Fig. 2b). These
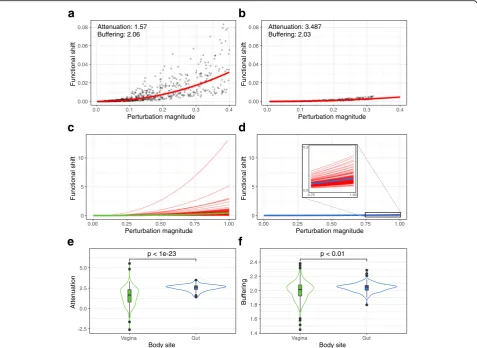
differences are also apparent in the corresponding robustness factors, with the vaginal community having lower attenuation (1.57 compared to 3.487 in the gut) and comparable buffering (2.06 compared to 2.03). Moreover, the vaginal community also displayed more drastic deviations from its taxa-robustness response curve.
To examine whether the differences in robustness between vaginal and gut communities extended beyond these two specific examples, we compared the taxa-function response curves for all communities from these two body sites. This confirmed that vaginal communities indeed exhibited larger functional shifts on average com-pared to gut communities for similar taxonomic
perturbation magnitudes (Fig.2c, d). The gut
communi-ties also appeared to have more similar response curves across communities, whereas vaginal community re-sponse curves were more diverse. Examining the robust-ness factors of these communities further revealed a clear difference between these two body sites, with gut communities having significantly higher attenuation
compared to vaginal communities (Fig. 2e; p< 10−23;
Wilcoxon rank-sum test). Interestingly, however, we
Attenuation: 1.57 Buffering: 2.06
0.00 0.02 0.04 0.06 0.08
0.0 0.1 0.2 0.3 0.4
Perturbation magnitude
Functional shift
a
Attenuation: 3.487 Buffering: 2.03
0.00 0.02 0.04 0.06 0.08
0.0 0.1 0.2 0.3 0.4
Perturbation magnitude
Functional shift
b
0 5 10
0.00 0.25 0.50 0.75 1.00
Perturbation magnitude
Functional shift
c
0 5 10
0.00 0.25 0.50 0.75 1.00
Perturbation magnitude
Functional shift
d
p < 1e-23
-2.5 0.0 2.5 5.0
Vagina Gut
Body site
Attenuation
e
p < 0.01
1.4 1.6 1.8 2.0 2.2 2.4
Vagina Gut
Body site
Buf
fering
f
0.0 0.3
0.75 1.00
Fig. 2Examples of taxonomic perturbations, their corresponding functional shifts, and the associated response curves. The taxonomic perturbation
and functional shift magnitudes generated for a single vaginal (a) and a single gut (b) community. Each point represents a single perturbation. The
red lines indicate the taxa-function response curve fit to these points. The response curves for all vaginal (c) and gut (d) communities are overlaid to
compare general body site trends. Green and blue lines represent the mean response curve for all vaginal and gut communities respectively. The
robustness factor distributions associated with these response curves are shown as violin plots with inlaid boxplots for attenuation (e) and buffering (f).
found only slightly higher buffering values in gut com-munities (Fig.2f; p< 0.01; Wilcoxon rank-sum test). We further examined whether this marked difference in robustness between the vaginal and gut microbiomes can be attributed solely to the substantially lower diver-sity of vaginal microbiomes. To this end, we subsampled all communities from the vagina and gut to obtain
com-munities with comparable diversity (“Methods”). We
found that, in these subsampled communities, attenu-ation was still significantly higher in the gut compare to the vagina, which suggested that the difference in robustness could be attributed, at least partly, to some environment-specific features that go beyond commu-nity diversity (Additional file 3: Figure S2; p< 10−6; Wilcoxon rank-sum test).
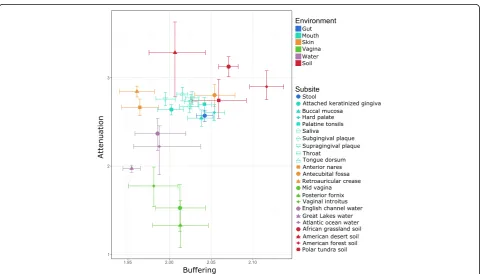
To extend this analysis beyond vaginal and gut com-munities, we next examined the robustness factors of every community from all environments we analyzed. For this analysis, we also separated HMP communities by subsite to determine how between-subsite robustness differences compared to differences between more dis-tantly related environments. Our analysis revealed substantial variation in attenuation between environ-ments, potentially suggesting different pressures to maintain robust functional profiles under different
envir-onmental conditions (Fig.3). Notably, communities from
all three vaginal subsites appear to have the lowest
attenuation, with communities from other body sites exhibiting higher (and more comparable) attenuation. In contrast, communities from two of the three skin subsites appear to be among the most robust body site communities. Soil communities tend to have the highest attenuation, whereas marine communities have inter-mediate attenuation values. Interestingly, subsites from the same environment tend to cluster by attenuation and buffering, suggesting that spatially distinct subsites (such as different locations in the mouth) still exhibit similar taxa-function robustness factors, potentially
reflecting shared environment-specific conditions.
Buffering similarly exhibited some variation between en-vironments but not as extreme as the variation seen in attenuation values; in the analyses below, we there-fore focus mainly on attenuation to examine differ-ences in robustness.
Function-specific robustness reflects environmental conditions
Given the variation in overall taxa-function robustness observed above, we next set out to examine whether ro-bustness also varied across different functions and
whether such function-specific robustness is consistent
across environments. To this end, we calculated function-specific response curves that described the average magnitude of the relative shift in a particular
Fig. 3Comparison of attenuation and buffering between environments and subsites. Points represent the median attenuation and buffering values of
samples from the indicated subsite, with error bars indicating the 95% confidence interval of the median in both dimensions (see“Methods”). Colors
function’s abundance due to a taxonomic perturbation (see “Methods”). The resulting function-specific re-sponse curves can be analyzed as described above to ob-tain function-specific attenuation measurements.
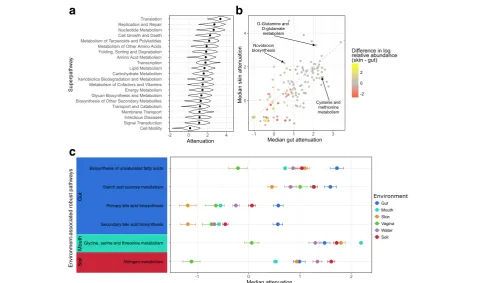
Examining function-specific attenuation at the super-pathway level, we found marked variation in the robust-ness of different functions. Perhaps not surprisingly, superpathways associated with universal housekeeping activities, such as translation, nucleotide metabolism, and cell growth, were among the most robust functions, likely reflecting high redundancy in these functions across genomes in all communities and environments
(Fig. 4a). In contrast, functions associated with a more
specialized lifestyle, such as cell motility, transport, sec-ondary metabolite biosynthesis, and glycan metabolism were generally less robust.
To further characterize differences in function-specific robustness across environments, we next compared the attenuation of each function between environments, this time analyzing functions at the pathway level. This ana-lysis revealed similarly intriguing between-environment differences. Notably, the difference observed in a function’s robustness between environments often does not seem to be associated with the difference in function abundance
between environments (Fig. 4b, Additional file 4: Figure
S3). This finding suggests that the abundance and robust-ness of a given function may be driven by different pres-sures. Put differently, some functions may be beneficial at high capacity but can tolerate variation in their abundance, hence exhibiting high abundance but low robustness. In contrast, other functions may be advantageous at a more stable capacity, even though they are required at a relatively low capacity, and will hence exhibit high robustness but low abundance. For example, while cysteine and methio-nine metabolism occurs at low abundance in gut
communi-ties (1.5% median relative abundance; Additional file 5:
Table S1), it is one of the most robust functions specifically in the gut (2.43 median attenuation; 7th most robust gut function; Fig.4b, Additional file 6: Table S2). Indeed, cyst-eine and methionine deficiencies are associated with mal-nutrition and can be influenced in part by the gut
microbiome [38], and accordingly, maintaining a stable
capacity of genes from this pathway in the gut microbiome may be beneficial. Similarly, novobiocin biosynthesis had high robustness specifically in skin communities (2.23 me-dian attenuation; 10th most robust skin function) and its high robustness could be related to novobiocin’s antibiotic
activity against Staphylococcus epidermidis [39].
D-a
c
b
Fig. 4Attenuation of individual functions.aThe density of attenuation values for each KEGG superpathway across all communities, with dots indicating
the median attenuation.bA scatterplot of the median attenuation of each function in skin communities vs. gut communities. The color of each point
indicates the difference in log median relative abundance of that function between skin and gut communities. The gray line indicates the 1:1 relationship
in median attenuation. Only differentially abundant functions are show (FDR < 0.01; Wilcoxon rank-sum test).cEach point shows a function’s median
glutamine and D-glutamate metabolism also had high ro-bustness in skin communities (3.28 median attenuation; 5th most robust skin function) while being very low in abun-dance (0.3% median relative abunabun-dance). Enrichment for D-glutamine and D-glutamate metabolism in skin commu-nities has been linked to individuals prone to atopic
derma-titis [40]. This may suggest that rather than having high
robustness to maintain baseline capacity, D-glutamine and D-glutamate metabolism could have high robustness to prevent dramatic increases in abundance.
We finally investigated which functions displayed no-ticeably higher robustness in one or more environments
compared to the others (see “Methods”). This analysis
revealed many pathways that had significantly higher
ro-bustness in specific environments (Additional file 7:
Figure S4), including biosynthesis of unsaturated fatty acids, primary and secondary bile acid biosynthesis, and starch and sucrose metabolism, which were all more
ro-bust in the gut than any other environment (Fig.4c) and
potentially reflected the increased occurrence of metabo-lites related to these functions in the gut compared to the other environments. In contrast, glycine, serine, and threonine metabolism was most robust in oral commu-nities and could be related to the role of these amino acids in pH recovery in the oral environment after mi-crobial fermentation of carbohydrates [41]. Interestingly, nitrogen metabolism had higher robustness in soil com-munities compared to the various body site comcom-munities and may reflect the role that these communities play in the nitrogen cycle.
Gene distribution impacts taxa-function robustness across body sites
As discussed above, the observed variation in taxa-function robustness between and within environments likely reflects differences in the way various genes/func-tions are distributed across community members in each environment. To characterize how the distribution of functions contributes to robustness variation, we formu-lated a set of gene distribution features (GDFs), includ-ing average functional redundancy, average functional similarity, average genome size, genome size variability, and unique function abundance, to describe particular
aspects of this distribution (see “Methods”). Functional
redundancy, defined here as the redundancy of each function weighted by the relative abundance of that function, has been proposed as an important contributor
to the robustness of a community’s functional capacities
[21–24]. Functional similarity, defined here as the pair-wise similarity in genomic content between species, captures the interchangeability of microbes and the po-tential for a change in the abundance of one species to be compensated for by an opposite change in the
abun-dance of another. Genome size, measured here as the
number of genes in a genome, accounts for the possibil-ity that abundance changes in species with larger
genomes will produce larger functional shifts. Genome
size variabilitymeasured the presence of microbes with significantly different genome sizes, which could poten-tially decrease robustness due to the inability for such microbes to compensate for abundance changes in one
another. Finally, unique function abundance measures
the total abundance of functions that are encoded by a single species, aiming to capture the prevalence of func-tions with no redundancy (and hence with no potential for compensatory changes). Notably, while some of these GDFs are correlated with each other, these correlation magnitudes are < 0.5, suggesting that they indeed
capture different aspect of functional distribution
(Additional file 8: Figure S5). A precise mathematical
definition of these features can be found in the
“Methods” section. Importantly, though previous work has found some association between robustness and spe-cies diversity [42,43], here, we wish to focus on the im-pact of functional distribution and hence exclude species diversity as a feature in this analysis.
We calculated these GDFs for each community and examined how they correlate with robustness both within and across environments, aiming to identify uni-versal or environment-specific relationships with robust-ness. As expected, we found that functional redundancy
positively correlates with attenuation both when
communities from all environments are pooled together (r= 0.38; p< 10−72
) and within each environment
indi-vidually (Fig. 5a). Additionally, functional similarity
among community members appears to be positively as-sociated with attenuation when environments are pooled together (r= 0.24; p< 10−29), as well as in several indi-vidual environments (e.g., the gut). Genome size vari-ability, which we hypothesized may negatively impact robustness, does exhibit a negative association with ro-bustness when pooling communities from all environ-ments together, and both genome size and genome size variability also have negative associations in specific en-vironments (i.e., the gut or vagina). Interestingly, how-ever, these associations are not consistent across all environments and may indicate that the relationship be-tween these GDFs and robustness are in part influenced by other features of the community.
Obviously, the impact of each of the GDFs described above on robustness is not independent of the impact of other GDFs, and thus, their individual associations with robustness may not reflect how the combination of all five GDFs contributes to robustness. To examine how variation in attenuation is associated with the major axes of variation separating communities based on all GDFs simultaneously, we performed a principal component
Remarkably, we found that the first two principal com-ponents of these GDFs clearly separate communities by environment, even though they are based on only five simple summary metrics of gene distribution without dir-ectly accounting for the presence or absence of specific microbes or functions. This finding indicates a strong environment-specific signature of gene distribution. We further found a significant positive correlation between at-tenuation and both the first and second principal compo-nents (Fig. 5b; r= 0.44; p< 10−99 and r= 0.09; p< 10−4 respectively), confirming that the variation in the combin-ation of these GDFs is inherently associated with varicombin-ation in community robustness. Given these findings, we additionally examined whether GDFs can be used to pre-dict the robustness of each community, using both the set of 5 GDFs above, as well as an expanded set of 45 GDFs
(Additional file9: Table S3A-B). This analysis again
dem-onstrated the strong association between gene distribution profiles and taxa-function robustness (though predictive
power varied markedly between environments) and highlighted the importance of functional redundancy in
determining robustness (Additional file 1: Supplementary
Text, Additional file 10: Figure S6; Additional file 11:
Figure S7, Additional file12: Table S4).
Taxa-function robustness estimations are in agreement with observed functional shifts
The above results rely on simulated taxonomic perturba-tions and predicted functional profiles (via PICRUSt) ra-ther than on observed taxonomic shifts and shotgun metagenomic-based functional profiling. Clearly, there are caveats involved in both simulated perturbations (which may not reliably capture natural community fluc-tuations) and prediction accuracy. Yet, as described in
the “Background” section, this simulation-based
ap-proach is crucial for comprehensively mapping the local taxa-function landscape. Specifically, this approach al-lows us to survey a large set of perturbed community
b
a
Fig. 5Associations between gene distribution features (GDFs) and taxa-function robustness.aPearson correlations between GDFs and attenuation; blue
and red bars indicate significant (p< 0.01) positive and negative correlation coefficients, respectively, whereas gray bars show non-significant correlation
coefficients. Each panel corresponds to correlations when considering communities from all environments (pooled) or the subset of communities from a
particular environment.bCommunities plotted by the first two principal components (PCs) determined by principle component analysis (PCA) of the five
compositions uniformly distributed around each com-munity and sampled across a range of weighted UniFrac
dissimilarities (ranging from 0.001 to 0.4)––a
challen-ging task using available metagenomic data. Nonetheless, to confirm that our simulation-based estimates of ro-bustness are biologically meaningful, here, we further examine whether they agree with observed shifts in
communities’taxonomic and functional profiles. To this
end, we examined functional profiles that are based dir-ectly on shotgun metagenomic sequencing for a subset of the HMP communities used in our above analyses. Specifically, considering the HMP communities for which both a shotgun metagenome was available and the 16S rRNA data passed our quality filtering process (see“Methods”section), we were able to obtain 94 HMP communities from 5 different subsites with both
taxo-nomic and metagenome-based functional profiles.
Below, we use these communities to assess the agree-ment between predicted and metagenome-based func-tional profiles and between simulation-based robustness estimates and measured functional shifts. For the func-tional shift comparisons described below, communities from the same subsite were paired (resulting in 47 pairs), providing independent observations of functional shifts within each environment. Additionally, we were able to consider longitudinal shifts for a small number of com-munities (including 8 comcom-munities with 16S rRNA and metagenomic profiles sampled at two time points).
Using these data, we first verified that the composi-tions of the predicted functional profiles used in our analysis recapitulate metagenome-based functional pro-files. To this end, we compared the dissimilarity between each predicted functional profile and its corresponding metagenome-based functional profile to the dissimilarity between each predicted functional profile and a differ-ent, randomly chosen metagenome-based functional profile from the same subsite. We found that indeed the median cosine dissimilarity between the corresponding predicted and metagenome-based functional profiles (at the pathway level) was significantly lower compared to the dissimilarity between predicted functional profiles and other metagenome-based profiles from the same
subsite (p= 0.001, Wilcoxon rank-sum test). A
Procrus-tes analysis [44] of the first two principal components of the functional profiles further demonstrated a significant fit between predicted and metagenome-based profiles
(Procrustes measure of fit 0.89;p= 0.00001).
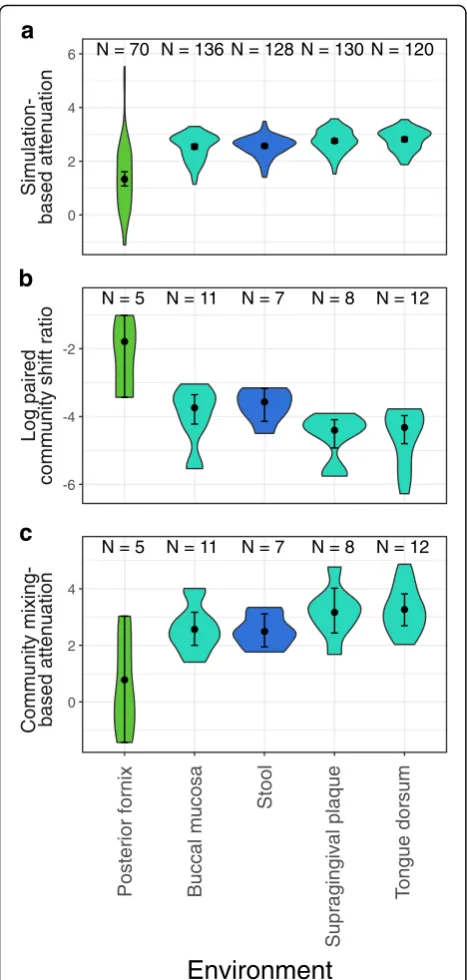
Next, we set out to examine the degree to which our simulation-based robustness estimates agree with ob-served functional shifts. In lieu of perturbed community compositions (and comparing the original and perturbed community compositions), we used pairs of communi-ties (from the same subsite), considering one community as representing the original community and the other as
representing a perturbed version of that original com-munity. We then measured (for each pair of communi-ties) the ratio between the dissimilarity in their functional profiles and the dissimilarity in their taxo-nomic profiles. This ratio is expected to be lower for more robust communities since taxonomic perturbations of similar magnitude should produce relatively smaller functional shifts in communities with higher taxa-function robustness. The findings of this analysis confirm our expectation above, demonstrating a noticeably lower robustness in vaginal communities (larger functional shifts relative to taxonomic perturbation magnitudes)
com-pared to gut and oral communities (Fig. 6a, b). This
suggests that the differences in attenuation values estimated from simulated perturbations reflect an inherent difference in how taxonomic changes induce functional shifts in com-munities from different environments.
Notably, as also discussed above, the taxonomic dissimilarities between different communities are sub-stantially higher than the range of local taxonomic per-turbations that are the focus of our study. Given this, the analysis above, using pairs of communities to repre-sent original and perturbed communities may fail to capture more subtle properties of the local landscape of functional shifts around a community. To address this potential shortcoming and examine the impact of small
taxonomic differences that are still rooted in
metagenome-based functional profiles, we used a
community-mixing approach. Specifically, given a pair of communities, a perturbed community composition at a specific (and small) taxonomic distance from the first community can be generated by identifying a mixing fraction and“replacing”this fraction of the first
commu-nity’s taxonomic and functional profiles with a
corre-sponding fraction of the second community’s taxonomic
and functional profiles, respectively. This community-mixing approach allowed us to generate a set of per-turbed community compositions at varying weighted UniFrac dissimilarities with metagenome-based func-tional profiles. We used this set of multiple perturbed compositions for each community to estimate the ro-bustness of the first community using the same
ap-proach described in Fig. 1e. We found that these
community-mixing metagenome-based attenuation
values recapitulated the robustness trends identified
using simulation-based attenuation estimates, with
vaginal communities exhibiting significantly lower
robustness than gut or oral communities, further supporting the agreement between simulation-based and
metagenome-based robustness estimates (Fig.6c).
measure longitudinal taxonomic and functional shifts (notably, relatively few HMP communities have both 16S rRNA and metagenome data available at two time points). As above, given a pair of communities from the same
subsite from an individual obtained at two time points, we use the dissimilarity ratio between their functional and taxonomic profiles as a measure of observed taxa-function robustness, with the expectation that this ratio will decrease as robustness increases. Indeed, we found that attenuation was negatively correlated with this
ratio (r=−0.75). Furthermore, for each individual, we
used the simulation-based robustness curve obtained for the community composition at the first time point, the metagenome-based functional profile of that community, and the observed taxonomic dissimilarly between the two time points to predict the expected metagenome-based functional shift between the two time points. Reassuringly, our expected functional shifts were positively correlated
with the observed functional shifts (r= 0.86, p= 0.006),
suggesting that these robustness curves are predictive of the relationship between the taxonomic perturbations and functional shifts that might be expected to occur over time in microbial communities.
Discussion
Microbial communities are recognized as important com-ponents of various systems including human health, envir-onmental resource cycling, and industrial processes. Given these varied and significant roles, improving our understanding of these systems requires a better compre-hension of how these communities are structured taxonomically, how they function, how they react to change, and the relationships between these features. Previous work using the inherent link between taxonomic structure and function in microbial communities has already led to intriguing results and powerful tools for
analyzing microbiome data [13–16]. However, a crucial
property that has not yet been comprehensively studied is
how a community’s underlying taxonomic structure
mod-ulates functional robustness in response to taxonomic perturbation. This taxa-function robustness is a direct de-rivative of community composition and of the distribution of genes across genomes, and while it may not correspond directly to conventional concepts of microbial community resilience and stability, it allows us to quantify an inherent component of the structure-function relationship between taxonomic and functional profiles.
Our analysis of robustness across various environ-ments revealed intriguing differences between communi-ties from different body sites. One of the more marked differences was between gut and vaginal communities, and while robustness to taxonomic perturbation has not been directly compared between gut and vaginal com-munities experimentally, there may be some evidence that supports vaginal communities being more
suscep-tible to disrupted function than gut communities [16,
45]. We also observed that skin communities from two
subsites were among the most robust host-associated
N = 136
N = 70 N = 128N = 130N = 120
N = 7 N = 11
N = 5 N = 8 N = 12
N = 7 N = 11
N = 5 N = 8 N = 12
Simulation-based attenuation
Log paired
community shift ratio
Community mix
ing-based attenuation
Posterior fornix Buccal mucosa
Stool
Supragingival plaque
T
ongue dorsum
0 2 4 6
-6 -4 -2
0 2 4
Environment
a
b
c
Fig. 6Robustness and metagenome-based functional shift trends
across subsites.aDistribution of simulation-based attenuation estimates
across five subsites, ordered by median attenuation in each subsite.b
Distribution of the log scale ratio of metagenome-based functional pro-file dissimilarity to taxonomic propro-file dissimilarity observed between pairs
of communities from the same subsite across five subsites.cDistribution
communities. This functional robustness to taxonomic perturbation is especially intriguing given recent obser-vations concerning the taxonomic stability of the skin microbiome despite virtually continuous perturbation
[46]. Indeed, the link between ecological stability and
taxa-function robustness is likely complex and multi-faceted since on the one hand high taxonomic stability may render taxa-function robustness unnecessary for maintaining community function, but on the other high taxa-function robustness may promote taxonomic stabil-ity via maintenance of the communstabil-ity niche.
We further found that functional redundancy was strongly associated with taxa-function robustness, in agreement with previously suggested hypotheses regard-ing the role of functional redundancy in microbial
com-munities [21–24]. Other GDFs also showed some
associations with robustness, but these associations were inconsistent across environments and may point to between-GDF interactions in determining robustness that masks a more consistent association with robust-ness. Notably, however, the five GDFs we examined ap-pear to separate environments along different principal components, suggesting that they capture key informa-tion about environment-specific differences in commu-nity structure. This is even more striking when considering that these GDFs do not directly mirror the presence or absence of certain taxa or functions. This GDF-based separation may therefore suggest that com-munities inhabiting different environments substantially differ in the way community members contribute to overall community functional capacities. For example, the higher functional redundancy and functional similar-ity in gut communities might indicate that many com-munity members in the gut are performing similar functions with relatively few specialized roles, whereas the increased presence of pathways unique to specific microbes and lower function redundancy in vaginal communities could point to a more well-defined and distinct functional niche in this environment.
To some extent, the extreme variation observed above in taxa-function robustness across environments may not be surprising. Some of this variation, for example, can be attributed to stochastic aspects of community as-sembly, such as priority effects or the pool of species from which community founders could originate. Such stochastic factors could lead to marked variation in com-munity composition, and consequently to variation in taxa-function robustness. However, the similarity in ro-bustness within a similar environment or subsite com-pared to between-environment robustness differences suggests that some of this observed variation may be se-lected for and that selection for robustness varies across environments. Selective pressure for robustness could vary based on the relative needs for consistency versus
plasticity in community function when communities re-spond to changing environmental conditions or based on how consistent the environment might be. Indeed, community-level functional plasticity could be driven by changes in the metabolism or behavior of individual mi-crobes in response to environmental changes, but could also be achieved by shifts in community composition that modulate the community functional profile in a desired direction. Indeed, noticeable alterations to taxo-nomic composition often accompany large environmen-tal changes, such as in the gut microbiota following diet
switches [47], in skin communities during and after
atopic dermatitis flares [48], or in the vaginal
micro-biome during pregnancy [49], and in certain cases these
composition alterations have also been associated with
changes in community functional capacities [50, 51]. In
such cases, lower taxa-function robustness may be se-lected to enable plasticity in community function, thereby allowing community function to adapt to a changing environment.
Notably, there are a few caveats to our taxa-function robustness estimation approach. First, the simulation-based perturbation method we used was fairly simple and restricted perturbations to only modify the abun-dances of present microbes without considering the pos-sible addition of novel microbes, e.g., via migration. In reality, the underlying taxa-function landscape depends not only on the taxa that are present in a community but also on the taxa that could be introduced to the community from an environmental reservoir or trans-ferred from some other source. Yet, the correspondence between our robustness estimates and the observed taxonomic and functional shifts in real communities suggests that the local topology of the taxa-function landscape around a community may be relatively similar when considering the possible influx of new taxa. Beyond the simulation-based perturbation method, our robustness calculations also depend on community func-tional profile prediction via a database of annotated mi-crobial genomes. These predicted functional profiles may not accurately reflect the true functional profile of the community or variation between communities. For example, our analyses above have considered community members at the species level, ignoring potential
strain-level variation [52]. While our taxa-function mapping
unannotated or deflated if certain functions are actually highly redundant but missing from some genome anno-tations. It is worth noting, however, that despite these caveats, our robustness estimates were shown to agree with differences in taxonomic and functional profiles be-tween naturally occurring community compositions, both across communities and over time.
Conclusions
Our analysis of simulated community perturbations indi-cates that taxa-function robustness of microbial commu-nities varies by environment, though subsites from within a given environment tend to share similar taxa-function robustness signatures. Furthermore, taxa- function-specific robustness at the pathway level is associated with the universality of the pathway, with microbial housekeeping pathways displaying higher robustness
than pathways associated with more specialized
lifestyles. Interestingly, the variation in the robustness of a pathway across communities was not associated with differences in pathway abundance. We also found that environment-specific characteristics of gene distribution
across community member genomes account for
between-environment differences in taxa-function
robustness and suggest potential drivers for functional ro-bustness. Finally, a comparison between simulation-based robustness estimates and metagenome-based taxonomic and functional shifts suggested that our robustness esti-mates agree with observed community dynamics.
Importantly, the applications for computational ro-bustness estimation could extend beyond the analyses and results presented here. Function-specific robustness estimation, for example, could inform the analysis of novel communities from a particular environment, highlighting functions whose capacities are more or less robust than expected. Taxa-function robustness estima-tion could also be incorporated into the construcestima-tion of synthetic microbial communities to inform the design of more resilient community compositions. As we further explore and analyze the temporal dynamics of microbial community structure and function, being able to deter-mine how and why robustness varies will continue to be of interest.
Methods
Samples and data processing
The samples were obtained from the Human
Microbiome Project [36] and the Earth Microbiome
Project [37]. 16S rRNA-based operational taxonomic
unit (OTU) tables and metadata files were downloaded
from the QIITA website (http://qiita.microbio.me),
which provides OTU tables generated with the QIIME
workflow [53] using Greengenes OTUs [54]. OTU tables
were filtered to remove read counts mapped to plant
chloroplasts. To improve quality and comparability be-tween taxonomic profiles, taxonomic profiles with fewer than 10 OTUs or fewer than 5000 reads were removed and the remaining taxonomic profiles were rarefied to 5000 reads. When analyzing body subsites, left and right bilaterally symmetric body subsites (antecubital fossa or retroauricular crease) were pooled together. For each subsite, communities were selected from different hosts. The resulting number of communities after each step in the filtering process and the final set of communities
can be found in Additional file13: Table S5.
Functional profile prediction
The Kyoto Encyclopedia of Genes and Genomes (KEGG)
[55, 56] was used to define orthologous gene functions
in terms of KEGG Orthology (KO) groups. KO
abun-dances were predicted using PICRUSt [13] tables to first
normalize each OTU’s relative abundance by its 16S
rRNA copy number and then infer KO abundance from the genomic content of each OTU. KO abundances were then normalized using inter-sample MUSiCC. Pathway-level functional summaries, as defined by the KEGG
BRITE hierarchy [57], were obtained by evenly
distribut-ing each KO’s average copy number across all pathways
that contain that KO. Both KO and pathway tables were filtered to remove non-bacterial orthologs.
Taxonomic composition perturbation
Community taxonomic composition perturbations were designed to simulate stochastic OTU relative abundance fluctuations (assuming no migration or introduction of OTUs absent in the original community). Perturbation size for each OTU was proportional to the abundance of
that OTU. Formally, for a given community with N
OTUs with non-zero relative abundances,ai∀i∈1, 2,…,
N, perturbation multipliersmi∀i∈1, 2,…,Nwere
sam-pled from a uniform distribution over the interval (0,
M],M being the maximum perturbation magnitude, and
perturbation directions di were chosen such that di∈
{−1, 1}∀i∈1, 2,…,Nwith an equal chance of either dir-ection. Given these values, the perturbed taxonomic
composition OTU abundances pi∀i∈1, 2, …, N were
calculated as
pi¼aimdi i
and then renormalized such that PNi pi¼1 . Using this
Perturbation magnitude calculations
Changes in taxonomic composition between an original community composition and a perturbed composition
were measured using the weighted UniFrac metric [58],
a common, phylogeny-aware metric for estimating dis-similarity between microbial community compositions.
The shift in a community’s functional profile was defined
as the cosine dissimilarity between the original and per-turbed functional profiles, as done in [59]. Specifically, given an original community and perturbed community
withNunique pathways with average copy numberaj∀
j∈1, 2,…,Nandbj∀j∈1, 2, …, N, respectively, the
co-sine dissimilarity between the two functional profiles is
1−
PN
jajbj ffiffiffiffiffiffiffiffiffiffiffiffiffi
PN
ja2j
q ffiffiffiffiffiffiffiffiffiffiffiffiffiP
N jb
2
j
q :
Robustness metric definition and fitting
For this study, the taxa-function robustness of a micro-bial community is defined as the average shift in the functional profile given a perturbation to the
commu-nity’s taxonomic composition. To allow quantitative
ro-bustness comparisons between communities, we assume that the relationship between taxonomic perturbation magnitude and functional profile shift behaves as
f ¼ 1
eat b
where t denotes the magnitude of the taxonomic per-turbation,fdenotes the expected shift in functional pro-file, and a and b are community-specific coefficients. We term this function the taxa-function response curve. We further term the coefficient a attenuation since it describes the expected rate at which increases in the taxonomic perturbation magnitude are expected to in-crease functional profile shifts. We similarly term the ex-ponent b buffering since it indicates how large a perturbation must be before a functional profile shift be-comes noticeable and approaches the expected shift magnitude defined by attenuation. Other models to describe the relationship were tested, but the model pre-sented here provided the best explanation of the taxo-nomic and functional dissimilarity relationship across all communities (Additional file 1: Supplementary Text; Additional file2: Figure S1; Additional file14: Table S6). Function-specific robustness was defined in a similar manner to taxa-function robustness except that instead of the cosine dissimilarity between the original and per-turbed functional profiles, the functional shift of a single function was measured as the relative change in the abundance of that function.
Attenuation and buffering were fit by first transform-ing weighted UniFrac and cosine dissimilarities to the natural log scale to reduce heteroscedasticity observed in the simulated perturbation data (variance of cosine dissimilarity increased as weighted UniFrac distance in-creased). A uniform sampling of simulated perturbations across weighted UniFrac dissimilarities was obtained by subsampling perturbations across 50 non-overlapping windows evenly spaced on the natural log scale between minimum and maximum distances. For each commu-nity, in each window, perturbations were subsampled to
50 when≥50 perturbations were present and all
pertur-bations were kept when < 50 were present. The trans-formation to the natural log scale also transformed the proposed taxa-function robustness curve function to the following form:
lnð Þ ¼f −aþb lnð Þt
which was then fit using the linear least-squares best fit to calculate attenuation and buffering.
Due to the asymmetric distributions of attenuation and buffering, the pseudomedian was used rather than the median and pseudomedian attenuation and buffering estimates were calculated using the Hodges-Lehmann
statistic [60]. The 95% confidence interval for a
pseudo-median estimate was calculated as the range of values for which the Wilcoxon statistic (given the observed at-tenuation or buffering values) was between the 0.025 and 0.975 quantiles of the standard normal distribution.
Function-specific most robust environment determination
A function was determined to be most robust in a par-ticular environment (or environments) by comparing the median attenuation of that function across all
environ-ments using Mood’s Median test. Specifically, a function
was defined as most robust in a set of environments if, for each environment in that set, the median attenuation of the function in that environment was both signifi-cantly higher than its median attenuation in all of the environments not in the set and not significantly differ-ent than its median attenuation in any of the other envi-ronments in the set.
OTU subsampling procedure
To determine the relationship between diversity and ro-bustness when comparing vaginal and gut communities, we subsampled communities from each environment to obtain similar species richness and repeated our analysis of between-environment robustness differences. Specific-ally, each community was randomly subsampled to 10 OTUs such that the probability of an OTU remaining in the subsampled community was proportional to its
subsampling procedure aimed to achieve a similar distri-bution of relative abundance among community members between the original and subsampled communities. Once subsampled, OTU abundances were renormalized.
Gene distribution feature (GDF) definitions
As noted above, the five main gene distribution features (GDFs) used in the correlation and PCA analysis were average functional redundancy, average functional simi-larity, average genome size, genome size variability, and unique function abundance. Each GDF captures a differ-ent, though potentially related, aspect of the distribution of genes across the genomes of species in a community.
The functional redundancy of a given function was
de-fined here as the evenness (Shannon’s diversity index) of
the abundances of each species that encodes that func-tion weighted by the copy number of the funcfunc-tion in
each species’genome respectively:
−XN i¼1
sici
ð Þ lnð Þsici
½
where Nspecies encode a function, si is the abundance of speciesithat encodes that function, andciis the copy number of that function in speciesi’s genome. This def-inition aims to capture how evenly species contribute to a function’s abundance, such that a function should be considered less redundant if one species contributes the majority of that function’s abundance while it will be more redundant if many species all contribute similarly to its abundance. The average functional redundancy of a community was then defined as the average of all func-tions present in a community, weighted by the relative abundance of each function in the community’s func-tional profile.
The functional similarity between two microbes aimed to capture how well two different species could compen-sate functionally for one another, and thus was defined as the cosine similarity between the functional profiles of two species:
PM i¼1aibi ffiffiffiffiffiffiffiffiffiffiffiffiffiffiffi
PM
i¼1a2i
q ffiffiffiffiffiffiffiffiffiffiffiffiffiffiffiP
M i¼1b2i q
whereMis the number of functions encoded by at least one of the species,aiis the copy number of functioniin speciesa, andbiis the copy number of functioniin spe-cies b. The average functional similarity within a com-munity was then defined as the unweighted average of all pairwise functional similarities between species present in the community.
Genome size for a given species was defined as the total abundance of functions encoded by the species (i.e., the sum of the copy number of each function in that
species genome). Average genome size was calculated as
the unweighted average of each species’genome size and
genome size variability was calculated as the coefficient of variation of species genome size.
Unique function abundance was defined as the total abundance of functions in a community’s functional profile that are each encoded by a single species (though each unique function need not be encoded by the same species).
Metagenome-based data and functional shifts
Shotgun metagenome-based KO profiles for 94 communi-ties were obtained from HMP. KO profiles were corrected
using inter-sample MUSiCC [61] and summarized to the
pathway level using the same protocol used for predicted profiles. To obtain shotgun metagenome-based functional profile differences, 47 random community pairs were assigned from the 94 communities with both 16S rRNA and shotgun metagenome profiles. Pairs were restricted to contain two communities from the same subsite. Between-community taxonomic and functional dissimilar-ities were calculated (as described above) between the communities in each pair.
Mixed community perturbations
Community mixing was performed using the same com-munity pairs as for metagenome-based functional shift measurements. For each pair, one community was desig-nated the original community and the other the mixing
community. For a taxon iwith abundance aiin the
ori-ginal community and abundance bi in the mixing
com-munity, taxon i’s abundance in the mixed community
perturbation (relative to the original community) with mixing fractionmwas [ai(1−m)] + [bim]. Similarly, for a
function j with average copy number cj in the original
community and average copy number dj in the mixing
community, function j’s abundance in the mixed
com-munity perturbation (relative to the original comcom-munity) with mixing fraction m was [cj(1−m)] + [djm]. Mixed
community perturbations were generated at specific weighted UniFrac dissimilarities by using a binary search to identify the mixing fraction that achieved a mixed community perturbation with the desired weighted Uni-Frac dissimilarity from the original community within a
tolerance of 10−9. To fit robustness curves for the