T E C H N I C A L A D V A N C E
Open Access
Conversion of a molecular classifier obtained by
gene expression profiling into a classifier based
on real-time PCR: a prognosis predictor for
gliomas
Satoru Kawarazaki
1,2, Kazuya Taniguchi
1, Mitsuaki Shirahata
2, Yoji Kukita
1, Manabu Kanemoto
1,2, Nobuhiro Mikuni
2,
Nobuo Hashimoto
3, Susumu Miyamoto
2, Jun A Takahashi
4, Kikuya Kato
1*Abstract
Background:The advent of gene expression profiling was expected to dramatically improve cancer diagnosis. However, despite intensive efforts and several successful examples, the development of profile-based diagnostic systems remains a difficult task. In the present work, we established a method to convert molecular classifiers based on adaptor-tagged competitive PCR (ATAC-PCR) (with a data format that is similar to that of microarrays) into classifiers based on real-time PCR.
Methods:Previously, we constructed a prognosis predictor for glioma using gene expression data obtained by ATAC-PCR, a high-throughput reverse-transcription PCR technique. The analysis of gene expression data obtained by ATAC-PCR is similar to the analysis of data from two-colour microarrays. The prognosis predictor was a linear classifier based on the first principal component (PC1) score, a weighted summation of the expression values of 58 genes. In the present study, we employed the delta-delta Ct method for measurement by real-time PCR. The predictor was converted to a Ct value-based predictor using linear regression.
Results:We selectedUBL5as the reference gene from the group of genes with expression patterns that were most similar to the median expression level from the previous profiling study. The number of diagnostic genes was reduced to 27 without affecting the performance of the prognosis predictor. PC1 scores calculated from the data obtained by real-time PCR showed a high linear correlation (r = 0.94) with those obtained by ATAC-PCR. The correlation for individual gene expression patterns (r = 0.43 to 0.91) was smaller than for PC1 scores, suggesting that errors of measurement were likely cancelled out during the weighted summation of the expression values. The classification of a test set (n = 36) by the new predictor was more accurate than histopathological diagnosis (log rank p-values, 0.023 and 0.137, respectively) for predicting prognosis.
Conclusion:We successfully converted a molecular classifier obtained by ATAC-PCR into a Ct value-based predictor. Our conversion procedure should also be applicable to linear classifiers obtained from microarray data. Because errors in measurement are likely to be cancelled out during the calculation, the conversion of individual gene expression is not an appropriate procedure. The predictor for gliomas is still in the preliminary stages of development and needs analytical clinical validation and clinical utility studies.
* Correspondence: [email protected]
1
Research Institute, Osaka Medical Center for Cancer and Cardiovascular Diseases, 1-3-3 Nakamichi, Higashinari-ku, Osaka, 537-8511, Japan Full list of author information is available at the end of the article
Background
Since the inception of gene expression profiling, researchers have sought to use this technology to improve the diagnosis of diseases, especially cancers. Recently, MammaPrint [1,2] and Oncotype DX [3,4] were established as diagnostic tests based on multiple gene assays for breast cancer. Despite the success of these diagnostic tests, the development of assays for gene expression profiling is still difficult. In particular, there have been few examples of microarray-based diag-nostic tests, although microarrays are frequently used as a discovery tool. One reason for the paucity of microar-ray-based diagnostic tests is that DNA microarrays require considerable effort to achieve the level of techni-cal refinement necessary for diagnostic practice. On the contrary, real-time PCR is stable and robust and is fre-quently used for diagnosis. Because there are many stu-dies describing the use of microarrays at the discovery phase, a convenient method to convert a microarray-based algorithm into one microarray-based on real-time PCR would help to accelerate the development of diagnostic systems based on gene expression profiling.
Previously, we performed gene expression profiling of 152 glioma tissues [5] with a high-throughput quantita-tive PCR technique called adaptor-tagged competiquantita-tive PCR (ATAC-PCR) [6,7]. ATAC-PCR is an advanced version of quantitative competitive PCR characterised by the addition of unique adaptors for different cDNAs. A single ATAC-PCR reaction includes five cDNA ples and two different amounts of a control cDNA sam-ple with different adaptor tags, and it measures the relative expression of the samples against that of the control. We discovered a correlation between gene expression profiles and glioma prognosis, and we devel-oped a prognosis predictor based on a 58-gene profile [5]. The performance of the predictor based on ATAC-PCR was cross-validated with a learning set of 110 glioma samples and validated with a test set of 42 sam-ples. Cox regression analysis revealed that the correla-tion between the predictor and the prognosis was superior to that of histological classification and was an independent risk factor. The current prognostic stan-dard, the histopathological classification system, is lim-ited in its diagnostic accuracy, and prognoses range widely even within the same grade. Diagnosis depends on individual pathologists, and the results are often dis-cordant among multiple pathologists [8]. The perfor-mance of the prognosis predictor based on ATAC-PCR indicated that this predictor held promise for the sup-port of conventional histopathological classification. Our classifier is also expected to bring benefits in the clinical setting for personalized management of glioma patients. For example, various molecular-targeted drugs have recently been evaluated in clinical trials for gliomas.
These novel treatments should be considered for tumours that are resistant to conventional chemora-diotherapy. Yet, it is important to avoid using such a therapy for tumours that are sensitive to conventional chemoradiotherapy, based on the cost and adverse effects associated with this technique. Considering ele-vated expression of angiogenesis-related genes in the poor prognosis group, [5], our classifier might be useful for selection of patients for anti-VGEF agents.
In the present study, we converted the conventional predictor to one based on real-time PCR. This new pre-dictor is based on the delta-delta Ct method [9] and requires only the measurement of the cycle threshold (Ct) of diagnostic genes. For the conversion, we first identified a reference gene for real-time PCR. Then we constructed the parameters for the conversion formula using data obtained from the learning set, which was used to construct the original classifier. Finally, the new classifier was validated with a test set. Because there is a linear correlation between microarray data and Ct values [10], the conversion process could be applicable for clas-sifiers based on microarrays.
Methods
Patients and tumour samples
Specimens excised from 80 patients with high-grade glioma (69 cases of glioblastoma and 11 cases of ana-plastic astrocytoma) at Kyoto University Hospital or nearby regional hospitals between 1998 and 2008 were stored at -70°C until use. All histological diagnoses were performed in the Kyoto University Pathology Unit according to the 2000 or 2007 WHO classifications.
Sixty of the 80 samples were recruited from those used in the previous study [5]. They were collected from patients enrolled in a phase II clinical trial using nimus-tine, carboplatin, vincrisnimus-tine, and IFN-b with radiother-apy for high-grade gliomas (the KNOG study) [11]. The remaining 20 patients were treated with temozolomide and radiotherapy. The learning set included 44 samples (43 glioblastoma, 1 anaplastic astrocytoma) from the KNOG study. Recurrence was detected in 36 of the 44 patients and their median progression-free survival was 7 months. The test set included 36 samples (26 glioblas-toma and 10 astrocyglioblas-toma). Twenty-three of the 36 patients showed tumour progression, and their median progression-free survival was 8 months.
Institutional approval for this study was obtained from the Institutional Review Board of Kyoto University, and informed consent was obtained from all patients prior to surgery.
RNA extraction and cDNA synthesis
according to the manufacturer’s instructions. RNA con-centrations and A260/A280 ratios were measured using a NanoDrop ND-1000 (NanoDrop Technologies, Mon-tchanin, DE, USA). Only RNA samples with A260/A280 ratios above 1.90 were included in the study. RNA integrity was confirmed by analysis with the Agilent 2100 bioanalyser.
After DNase treatment, 5 μg of total RNA in 10μl of distilled water was incubated with 1μl of oligo(dT) pri-mer for 5 min at 70°C. Total RNA was reverse tran-scribed in a total volume of 20μl containing 4μl of 5× first strand buffer, 1μl of RNase inhibitor (Invitrogen), 2 μl of 0.1 M DTT, 0.5μl of 20 mM dNTP and 1 μl of SuperScript III Reverse Transcriptase (Invitrogen). The samples were incubated at 45°C for 1 hr. Next, a reac-tion mixture (total volume of 103 μl) containing 10 μl of 10×Escherichia coli(E. coli) ligation buffer, 2 μl of 20 mM dNTPs, 2 μl of 0.1 M DTT, 2 μl of E. coli ligase (Invitrogen), 1μl of RNase H (Invitrogen), 4μl ofE. coli
DNA polymerase (Invitrogen) and 82μl of nuclease-free water was added. The resulting reaction mixture was incubated at 16°C for 120 min and then at 70°C for 20 min. The reaction mixture was then diluted five-fold with nuclease-free water and stored at -30°C until RT-PCR analysis.
Primer design and optimisation
Gene sequences were retrieved using the UCSC Genome Bioinformatics http://genome.ucsc.edu/ program, and primers sequences were designed using Primer3Plus http://www.bioinformatics.nl/cgi-bin/primer3plus/pri-mer3plus.cgi. Specific interactions between primers and target genes were confirmed using either NCBI BLAST http://blast.ncbi.nlm.nih.gov/Blast.cgi) or BlastView (http://uswest.ensembl.org/index.html. The specificity of the expected RT-PCR products was determined based on melting curve analyses of reactions with glioma cDNA and human cDNA libraries. The product-specific melting curves showed only single peaks and no primer-dimer peaks or artefacts.
Quantitative real-time reverse transcription-PCR
Quantitative PCR amplification assays were performed by a SYBR Green fluorescent assay using the ABI PRISM 7500 real-time PCR sequence detection system (Applied Biosystems, Foster City, CA, USA). Reactions were performed in a 96-well plate with 20-μl reaction solutions containing SYBR Premix Ex Taq II (10 μl) (Takara Bio., Inc., Japan), ROX reference dye II (0.4μl), 10 μM forward and reverse primers (0.8 μl), 1 μl of cDNA template, and nuclease-free water (7μl). Cycling conditions included an initial denaturation for 10 sec at 95°C, followed by 40 cycles of 5 sec at 95°C and 34 sec at 60°C. For determination of the reference gene, a
standard curve was generated for each assay using seven serial dilutions of an amplified human brain cDNA library ranging from 20 ng to 20 fg.
The delta-delta Ct method was employed for the diag-nostic assays. Ct values were calculated following the manufacturer’s instructions (Applied Biosystems, Foster City, CA, USA), using UBL5 as the internal reference. The diagnostic genes fulfilled the criterion that the absolute value of the slope of the log input amount vs.
ΔCt should be < 0.1.
Data analysis
Thirty primers for the selected gene candidates and for the internal and negative controls were added in tripli-cate to 96-well plates, and the samples were measured using one plate per sample. The negative controls showed no detectable amplification or background levels of amplification (Ct≥ 37, compared with 16 to 31 with sample DNAs). The mean and the standard deviation of differences of Ct values between duplicates were 0.060 and 0.086, respectively. Sequence detection software (Applied Biosystems) results were exported as tab-delimited text files and imported into Microsoft Excel for further analysis.
Statistical data processing was performed using Excel and SPSS, and Pearson’s correlation coefficients (r) were computed for each cross-platform comparison. Progres-sion-free survival was measured from the day of surgery to the time of the first event of progression or to the last day of follow-up, according to the Kaplan-Meier method. Curves were compared using the log-rank test.
Results and Discussion
Selection of the reference gene
We chose the delta-delta Ct method [9] for real-time PCR measurement rather than using calibration curves. Although the delta-delta Ct method has stricter require-ments, it can substantially reduce the number of PCR reactions.
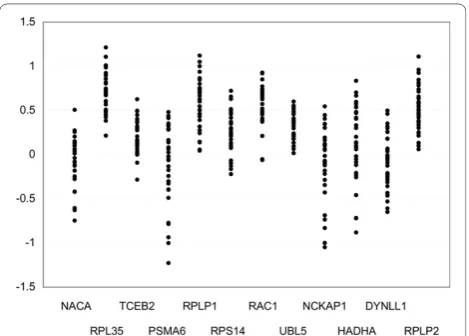
glioma samples. To select the best reference gene, the expression levels of the twelve genes were measured in 32 glioma samples using real-time PCR. The results are shown in Figure 1. Gene expression values are influ-enced by the amount of mRNA and the random varia-tion caused by biological and experimental factors [13]. Because variation in the amount of mRNA was common to all of the genes, the difference in measurement was primarily due to the latter. The measurement ofUBL5
had the smallest variation; therefore, we selected it as the reference gene. Although the use of multiple refer-ence genes is recommended by several reports [13,14], we chose a single reference gene for this case because the use of multiple reference genes would increase var-iations in measurement.
The first prognosis predictor developed for gliomas was based on the expression of 58 genes [5]. For the delta-delta Ct method, the amplification efficiency of a gene must be approximately equal to that of the refer-ence gene. We performed real-time PCR amplification and fulfilled this criterion for 30 of the 58 genes. The original prognosis predictor classified gliomas into good and poor prognosis groups. The diagnostic scores calcu-lated with the original 58 genes and the 30 genes chosen in this study had a high correlation (r = 0.95), and there was no difference between the classification results in the test set and those in the previous study [5]. There-fore, we decided to proceed with the 30 genes. A list of the genes and primer sequences is shown in Table 1.
Strategy for conversion
In our previous report of gene expression profiling of gliomas [5], we measured the relative expression levels against a control sample. Because the Ct value is inver-sely proportional to the amount of target nucleic acid
present in the sample, the relative expression level of geneiof samplex, eri(x), is described as follows:
er xi( )= +(1 E)−(Ct xi( )−Ct ci( ))
Here, Cti(x)andCti(c)are the Ct values of gene i of
sample xand of the control sample, respectively.“1+E“
represents the amplification efficiency of the real-time PCR, where 0≤E ≤1. The log-normalised gene expres-sion,eni(x), is obtained by the following conversion:
en x er x er x
E Ct x Ct x
i i UBL
i UBL
( ) log( ( ) / ( ))
log( ) ( ( ) ( ))
= = − + ∗ − + 5 5 1
llog(1+E) (∗ Ct ci( )−CtUBL5( ))c
Linear classifiers are most commonly used for molecu-lar classification by gene expression profiles; an example is MammaPrint [2]. With a linear classifier, the diagnos-tic score is the sum of the normalised expression values multiplied by a coefficient determined from the learning data set. The diagnostic score of the prognosis predictor, the PC1 score, is described with Ct values as follows:
PC x a en x
E a Ct x Ct x
i i i n i i n i UBL 1 1 1 1 5 ( ) * ( )
log( ) *( ( ) ( ))
= = − + ∗ − = =
∑
∑
++ + ∗ − =∑
log(1 ) *( ( ) ( ))
1
5
E ai Ct c Ct c
i n
i UBL
Here, PC1(x) is the PC1 score of sample x. “ai“ is a
constant determined from the learning set in the pre-vious study [5].“n“ is the number of diagnostic genes.
PC1(x) is alternatively described as follows, defining
PC1rt(x) as the PC1 score of sample x measured by
real-time PCR.
PC x1( )=1∗PC1rt( )x +0
Here,PC1rt(x),b1 andb0are as follows:
PC x a Ct x Ct x
E E rt i i n i UBL 1 1 1 1 5 1 0 ( ) ( ( ) ( )) log( ) log( ) = ∗ − = − + = + =
∑
∗∗ ∗ − =∑
ai Ct c Ct ci n i UBL 1 5 ( ( ) ( ))
Because the PC1(x) value of the learning set was already determined,b1 andb0 can be determined by
lin-ear regression through measurement of Cti(x) and
CtUBL5(x)of the corresponding samples. The conversion
formula would then be validated with the test set. It should be noted that this method does not require the use of a control sample (i.e., measurement of Cti(c)and
CtUBL5(c)).
Construction of the prognosis predictor based on real-time PCR
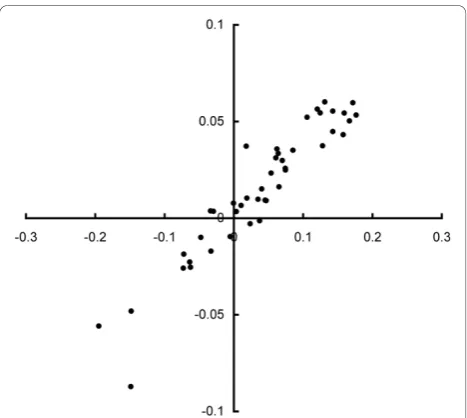
Using 44 samples from the learning set, we determined
PC1rt(x)by measuring the Ct values. As expected, there
was a high linear correlation betweenPC1(x)andPC1rt
(x)(r= 0.94), as shown in Figure 2.
We then measured the correlation in individual gene expression (Table 2) between the ATAC-PCR data (log-normalised) and theΔCtvalues (ΔCt(x) = Cti(x)-CtUBL5
(x)). The correlation for individual genes was less robust than that for the PC1 score: the correlation coefficients ranged from 0.6 to 0.9. These results suggest that the PC1 score could eliminate errors in measurement
through the weighted averaging of gene expression. Because three genes (VMP1, TNC and RHOC) exhibited no correlation, we eliminated them from the diagnostic gene set. Because ATAC-PCR uses a single gene-specific primer designed for the 3’end of the mRNA, it may be less specific than conventional PCR using two primers. The absence of correlation may be due to the amplifica-tion of different genetic fragments or splicing variants. The parameters of the conversion formula were deter-mined by linear regression (b1, -0.37:b0, -0.002).
Specific features of the expression of each gene may be obtained from the regression coefficient and inter-cept. Because the ATAC-PCR data were converted to a common logarithm during normalisation, the regression coefficient should be somewhere between zero and 0.30 (= log102). In reality, the values ranged from 0.2 to 0.43,
and ten genes demonstrated values exceeding 0.30. These results suggest a substantial degree of discrepancy between measurements obtained with ATAC-PCR and
Table 1 Primer sequences of the diagnostic genes
Gene Symbol Forward Reverse
IGFBP2 GCACATCCCCAACTGTGACA TTCAGAGACATCTTGCACTGTTTG
VMP1 TGTCTTCTGTTGGGCTTGGAA TGAGGCTATATGTGGACCCAGATA
MSN GCCCCGGACTTCGTCTTC AGGCCAAGATCCGCTTGTTA
TIMP1 CACAGACGGCCTTCTGCAAT TGGTGTCCCCACGAACTTG
LGALS1 CTCCTGACGCTAAGAGCTTCGT GAAGTGCAGGCACAGGTTGTT
CD63 CCCGAAAAACAACCACACTGC GATGAGGAGGCTGAGGAGACC
NES CAACAGCGACGGAGGTCTC CCTCTACGCTCTCTTCTTTGAGT
CLIC1 TGTTCATGGTACTGTGGCTCAAG GTCCGCCTTTTGGTGTCAAC
TNC ACCACAATGGCAGATCCTTC GCCTGCCTTCAAGATTTCTG
TAGLN2 CCTCTGGGAAGGAAAGAACATG AGCCCACCCAGATTCATCAG
HES6 GACCAATGCCAGCCAGAG GCAAGCCATCCATCAGAGG
VEGF CCAAGGCCAGCACATAGGA TCTTTGGTCTGCATTCACATTTG
VIM TCCAAACTTTTCCTCCCTGAAC GGGTATCAACCAGAGGGAGTGA
LDHA CTGGGAGTTCACCCATTAAGCT CAGGCACACTGGAATCTCCAT
RPIP8 CCCCCGTGGTCATCGA GGTAGTCGTAGCTCTGCGTGAA
IFITM3 GGCTTCATAGCATTCGCCTACT TCACGTCGCCAACCATCTT
PPIB GGAGAGAAAGGATTTGGCTACAAA CCTGGATCATGAAGTCCTTGATT
ALDOC CGTCCGAACCATCCAGGAT CCACACCCTTGTCAACCTTGAT
ZYX CAGCAGCTAATGCAGGACATG CAGAGTTCGTTGACAGCCACAT
UPAR GTGTGTGGGTTAGACTTGTGCAA AGGTAACGGCTTCGGGAATAG
LAMB2 CCACTGAAGGCGAGGTCATC CCCGTAGGTTGGTGATCTTCAA
RTN1 CCGCATCTACAAGTCTGTTTTACAA AAGCTCCAAGTAGGCCTTGAAAG
HMOX1 GGCAGAGAATGCTGAGTTCATG AGGCCATCACCAGCTTGAAG
GM2A GTCCCCCTGAGTTCTCCTCT GCTCTTGGGCAGTGAGTAGG
S100A10 TGGAAAAGGAGTTCCCTGGAT TACACTGGTCCAGGTCCTTCATT
BRSK2 GGAGGAGATGTCCAACCTGACA AAGTTCCCAAACCAGGACTTCTT
MRCL3 AACAGAGATGGTTTCATCGACAAG GTTGGATTCTTCCCCAATGAAG
GPX1 GCGGGGCAAGGTACTACTTA CTCTTCGTTCTTGGCGTTCT
SOD2 AATCAGGATCCACTGCAAGGA CGTGCTCCCACACATCAATC
RHOC AATAAGAAGGACCTGAGGCAAGAC ACGGGCTCCTGCTTCATCT
those determined using real-time PCR. The intercept indicates the general expression level of the gene; high intercept values indicate low levels of gene expression. With the exception ofVMP1, the expression levels of the diagnostic genes were within two orders of magni-tude of each other. The expression level ofUBL5was in the middle range of all of the diagnostic genes.
Validation of the converted predictor
The converted predictor with 27 genes was validated with an additional sample set consisting of 16 samples from the previous test set [5] and 20 new samples. The samples were from anaplastic astrocytoma (grade III) or glioblastoma (grade IV). The PC1 score (PC1(x)) of each sample was calculated usingΔCtvalues measured using real-time PCR. The samples were classified into two prognosis groups with the threshold value set at zero, which was the threshold used in our previous study [5]. The performance of the classification was compared to conventional histopathological diagnosis. To have clini-cal utility, the predictor must have a classification ability superior to that of histopathological classification. The results of the Kaplan-Meier plot from the 36 samples revealed that the molecular classification was superior to histopathological diagnosis (log rank p-values, 0.023 and 0.137, respectively) (Figures 3A, B). The hazard ratio was 2.70 (95% confidence interval, 1.05-6.92) (p = 0.039) for molecular classification. No significant hazard ratio was obtained with histopathology (p = 0.16). We also noted that the classification results for the 16 samples from the original test set were the same as those pre-viously obtained by ATAC-PCR. Thus, the new
predictor based on real-time PCR is comparable to the previous predictor based on ATAC-PCR.
Further considerations
In the delta-delta Ct method, the selection of the reference gene is the most important technical point. It has been fre-quently noted that housekeeping genes are not necessarily adequate for use as reference genes [14,15] because of their variable expression levels. Although it is possible to use a combination of housekeeping genes [14], a reference gene or a set of reference genes selected from the expres-sion data matrix of the target tissues is more desirable because the measurement of other tissues is not per-formed in diagnostic practice. We selected a reference gene from a set of genes exhibiting expression patterns that were similar to the median gene expression pattern for the glioma data. Alternative methods to select refer-ence genes should also be applicable to the conversion method described here [13,16].
Table 2 Parameters for correlation between ATAC-PCR and real time PCR
gene name
correlation coefficient
regression coefficient
intercept
IGFBP2 0.90 0.27 0.32
VMP1 0.04 0.05 2.87
MSN 0.81 0.36 1.00
TIMP1 0.92 0.30 -0.31
LGALS1 0.85 0.36 -0.56
CD63 0.51 0.20 -0.52
NES 0.69 0.26 0.69
CLIC1 0.86 0.43 0.34
TNC 0.04 -0.02 -0.63
TAGLN2 0.66 0.34 0.13
HES6 0.77 0.29 0.60
VEGF 0.78 0.25 -0.11
VIM 0.77 0.30 -0.52
LDHA 0.73 0.33 -0.12
RPIP8 0.81 0.26 0.71
IFITM3 0.85 0.38 -0.75
PPIB 0.60 0.29 -0.10
ALDOC 0.73 0.28 -0.09
ZYX 0.68 0.36 0.54
UPAR 0.84 0.36 1.48
LAMB2 0.43 0.23 0.62
RTN1 0.82 0.29 0.66
HMOX1 0.87 0.30 0.62
GM2A 0.51 0.24 0.62
S100A10 0.79 0.28 -0.18
BRSK2 0.68 0.22 1.21
MRCL3 0.73 0.30 0.38
GPX1 0.70 0.33 -0.41
SOD2 0.74 0.31 0.23
RHOC 0.11 -0.08 -0.06
In the present study, the original classifier was devel-oped from gene expression data obtained by ATAC-PCR. Our conversion method is based on the linear cor-relation between gene expression profiling data andΔCt
values. A linear correlation was observed between nor-malised microarray data and ΔCt values regardless of
the normalisation procedure [17]. Thus, our method should also be applicable to linear classifiers obtained using microarrays. As described above, the correlation between diagnostic scores is higher than that between individual genes. As demonstrated by diagnostic tests for breast cancer, the scores calculated from multiple gene expression correlate with the biology (malignancy) much better than individual gene expression, which includes noise of biological and experimental origin. The higher correlation of diagnostic scores between the two PCR techniques is not surprising. This result sug-gests that the conversion should be performed with the diagnostic score; it is not appropriate to perform the conversion at the level of individual gene expression.
It should be noted that validation experiments were performed only for the conversion process and that the predictor itself is in the preliminary stages of develop-ment and still needs analytical clinical validation and clinical utility studies. In particular, because the original predictor may also be applicable for the prognosis pre-diction of grade II gliomas [5], the future cohort should include a large number of grade II gliomas. In grade II and III glioma patients, the optimal timing of radiation therapy is still controversial [18,19]. Precise risk assess-ment, including the ability to predict possible malignant transformation, may be useful for timing decisions and is the most promising feature of the new classification scheme.
Conclusions
We successfully converted a molecular classifier obtained by ATAC-PCR into a Ct value-based classifier. Our conversion procedure should also be applicable to linear classifiers developed from microarray data. Because errors in measurement are likely to be cancelled out during the calculation, the conversion of individual gene expression data is not an appropriate procedure. The predictor for gliomas is still in the preliminary stages of development and requires analytical clinical validation and clinical utility studies.
Acknowledgements
The authors thank Dr Shigeyuki Oba for advice on statistical analysis.
Author details
1Research Institute, Osaka Medical Center for Cancer and Cardiovascular
Diseases, 1-3-3 Nakamichi, Higashinari-ku, Osaka, 537-8511, Japan.
2Department of Neurosurgery, Kyoto University Graduate School of Medicine,
54 Kawahara-cho, Shogoin, Sakyo-ku, Kyoto-shi, Kyoto, 606-8507, Japan.
3National Cerebral and Cardiovascular Center, 5-7-1 Fujishiro-dai, Suita, Osaka
565-8565, Japan.4Kitano Hospital. 2-4-20 Ohgimachi, Kita-ku, Osaka,
530-8480, Japan.
Authors’contributions
KK conceived and designed the study. SK performed the experimental work following advice from KT and YK. Statistical analysis was done by KK, MS and MK. MS, NM, NH, SM and JT recruited the glioma patients and were
responsible for the clinical aspects of the study. KK and SK wrote the manuscript. All authors have read and approved the manuscript.
Received: 31 May 2010 Accepted: 10 November 2010 Published: 10 November 2010
References
1. Glas AM, Floore A, Delahaye LJ, Witteveen AT, Pover RC, Bakx N, Lahti-Domenici JS, Bruinsma TJ, Warmoes MO, Bernards R,et al:Converting a breast cancer microarray signature into a high-throughput diagnostic test.BMC Genomics2006,7:278.
2. van‘t Veer LJ, Dai H, van de Vijver MJ, He YD, Hart AA, Mao M, Peterse HL, van der Kooy K, Marton MJ, Witteveen AT,et al:Gene expression profiling predicts clinical outcome of breast cancer.Nature2002,415:530-536. 3. Paik S:Development and clinical utility of a 21-gene recurrence score
prognostic assay in patients with early breast cancer treated with tamoxifen.Oncologist2007,12:631-635.
4. Paik S, Shak S, Tang G, Kim C, Baker J, Cronin M, Baehner FL, Walker MG, Watson D, Park T,et al:A multigene assay to predict recurrence of tamoxifen-treated, node-negative breast cancer.N Engl J Med2004, 351:2817-2826.
5. Shirahata M, Oba S, Iwao-Koizumi K, Saito S, Ueno N, Oda M, Hashimoto N, Ishii S, Takahashi JA, Kato K:Using gene expression profiling to identify a prognostic molecular spectrum in gliomas.Cancer Sci2009,100:165-172. 6. Kato K:Adaptor-tagged competitive PCR: a novel method for measuring
relative gene expression.Nucleic Acids Res1997,25:4694-4696. 7. Kita-Matsuo H, Yukinawa N, Matoba R, Saito S, Oba S, Ishii S, Kato K:
Adaptor-tagged competitive polymerase chain reaction: amplification bias and quantified gene expression levels.Anal Biochem2005,339:15-28. 8. Coons SW, Johnson PC, Scheithauer BW, Yates AJ, Pearl DK:Improving
diagnostic accuracy and interobserver concordance in the classification and grading of primary gliomas.Cancer1997,79:1381-1393.
9. Livak KJ, Schmittgen TD:Analysis of relative gene expression data using real-time quantitative PCR and the 2(-Delta Delta C(T)) Method.Methods
2001,25:402-408.
10. Wang Y, Barbacioru C, Hyland F, Xiao W, Hunkapiller KL, Blake J, Chan F, Gonzalez C, Zhang L, Samaha RR:Large scale real-time PCR validation on gene expression measurements from two commercial
long-oligonucleotide microarrays.BMC Genomics2006,7:59. 11. Aoki T, Takahashi JA, Ueba T, Oya N, Hiraoka M, Matsui K, Fukui T,
Nakashima Y, Ishikawa M, Hashimoto N:Phase II study of nimustine, carboplatin, vincristine, and interferon-beta with radiotherapy for glioblastoma multiforme: experience of the Kyoto Neuro-Oncology Group.J Neurosurg2006,105:385-391.
12. Schena M, Shalon D, Davis RW, Brown PO:Quantitative monitoring of gene expression patterns with a complementary DNA microarray.
Science1995,270:467-470.
13. Andersen CL, Jensen JL, Orntoft TF:Normalization of real-time quantitative reverse transcription-PCR data: a model-based variance estimation approach to identify genes suited for normalization, applied to bladder and colon cancer data sets.Cancer Res2004,64:5245-5250. 14. Vandesompele J, De Preter K, Pattyn F, Poppe B, Van Roy N, De Paepe A,
Speleman F:Accurate normalization of real-time quantitative RT-PCR data by geometric averaging of multiple internal control genes.Genome Biol2002,3:RESEARCH0034.
15. Guenin S, Mauriat M, Pelloux J, Van Wuytswinkel O, Bellini C, Gutierrez L: Normalization of qRT-PCR data: the necessity of adopting a systematic, experimental conditions-specific, validation of references.J Exp Bot2009, 60:487-493.
16. Su LJ, Chang CW, Wu YC, Chen KC, Lin CJ, Liang SC, Lin CH, Whang-Peng J, Hsu SL, Chen CH, Huang CY:Selection of DDX5 as a novel internal control for Q-RT-PCR from microarray data using a block bootstrap re-sampling scheme.BMC Genomics2007,8:140.
17. Barbacioru CC, Wang Y, Canales RD, Sun YA, Keys DN, Chan F, Poulter KA, Samaha RR:Effect of various normalization methods on Applied Biosystems expression array system data.BMC Bioinformatics2006,7:533. 18. van den Bent MJ, Afra D, de Witte O, Ben Hassel M, Schraub S,
Hoang-Xuan K, Malmstrom PO, Collette L, Pierart M, Mirimanoff R, Karim AB: Long-term efficacy of early versus delayed radiotherapy for low-grade astrocytoma and oligodendroglioma in adults: the EORTC 22845 randomised trial.Lancet2005,366:985-990.
19. Wick W, Hartmann C, Engel C, Stoffels M, Felsberg J, Stockhammer F, Sabel MC, Koeppen S, Ketter R, Meyermann R,et al:NOA-04 randomized phase III trial of sequential radiochemotherapy of anaplastic glioma with procarbazine, lomustine, and vincristine or temozolomide.J Clin Oncol
2009,27:5874-5880.
Pre-publication history
The pre-publication history for this paper can be accessed here: http://www.biomedcentral.com/1755-8794/3/52/prepub
doi:10.1186/1755-8794-3-52
Cite this article as:Kawarazakiet al.:Conversion of a molecular classifier obtained by gene expression profiling into a classifier based on real-time PCR: a prognosis predictor for gliomas.BMC Medical Genomics2010 3:52.
Submit your next manuscript to BioMed Central and take full advantage of:
• Convenient online submission
• Thorough peer review
• No space constraints or color figure charges
• Immediate publication on acceptance
• Inclusion in PubMed, CAS, Scopus and Google Scholar
• Research which is freely available for redistribution