Evaluations of diffusion tensor image
registration based on fiber tractography
Yi Wang
1, Yu Shen
1, Dongyang Liu
1, Guoqin Li
1, Zhe Guo
1, Yangyu Fan
1and Yilong Niu
2*Background
Diffusion Tensor Magnetic Resonance Imaging (DT-MRI, also known as DTI) [1] is a magnetic resonance imaging technique. DTI measures the diffusion properties of water molecules in tissue and creates images showing physiological information such as neural bundles, which cannot be obtained by other imaging methods. DTI can be used to infer some microscopic features and organizational information regarding the structural anat-omy of tissues, especially the orientation of fibrous tissues, which has been used exten-sively to study white matter fiber tracts [2–4]. DTI plays an important role in the in vivo study of anatomical structures and functional connectivity throughout the brain.
Abstract
Background: Diffusion Tensor Magnetic Resonance Imaging (DT-MRI, also known as DTI) measures the diffusion properties of water molecules in tissues and to date is one of the main techniques that can effectively study the microstructures of the brain in vivo. Presently, evaluation of DTI registration techniques is still in an initial stage of development.
Methods and results: In this paper, six well-known open source DTI registration algorithms: Elastic, Rigid, Affine, DTI-TK, FSL and SyN were applied on 11 subjects from an open-access dataset, among which one was randomly chosen as the template. Eight different fiber bundles of 10 subjects and the template were obtained by draw-ing regions of interest (ROIs) around various structures usdraw-ing deterministic streamline tractography. The performances of the registration algorithms were evaluated by computing the distances and intersection angles between fiber tracts, as well as the fractional anisotropy (FA) profiles along the fiber tracts. Also, the mean squared error (MSE) and the residual MSE (RMSE) of fibers originating from the registered subjects and the template were calculated to assess the registration algorithm. Twenty-seven different fiber bundles of the 10 subjects and template were obtained by drawing ROIs around various structures using probabilistic tractography. The performances of regis-tration algorithms on this second tractography method were evaluated by computing the spatial correlation similarity of the fibers between subjects as well as between each subject and the template.
Conclusion: All experimental results indicated that DTI-TK performed the best under the study conditions, and SyN ranked just behind it.
Keywords: DTI, Registration algorithms, Evaluation, Tractography
Open Access
© The Author(s) 2017. This article is distributed under the terms of the Creative Commons Attribution 4.0 International License (http://creativecommons.org/licenses/by/4.0/), which permits unrestricted use, distribution, and reproduction in any medium, provided you give appropriate credit to the original author(s) and the source, provide a link to the Creative Commons license, and indicate if changes were made. The Creative Commons Public Domain Dedication waiver ( http://creativecommons.org/publicdo-main/zero/1.0/) applies to the data made available in this article, unless otherwise stated.
RESEARCH
*Correspondence: [email protected] 2 School of Marine Science and Technology, Northwestern Polytechnical University, Xi’an 710072, China
Many DTI registration algorithms have been proposed. With respect to data process-ing, registration methods can be divided into three categories: scalar image-based regis-tration algorithms, tensor image-based regisregis-tration algorithms, and fiber bundle-based registration algorithms. Scalar image-based registration algorithms use scalar images derived from DTI images, which are mainly fractional anisotropy (FA) images, to per-form registrations [2]. Voxels in tensor images are displaced according to the displace-ment field obtained with scalar registration and then tensor reorientation is performed. Different from scalar image-based registration algorithms, tensor image-based registra-tion algorithms use the tensor instead of the scalar to perform registraregistra-tions [5]. Mean-while, fiber bundle-based registrations use fiber bundles tracked from the DTI images to perform registration directly [6, 7], but it spends more time on fiber tractography from DTI images according to regions of interest (ROIs).
Currently, there is no standard method for evaluating the performance of DTI regis-trations. As such, it is necessary to develop evaluation strategies on the topic. However, development of DTI registration evaluation strategies is challenging because each DTI registration algorithm has advantages and disadvantages for different ROIs, and a single evaluation strategy cannot be broadly applied to all algorithms.
Previous studies have utilized evaluation criteria based on regional matching. In 2000, Basser et al. [3] proposed the use of two diffusion tensor eigenvalues-eigenvectors over-lapping rates (Overlap of Eigenvalue–eigenvectors Pairs). In 2002, Jones et al. [4] pro-posed the use of a tensor-normalized standard deviation (Normalized Standard Deviation of Tensors) and Dyadic Coherence to assess matching performance. Both evaluation cri-teria take advantage of the direction of the diffusion anisotropy value and principal eigen-vector. In 2006, Zhang et al. [5] used the tensor Euclidean distance (Euclidean Distance) and the tensor deviation Euclidean distance (Euclidean Distance of the Deviatoric Ten-sor) to evaluate the spatial normalization accuracy. In 2007, Van Hecke et al. [8] proposed using the angles of diffusion tensor eigenvalues-eigenvectors as evaluation criteria. How-ever, the most direct way to evaluate the performance of registration algorithms is with a similarity metric of tensor. In 2007, Klein [9, 10] proposed the use of voxels and surface overlaying rate (Volume and Surface Overlap), and registration accuracy was assessed by computing the overlap of segmented edges. Precision and convergence properties were studied by comparing deformation fields. In 2011, Wang et al. [2] proposed a partial area matching quality criterion (Regional Matching Quality Criterion). In 2012, Adluru et al. [11] used the Euclidean distance, Euclidean norm, cross-correlation, and eigenvalue-eigenvector pair of overlapping rate assessment criteria. In 2013, de Groot et al. [12] used the spatial similarity metric as the assessment criteria.
their registration algorithm. In 2011, Wang et al. [2] proposed a fiber property profile approach to perform evaluation. In 2013, de Groot et al. [12] proposed the fiber-based spatial similarity metric to assess the registration algorithms.
However, there are some problems with the existing evaluation techniques. In 2009, Klein et al. [13] evaluated performances of registrations for anatomic regions and the whole voxels of brain using the overlap rates on voxels and surfaces, the similarity of voxels and measuring distances. They evaluated 14 registration algorithms, but com-pared the scalar image-based registration algorithms without tensor-based registration algorithms. In 2011, Wang et al. [2] evaluated eight registration algorithms, including registration algorithms based on scalar images and tensor images. However, the Wang et al. study only used two evaluation criteria on infantile data which had lower FA value and signal-to-noise ratio compared to adult datasets. Since results differ between regis-tration of infantile and adult images using the same technique, adult data was selected for this study and is easily accessed in several open sources. In 2013, de Groot et al. [12] proposed use of the spatial similarity metric based on the fibers accessed through the registration algorithms, however only two algorithms were compared.
The performance metrics based on similarity of tractography are independent of any particular similarity matrix derived from scalar or higher order images, and are adopted in most registration approaches. It should also be noted that optimal white matter tract alignment is most closely linked to the eventual registration goal of obtaining anatomical correspondence in white matter [8]. In this study, the data from healthy individuals was used to evaluate the DTI registration algorithm based on white matter fiber tracts.
Six well-known open source DTI registration algorithms (Elastic, Rigid, Affine, DTI-TK, FSL and SyN) were investigated. The performance of each registration algorithm was evaluated by computing the distances and intersection angles between fiber tracts, as well as with the FA profiles along the fiber tracts using deterministic streamline trac-tography. Also, the mean squared error (MSE) and the residual MSE (RMSE) of fibers originating from registered subjects and the template were calculated to assess the regis-tration algorithm. The performance of each regisregis-tration algorithm was also evaluated by computing the spatial correlation similarity of the fibers between the subjects as well as between each subject and the template using probabilistic tractography.
Methods
Materials
Diffusion MRI Data: The open-access IXI dataset from the Hammersmith Hospital of London was used (http://www.brain-development.org). A 3 Tesla Philips MRI scan-ner was used to scan the healthy subjects. The spatial resolution of the images was 1.7409 × 1.7355 × 1.9806 mm, resulting in volume data for the head of 128 × 128 × 64 voxels. Diffusion-weighted images were acquired along 15 unique gradient directions with b = 1000 s/mm2 (repetition time = 11,894.44 ms; echo time = 51 ms). Additional
imaging parameters can be found at the image library website.
Subject and template
mean age = 51.586 years, min age = 30.89 years, max age = 63.68 years; and 5 females, mean age = 51.512 years, min age = 33.76 years, max = 74.01 years). For the template, although DTI-TK (http://www.nitrc.org/projects/dtitk/) could produce a good template with sufficient DTI information to perform tractography, using DTI-TK would bias the analysis since it is compared here. So another subject with quality inspection was chosen from the same dataset at random to serve as the template (male, age = 37.83 years). Pre‑processing
The Brain Extraction Tool (BET) within the FMRIB software Library (FSL) was used to extract brain tissue for each subject and template. The mask used for skull stripping was generated from each subject or template individually and checked manually. Before ten-sor estimation, diffusion-weighted images (DWIs) from 15 diffusion gradient directions were eddy-current corrected with eddy tool in FSL, which is a tool to correct eddy cur-rent-induced distortions and subject movements in diffusion data [14].
Registration methods
In accordance with the work of Wang et al. [2], we chose six relatively mature open source registration algorithms to evaluate. All of the subjects were normalized at first. The six DTI registration algorithms investigated in this paper are described in detail below.
In 2000, Alexander et al. [15] applied Elastic Registration Algorithm (referred to as Elastic in this paper) to diffusion tensor image. It can be performed with Advanced Normalization Tools (ANTs) (http://www.nitrc.org/projects/ants). In 1999, Studholme et al. [16] proposed Rigid body registration algorithm (referred to as Rigid in this paper). It also can be performed with ANTs, and it is one of the simplest algorithms of image registration.
In 2005, Leemans et al. [17] rendered an algorithm based on multi-channel affine registration, and the mutual information was used for similarity criteria (referred to as Affine in this paper). It is often performed before most deformation registrations and available through ANTs.
In 2006, Zhang et al. [5] developed a diffeomorphic deformable tensor registration technique (termed DTI-TK) (http://www.nitrc.org/projects/dtitk/). It is the only open source and nonlinear tensor-based registration algorithm (referred to as DTI-TK in this paper).
In 2008, Andersson et al. [18] developed a B-spline registration algorithm based on the sum-of-squared differences performed by FSL (http://www.nitrc.org/projects/fsl) (referred to as FSL in this paper).
In 2008, Avants et al. [19] developed a symmetric image normalization method based on mutual correlation (referred to as SyN in this paper) again with ANTs.
Evaluation methods
In this paper, deterministic streamline tractography [20, 21, 22] and probabilistic trac-tography [12, 23, 24, 25] were used to track fibers separately. Deterministic stream-line tractography is used to evaluate the DTI registration based on the distances and intersection angles between fiber tracts as well as the fiber property profiles, MSE, and RMSE. Probabilistic tractography is used to evaluate DTI registration based on the spa-tial similarity metric.
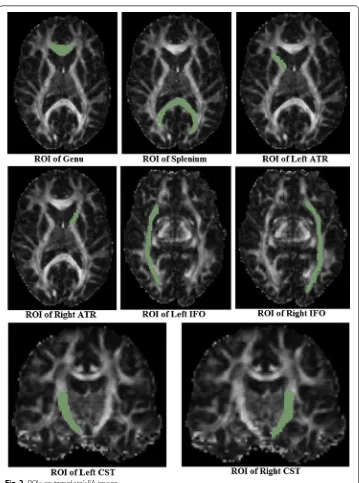
To perform deterministic streamline tractography with FACT (Fiber Assessment by Continuous Tracking) [21, 22], eight different ROIs [2, 26–29] were manually drawn on FA maps according to the work of Zhang et al. [5]. The corresponding fiber tracts of interest to this study are: the knee of the Corpus Callosum (Genu of the corpus callo-sum, namely Genu), the splenium of the Corpus Callosum (the Splenium of the corpus callosum, namely Splenium), the left and right Thalamic radiations (Anterior Thalamic Radiations, namely ATR), the left and right fronto-occipital fasciculus (Inferior Fronto-occipital Fasciculi, namely IFO) and the left and right cortical/corticospinal tracts of the medulla oblongata (Corticospinal/Corticobulbar tracts, namely CST). In evaluation methods based on distance between fiber tracts, as well as MSE and RMSE of fibers, the fibers of each subject and the template are tracked individually with the same ROIs drawn on the template FA image [2, 9, 11, 26]. In evaluation methods based on the FA profiles along the fiber tracts and intersection angles between fiber bundles, fibers of the template are tracked first, and then fibers of each subject were obtained by directly map-ping the template fibers onto the same positions [2]. ROIs on the template FA image are shown in Fig. 2 and the fibers of eight ROIs on the template are shown in Fig. 3.
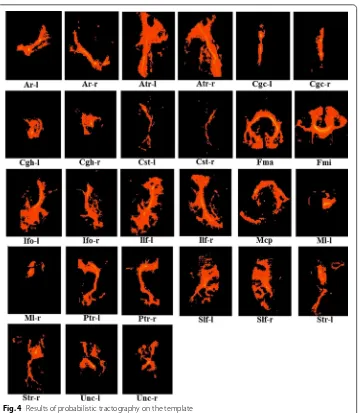
Probabilistic tractography was performed with PROBTRACKX [10, 24, 25] available in FSL. The masks used were based on the protocols described by Mori [26, 27], Stieltjes
et al. [28], and Wakana et al. [30, 31], and 27 different ROIs of DTI were used to track fiber bundles. The various ROIs are shown in Table 1 and the results of probabilistic tractography are shown in Fig. 4. All of the tracking parameters were set to the default values available in FSL [10].
Evaluation method based on distance between fiber tracts
In most cases, the objective function of registration is the registration for anatomical structures. So performances of registration assessment also should be the measurement of anatomical structures.
In 2006, distances between fiber tracts were proposed by Zhang et al. [5] to evaluate registration performance:
(1)
f = 1 F+G
�
Fi∈F min Gj∈Gd
�
Fi,Gj�+
�
Gj∈F min Fi∈Gd
�
Fi,Gj�
Fig. 3 Fibers of the template
Table 1 The seeds used in this paper, tracts with left/right homologues are listed [23, 26,
29, 24, 31]
‘+’ shows that the ROI is different across the left and the right
ROI Left/right
Acoustic radiation (Ar) +
Anterior thalamic radiation (Atr) +
Superior thalamic radiation (Str) +
Posterior thalamic radiation (Ptr) +
Superior longitudinal fasciculus (Slf ) +
Inferior longitudinal fasciculus (Ilf ) +
Inferior fronto-occipital fasciculus (Ifo) +
Uncinate fasciculus (Unc) +
Cingulate gyrus part of cingulum (Cgc) +
Parahippocampal part of cingulum (Cgh) +
Forceps minor (Fmi) −
Forceps major (Fma) −
Middle cerebellar peduncle (Mcp) −
Medial lemniscus (Ml) +
where f is the Hausdorff distance, d is a pairwise distance between two fibers, F and G are two fiber bundles, min
Gj∈G
dFi,Gj is the distance between the fiber Fi and the fiber in
G that is closest to Fi, and similarly, min
Fi∈G
d
Fi,Gj is the distance between the fiber Gj and
the fiber in F that is closest to Gj. Equation (1) is symmetric with respect to the two fibers involved, and when two identical fiber bundles are perfectly aligned, it evaluates to zero. The lower the f value is, the better the registration performance is.
Evaluation method based on the MSE and RMSE of fibers
In 2007, Mayer et al. [6] calculated the MSE between model and target fibers before and after registration to verify the validity of their registration algorithm. In 2010, Shadmi et al. [7] calculated the MSE and the RMSE between a warped model and a target fiber sets to assess the registration algorithm.
In this study, subjecti (i = 1, 2,…,n) represent registered fibers using different
registra-tion algorithms, and template is the corresponding fiber of the template. Table 2 shows the evaluation results of registration based on distances between fibers. Table 3 shows the MSE between each subject and template pair for each ROI. Table 4 shows the RMSE between each subject and template for each ROI.
Evaluation method based on the FA profiles along the fiber tracts
In 2011, Wang et al. [2] proposed a fiber property profile-based metric using norma-tive correlation. Along each fiber bundle, FA profiles were calculated. For each registered subject, each fiber was recaptured with the same location as the fiber of the template. With the defined fiber bundles, FA curves of each fiber bundle were redefined, and then the corresponding mean FA curves were derived from the fiber bundles of the same ROI for all subjects.
Evaluation method based on intersection angles between fiber bundles
According to Wang’s paper [2], the fiber tracts from a template can be mapped to each registered subject to obtain the corresponding tracts with consistent positioning. That is, if a better registration is obtained, improved consistency in the anatomical structures will subsequently be achieved. Meanwhile, a better registration is indicative of a smaller
(2) MSE= 1
n
n
i=1
subjecti−template2
(3)
RMSE= local MSE global MSE
Table 2 Evaluation results of registration based on distances between fibers
Genu Splenium L‑ATR R‑ATR L‑CST R‑CST L‑IFO R‑IFO Mean
Elastic 0.5202 0.5509 0.4892 0.5264 0.4953 0.5005 0.4697 0.4533 0.5007 Rigid 0.5275 0.5097 0.4941 0.5693 0.5037 0.4960 0.4822 0.4704 0.5066 Affine 0.5346 0.5244 0.4984 0.5392 0.5000 0.4912 0.4664 0.4773 0.5039 DTI-TK 0.4876 0.4792 0.4872 0.4783 0.4736 0.4904 0.4549 0.4098 0.4701 FSL 0.4971 0.4860 0.4914 0.5023 0.4920 0.4656 0.4427 0.4053 0.4728 SyN 0.4835 0.4958 0.4788 0.5126 0.4748 0.4716 0.4548 0.4153 0.4734
Table 3 Evaluation results of registrations based on MSE of fibers
Genu Splenium L‑ATR R‑ATR L‑CST R‑CST L‑IFO R‑IFO Mean
intersection angle between the tracts and a subsequent increase in the corresponding cosine value.
Here, Fi and Gj are fibers of the template and one subject respectively, F and G are two fiber bundles, and the value of cosα is between 0 and 1. The higher the value of cosα is, the better the performance is. For each ROI, the final result represents an average value of cosα across the fibers between all subjects and template.
Evaluation method based on spatial similarity between fiber tracts
The framework developed by de Groot et al. [12] was used to evaluate scalar or higher-order similarity matrices based on white matter tractography. With this method, the fiber tracts are obtained based on probabilistic tractography. A similarity matrix was used to assess the spatial correlation similarity matrix:
Equation (5) provides a measure of the voxel-wise similarity of the tracts density images (J and K) for two subjects. It computes over all voxels (i), and is bound on a 0–1 scale. A similarity matrix is calculated on the tract density images. A higher spatial cor-relation similarity indicates a better registration.
Results
Evaluation method based on distance between fiber tracts
Table 2 shows the average fiber distances between each subject and template pair of fib-ers where Genu, Splenium, L-ATR (left ATR), R-ATR (right ATR), L-CST (left CST), R-CST (right CST), L-IFO (left IFO), R-IFO (right IFO) are the eight fibers tracked by streamline fiber tracking algorithm of Deterministic Fiber Tractography for the template and subjects. “Mean” is the average value of each of the eight ROIs across all registration algorithms. For each ROI, the final result is the average distance of fibers between all subjects and template.
The average distances of each registration algorithm are presented in Table 2 DTI-TK had the lowest value and the SyN algorithm had the second lowest value. These results indicate that the DTI-TK registration algorithm outperforms all other tested registration methods, and the SyN presented as the next most effective method. However, the indi-vidual performance of registration algorithm across the various ROIs differs. For exam-ple, for the left ATR, the performance of SyN was slightly improved over DTI-TK.
Evaluation method based on the MSE and RMSE of fibers
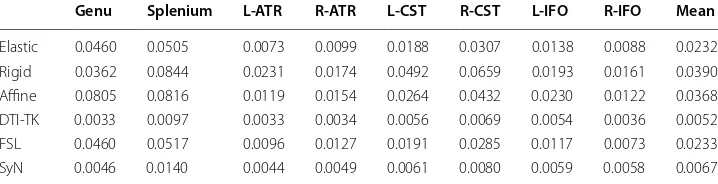
From Tables 3 and 4, smaller values of MSE and RMSE indicate a better registration as it shows the difference levels between each subject after registration and the template. As
(4) cosα =
i
j Fi·Gj
�F��G�
(5)
C=
iJiKi
iJ2i
values for DTI-TK are the lowest, the DTI-TK registration algorithm was shown to be the most effective in this study with the SyN method ranking second.
From Tables 3 and 4, smaller values of MSE and RMSE indicate a better registration as it shows the difference levels between each subject after registration and the template. As values for DTI-TK are the lowest, the DTI-TK registration algorithm was shown to be the most effective in this study with the SyN method ranking second.
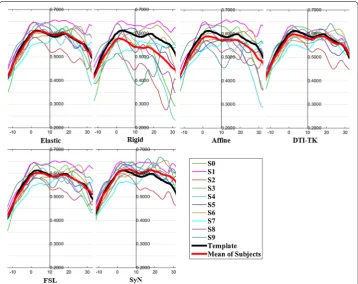
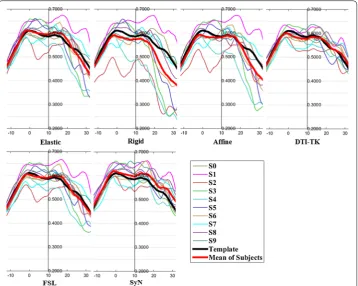
Evaluation method based on the FA profiles along the fiber tracts
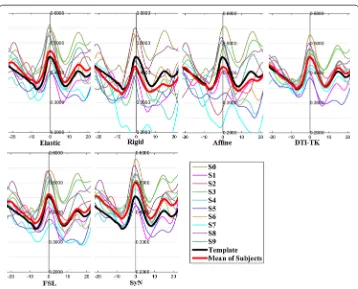
The FA profiles along the fiber tracts are shown in Fig. 5 through Fig. 12.
In these figures, the x-coordinate represents the arc length of the fiber bundles, and the y-coordinate is the value of FA. From the Figs. 5, 6, 7, 8, 9, 10, 11, 12, the FA profile characteristic curves of each subject obtained with DTI-TK are closest to the template (black color) and the mean of subjects (red color). The SyN and FSL algorithms ranked
Table 4 Evaluation results of registrations based on RMSE of fibers
Genu Splenium L‑ATR R‑ATR L‑CST R‑CST L‑IFO R‑IFO Mean
Elastic 0.1683 0.2049 0.0830 0.0907 0.1257 0.1597 0.1124 0.0929 0.1297 Rigid 0.1739 0.2601 0.1393 0.1214 0.1967 0.2332 0.1297 0.1261 0.1726 Affine 0.2284 0.2584 0.1093 0.1112 0.1491 0.1910 0.1425 0.1087 0.1617 DTI-TK 0.0569 0.0963 0.0546 0.0546 0.0725 0.0800 0.0692 0.0597 0.0680 FSL 0.1645 0.2049 0.0876 0.0891 0.1266 0.1569 0.1149 0.0905 0.1294 SyN 0.0676 0.1173 0.0650 0.0678 0.0777 0.0872 0.0764 0.0755 0.0793
Fig. 6 FA profiles of the Splenium for the six registration methods
Fig. 8 FA profiles of the right ATR for the six registration methods
Fig. 10 FA profiles of the right IFO for the six registration methods
behind DTI-TK. However, as mentioned, the registration accuracy differs between the various ROIs and algorithms. For example, for the Genu structure, the Rigid algorithm performed better than the Affine, while for the Splenium structure, the Affine algorithm outperformed the Rigid algorithm.
Correlation coefficients between the FA profiles for each registered dataset and the template for all of the registration methods are shown in Table 5 for all subjects. Based on the correlation coefficients, no one algorithm outperformed the rest for all of the tracts. DTI-TK demonstrated the best results across eight ROIs, and performed well overall. However, it is difficult to identify one algorithm as the best based on the norma-tive tract profile correlation evaluation across all fiber tracts.
Additionally, based on the correlation coefficients, we considered the correlation val-ues of 0.85 [2] as the threshold when fiber tracts were mapped to the template. Correla-tion coefficients below the threshold were marked as a failure. Table 6 shows the number of failures when eight DTI fiber bundles were mapped to the template for the ten sub-jects. The DTI-TK algorithm resulted in the minimum number of failures and can be considered the best algorithm based on this criterion.
Evaluation method based on intersection angles between fiber bundles
In Table 7, average cosine values of the intersection angles between each subject and template tracts are shown.
From the average cosα values of six registration algorithms in Table 7 the value of cosα in DTI-TK is the largest, which means the angle is the smallest. The cosine value of SyN
is larger than the other registration algorithms except TK. In conclusion, the DTI-TK registration algorithm performed the best, and the SyN ranked second as observed with other evaluation methods.
Table 5 Correlation coefficients between FA profiles of various fiber tracts on registered subjects and the template for the six registration algorithms
Elastic Rigid Affine DTI‑TK FSL SyN Best
Genu
MEAN 0.4317 0.3890 0.4101 0.4331 0.4337 0.4572 DTI-TK STDEV 0.0974 0.0963 0.0794 0.1324 0.1001 0.1220
p value 0.8721 0.8628 0.7364 0.9854 0.9464 0.9784
Rank 4 5 6 1 3 2
Splenium
MEAN 0.4524 0.4239 0.4312 0.4554 0.4624 0.4935 DTI-TK STDEV 0.1285 0.1118 0.1140 0.1527 0.1260 0.1393
p value 0.8773 0.7255 0.7794 0.9726 0.9137 0.9488
Rank 4 6 5 1 3 2
Left ATR
MEAN 0.3945 0.3695 0.3876 0.3818 0.3966 0.4056 DTI-TK STDEV 0.0602 0.0552 0.0559 0.0663 0.0595 0.0654
p value 0.7731 0.5686 0.6687 0.8882 0.8170 0.8785
Rank 4 6 5 1 3 2
Right ATR
MEAN 0.3876 0.3679 0.3793 0.3840 0.3930 0.4068 DTI-TK STDEV 0.0666 0.0609 0.0586 0.0783 0.0681 0.0806
p value 0.7928 0.6317 0.6886 0.9120 0.8535 0.9091
Rank 4 6 5 1 3 2
Left CST
MEAN 0.4374 0.4071 0.4257 0.4282 0.4435 0.4613 DTI-TK STDEV 0.1056 0.0965 0.1016 0.1070 0.0982 0.0968
p value 0.9002 0.8189 0.8700 0.9507 0.9259 0.9376
Rank 4 6 5 1 3 2
Right CST
MEAN 0.4634 0.4256 0.4490 0.4633 0.4723 0.4956 DTI-TK STDEV 0.1105 0.1113 0.1088 0.1154 0.1067 0.1072
p value 0.8509 0.8121 0.8249 0.8249 0.9095 0.9239
Rank 4 6 5 1 3 2
Left IFO
MEAN 0.3890 0.3629 0.3691 0.3843 0.3918 0.4145 DTI-TK STDEV 0.0609 0.0618 0.0547 0.0638 0.0580 0.0628
p value 0.6879 0.6470 0.5858 0.8446 0.7382 0.8117
Rank 4 5 6 1 3 2
Right IFO
MEAN 0.4110 0.3695 0.3988 0.3958 0.4148 0.4302 DTI-TK STDEV 0.0549 0.0563 0.0528 0.0687 0.0536 0.0566
p value 0.7669 0.6525 0.6994 0.9072 0.7918 0.8124
Evaluation method based on spatial similarity between fiber tracts
Figure 13 shows the spatial similarity metric of fibers between each subject and sub-ject pairs, along with the similarity metric of fibers between each subsub-ject and template pairs. From Fig. 13, DTI-TK had the largest average similarity across the six registration
Table 6 Number of failures in mapping the subject fiber tracts to the template with a cor-relation value greater than 0.85 for the six registration algorithms
Elastic Rigid Affine DTI‑TK FSL SyN
Genu 2 3 3 0 1 0
Splenium 2 4 5 0 1 0
Left ATR 9 10 10 2 7 2
Right ATR 9 9 9 0 4 1
Left CST 1 5 2 0 1 1
Right CST 1 4 2 0 1 0
Left IFO 9 8 10 4 9 5
Right IFO 7 9 8 2 5 5
Table 7 Average cosine values of intersection angles between each subject and the tem-plate tracts
Genu Splenium L‑ATR R‑ATR L‑CST R‑CST L‑IFO R‑IFO Mean
Ealstic 0.8601 0.7746 0.8330 0.8428 0.8349 0.8134 0.8484 0.8423 0.8312 Rigid 0.7746 0.7040 0.7889 0.7908 0.7793 0.7606 0.8078 0.7657 0.7715 Affine 0.8276 0.7434 0.8090 0.8209 0.8097 0.7846 0.8178 0.8163 0.8037 DTI-TK 0.9164 0.8491 0.8849 0.8923 0.8956 0.8762 0.9132 0.9010 0.8911 FSL 0.8840 0.8008 0.8753 0.8785 0.8764 0.8152 0.8966 0.8848 0.8220 SyN 0.8850 0.8062 0.8607 0.8576 0.8509 0.8376 0.8786 0.8693 0.8557
algorithms, and the average similarity from the SyN algorithm is larger than remaining registration algorithms. Similar to previous evaluations, the DTI-TK registration algo-rithm performed the best, and the SyN algoalgo-rithm ranked second.
Discussion
In this paper, we used deterministic tractography for fiber tracking and evaluated six registration methods with the distance between fibers of subjects and the template, the MSE and RMSE, the average FA profiles, and angles between fibers of subjects and the template. From Table 2, the average distance of DTI-TK was smallest, which implied DTI-TK is the best, but it was not the smallest across all ROIs. For example, in the Genu ROI, the distance determined with SyN was smaller than that with DTI-TK. From Tables 3 and 4, results of MSE and RMSE show that the average values for DTI-TK were the smallest. However across the various ROIs, no single method performed the best for all ROIs. From Figs. 5, 6, 7, 8, 9, 10, 11, 12 and Tables 5 and 6, the six registration algo-rithms were easily ranked and the results are basically the same. Only the results for the Affine and Rigid algorithms differed between a few ROIs. The p values in Table 5 show that correlation coefficients obtained with DTI-TK are the highest. Further, in Table 6, DTI-TK had the minimum number of failures using the selected threshold and can be considered as the best algorithm based on that criterion. According to the average FA profile evaluation, DTI-TK seemed to show the best registration performance. Based on the angles between fibers of subjects and the template (Table 7) evaluation, similar to the distances between fibers of subjects and the template evaluation, DTI-TK again showed the best registration performance because the value of cosα in DTI-TK is the largest, which means the intersection angle is the smallest. However, the registration algorithms did not always perform the best for all ROIs in a single subject, and may be due to the fact that since subjects and the template were chosen at random for this study, the dif-ferences in registration performance across the six registration algorithms as observed on full tract evaluation. The performance of DTI-TK in correctly mapping the eight fiber tracts for all subjects can be attributed to the fact that the algorithm exploits the whole tensor orientation information for the registration compared to the scalar FA values.
We also used probabilistic tractography for fiber tracking and evaluated the six reg-istration methods with a spatial correlation similarity metric. Spatial correlation as a similarity measurement provides a precise and reproducible evaluation of registration quality when using the appropriate framework [12] which is based on multiple tracts identified with probabilistic tractography. From Fig. 13, the spatial similarity metric of fibers between subjects shows DTI-TK was the best. To avoid occasional bias observed with the comparison of different subjects, we also calculated the spatial similarity metric of fibers between each subject and the template, which again indicated that DTI-TK out-performed the rest of the algorithms. It should be mentioned that the spatial similarity values were the average of all the ROIs across all subjects.
larger study cohort, and a template based on all of the subjects. We would also like to expand the ROIs chosen for analysis.
At the moment, evaluation methods based on deterministic tractography are gradually maturing; however, methods based on probabilistic tractography are still in the primary stage of development [12]. When tracking the fibers, probabilistic tractography still requires much more calculation time than deterministic tractography [2, 5, 12]. Reduc-tion of the tracking time in probabilistic tractography and development of new evalua-tion methods based on probabilistic tractography are areas of ongoing research.
Conclusions
In this paper, six open source registration algorithms were applied with randomly cho-sen subjects from IXI dataset and evaluated based on fiber tracts obtained through deterministic and probabilistic tractography. Results indicated that the DTI-TK and SyN registration algorithms outperformed the other registration algorithms overall. In con-clusion, DTI-TK qualifies as the best registration algorithm, and SyN ranks just behind DTI-TK for the evaluation techniques studied. It should be noted that results from crite-ria based on deterministic tractography are not the same as those based on probabilistic tractography. For example, the Affine registration algorithm is generally considered as the worst based on deterministic tractography while the Rigid registration algorithm is the worst based on probabilistic tractography.
Abbreviations
DT-MRI: diffusion tensor magnetic resonance imaging; ROIs: regions of interest; FA: fractional anisotropy; MSE: mean squared error; RMSE: residual MSE; DTI-TK: diffusion tensor imaging toolkit; BET: brain extraction tool; FSL: FMRIB software library; DWIs: diffusion-weighted images; ANTs: advanced normalization tools; PPD: preservation of principal directions; FACT: fiber assessment by continuous tracking; ATR: anterior thalamic radiations; IFO: inferior fronto-occipital fasciculi; CST: corticospinal/corticobulbar tracts.
Authors’ contributions
YW and YN conceived and designed the experiments and analyzed the data. YS, DL and GL performed the experiments. ZG and YF helped to revise the manuscript. All authors contributed analysis tools and to the writing of the manuscript. All authors read and approved the final manuscript.
Author details
1 School of Electronics and Information, Northwestern Polytechnical University, Xi’an 710072, China. 2 School of Marine Science and Technology, Northwestern Polytechnical University, Xi’an 710072, China.
Acknowledgements
We acknowledge http://brain-development.org/ixi-dataset/ as the source of the IXI data used in this paper. Competing interests
The authors declare that they have no competing interests. Availability of data and materials
The datasets generated during and/or analysed during the current study are not publicly available because it related to the National Natural Science Foundation of China, and needs to be secret for the patent.
Ethics approval and consent to participate
The open-access IXI dataset from the Hammersmith Hospital of London was used through http://www.brain-develop-ment.org. This data is made available under the Creative Commons CC BY-SA 3.0 license.
Funding
This study was funded by the National Natural Science Foundation of China (Grant No.61402371); Natural Science Basic Research Plan in Shaanxi Province of China (Grant Nos. 2015JM6317); The Seed Foundation of Innovation and Creation for Graduate Students in NPU (Grant No. Z2016121, Z2016024).
References
1. Basser PJ, Mattiello J, Bihan DL. Estimation of the effective self-diffusion tensor from the NMR spin echo. J Magn Reson. 1994;103:247–54.
2. Wang Y, Gupta A, Liu Z, Zhang H, Escolar ML, Gilmore JH, Gouttard S, Fillard P, Maltbie E, Gerig G, Styner M. DTI regis-tration in atlas based fiber analysis of infantile Krabbe disease. NeuroImage. 2011;55:1577–86.
3. Basser PJ, Pajevic S. Statistical artifacts in diffusion tensor MRI (DT-MRI) caused by background noise. Magn Reson Med. 2000;44:41–50.
4. Jones DK, Griffin LD, Alexander DC, Catani M, Horsfield MA, Howard R, Williams SCR. Spatial normalization and averaging of diffusion tensor MRI data sets. NeuroImage. 2002;17:592–617.
5. Zhang H, Yushkevich PA, Alexander DC, Gee JC. Deformable registration of diffusiontensor MR images with explicit orientation optimization. Med Image Anal. 2006;10:764–85.
6. Mayer A, Greenspan H. Direct registration of white matter tractographies and application to atlas construction. In: Proceedings of workshop on statistical registration: pair-wise and group-wise alignment and atlas formation; 2007. 7. Shadmi R, Mayer A, Sochen N, Greenspan H. Piecewise smooth affine registration of point-sets with application
to DT-MRI brain fiber-data. In: Biomedical imaging: from nano to macro, ieee international symposium; 2010. p. 528–31.
8. Van Hecke W, Leemans A, D’Agostino E, De Backer S, Vandervliet E, Parizel PM, Sijbers J. Nonrigid coregistra-tion of diffusion tensor images using a viscous fluid model and mutual informacoregistra-tion. IEEE Trans Med Imaging. 2007;26:1598–612.
9. Klein S, Staring M, Pluim JPW. Evaluation of optimization methods for nonrigid medical image registration using mutual information and B-splines. IEEE Trans Image Process. 2007;16:2879–90.
10. Klein S, Staring M, Murphy K, Viergever MA, Pluim JPW. Elastix: a toolbox for intensity-based medical image registra-tion. IEEE Trans Med Imaging. 2010;29:196–205.
11. Adluru N, Zhang H, Fox AS, Shelton SE, Ennis CM, Bartosic AM, Oler JA, Tromp PM, Zakszewski E, Gee JC, Kalin NH, Alexander AL. A diffusion tensor brain template for rhesus macaques. NeuroImage. 2012;59:306–18.
12. de Groot M, Vernooij MW, Klein S, Ikram MA, Vos FM, Smith SM, Niessen WJ, Andersson JLR. Improving alignment in tract-based spatial statistics: evaluation and optimization of image registration. NeuroImage. 2013;76:400–11. 13. Klein A, Andersson J, Ardekani BA, Ashburner J, Avants B, Chiang MC, Christensen GE, Collins DL, Gee J, Hellier P,
Song HJ, Jenkinson M, Lepage C, Rueckert D, Thompson P, Vercauteren T, Woods RP, Mann JJ, Parsey RV. Evaluation of 14 nonlinear deformation algorithms applied to human brain MRI registration. NeuroImage. 2009;46:786–802. 14. Andersson JLR, Sotiropoulos SN. An integrated approach to correction for off-resonance effects and subject
move-ment in diffusion MR imaging. NeuroImage. 2016;125:1063–78.
15. Alexander DC, Gee JC. Elastic matching of diffusion tensor images. Comput Vis Image Understand. 2000;77:233–50. 16. Studholme C, Hill DLG, Hawkes DJ. An overlap invariant entropy measure of 3D medical image alignment. Pattern
Recogn. 1999;32(1):71–86.
17. Leemans A, Sijbers J, Backer SD, Vandervliet E, Parizelet PM. Affine coregistration of diffusion tensor magnetic reso-nance images using mutual information. Adv Concepts Intel Vision Syst. 2005;3708:523–30.
18. Andersson JLR, Smith SM, Jenkinson M. FNIRT–FMRIB’s non-linear image registration tool. In: Proceedings of the 14th annual meeting of the organization for human brain mapping; 2008.
19. Avants BB, Epstein CL, Grossman M, Gee JC. Symmetric diffeomorphic image registration with cross-correlation: evaluating automated labeling of elderly and neurodegenerative brain. Med Image Anal. 2008;12:26–41. 20. Basser PJ, Pajevic S, Pierpaoli C, Duda J, Aldroubi A. In vitro fiber tractography using DT-MRI data. Magn Reson Med.
2000;44:625–32.
21. Mori S, Crain BJ, Chacko VP, Van Zijl PCM. Three dimensional tracking of axonal projections in the brain by magnetic resonance imaging. Ann Neurol. 1999;45:265–9.
22. Xue R, Van Zijl PCM, Crain BJ. In vivo three dimensional reconstruction of rat brain axonal projections by diffusion tensor imaging. Magn Reson Med. 1999;42:1123–7.
23. Behrens TEJ, Johansen-Berg H, Jbabdi S, Rushworth MFS, Woolrich MW. Probabilistic diffusion tractography with multiple fibre orientations: what can we gain? Neuroimage. 2007;34:144–55.
24. Smith SM, Jenkinson M, Johansen-Berg H, Rueckert D, Nichols TE, Mackay CE, Watkins KE, Ciccarelli O, Cader MZ, Matthews PM, Behrens TEJ. Tract based spatial statistics: voxelwise analysis of multi-subject diffusion data. NeuroIm-age. 2006;31:1487–505.
25. Woolrich MW, Jbabdi S, Patenaude B, Chappell M, Makni S, Behrens T, Beckmann C, Jenkinson M, Smith SM. Bayesian analysis of neuroimaging data in FSL. NeuroImage. 2009;45:S173–86.
26. Mori S, Kaufmann WE, Davatzikos C, Stieltjes B, Amodei L, Fredericksen K, Pearlson GD, Melhem ER, Solaiyappan M, Raymond GV, Moser HW, Van Zijl PCM. Imaging cortical association tracts in the human brain using diffusion-tensorbased axonal tracking. Magn Reson Med. 2002;47:215–23.
27. Mori S, Van Zijl PCM. Fiber tracking: principles and strategies—a technical review. NMR Biomed. 2002;15:468–80. 28. Stieltjes B, Kaufmann WE, Van Zijl PCM, Fredericksen K, Pearlson GD, Solaiyappan M, Mori S. Diffusion tensor imaging
and axonal tracking in the human brainstem. NeuroImage. 2001;14:723–35.
29. Catani M, Howard RJ, Pajevic S, Jones DK. Virtual in vivo interactive dissection of white matter fasciculi in the human brain. NeuroImage. 2002;17:77–94.
30. Wakana S, Jiang H, Nagae-Poetscher LM, Van Zijl PCM, Mori S. Fiber tract based atlas of human white matter anatomy. Radiology. 2004;230:77–87.