Earth Syst. Sci. Data, 5, 109–123, 2013 www.earth-syst-sci-data.net/5/109/2013/ doi:10.5194/essd-5-109-2013
©Author(s) 2013. CC Attribution 3.0 License.
History
ofGeo- and Space
Sciences
Open
Access
Advances
inScience & Research
Open Access Proceedings
Open
Access
Earth System
Science
Data
OpenAccess
Earth System
Science
Data
D
iscussions
Drinking Water
Engineering and Science
Open Access
Drinking Water
Engineering and Science
Discussions
O
pen
Acc
es
s
Social
Geography
Open
Access
D
iscussions
Social
Geography
Open
Access
The MAREDAT global database of high performance
liquid chromatography marine pigment measurements
J. Peloquin1, C. Swan1, N. Gruber1, M. Vogt1, H. Claustre2,3, J. Ras2,3, J. Uitz2,3, R. Barlow4,5, M. Behrenfeld6, R. Bidigare7, H. Dierssen8, G. Ditullio9, E. Fernandez10, C. Gallienne11, S. Gibb12, R. Goericke13, L. Harding14, E. Head15, P. Holligan16, S. Hooker17, D. Karl7, M. Landry7, R. Letelier18,
C. A. Llewellyn11, M. Lomas19, M. Lucas5, A. Mannino17, J.-C. Marty2,3, B. G. Mitchell13,
F. Muller-Karger20, N. Nelson21, C. O’Brien1, B. Prezelin22, D. Repeta23, W. O. Smith Jr.24,
D. Smythe-Wright16, R. Stumpf25, A. Subramaniam26, K. Suzuki27, C. Trees28, M. Vernet13,
N. Wasmund29, and S. Wright30
1Environmental Physics Group, Institute of Biogeochemistry and Pollutant Dynamics, ETH Z¨urich, Switzerland 2Laboratoire d’Oc´eanographie de Villefranche, UMR7093, CNRS, 06230 Villefranche-sur-Mer, France 3Universit´e Pierre et Marie Curie-Paris 6, UMR7093, Laboratoire d’Oc´eanographie de Villefranche,
06230 Villefranche-sur-Mer, France
4Bayworld Centre for Research and Education, Rogge Bay 8012, Cape Town, South Africa 5Marine Research Institute, University of Cape Town, Rondebosch 7701, Cape Town, South Africa
6Department of Botany and Plant Pathology, Oregon State University, Corvallis, OR, USA 7Department of Oceanography, University of Hawai’i at Manoa, Honolulu, HI, USA
8Department of Marine Sciences, University of Connecticut, Groton, CT, USA 9Grice Marine Lab, College of Charleston, SC, USA
10Departamento Ecolox´ıa e Biolox´ıa Animal, Universidade de Vigo, 36310 Vigo, Spain 11Plymouth Marine Laboratory, Plymouth, PL1 3DH, UK
12Environmental Research Institute, University of the Highlands and Islands, UK 13Scripps Institution of Oceanography, University of California, San Diego, CA, USA
14University of Maryland Horn Point Laboratory, Cambridge, MD, USA
15Ecosystem Research Division, Bedford Institute of Oceanography, Dartmouth, Nova Scotia, Canada 16Ocean and Earth Science University of Southampton, National Oceanography Centre, Southampton,
SO14 3ZH, UK
17NASA Goddard Space Flight Center, Greenbelt, MD, USA
18College of Oceanic and Atmospheric Sciences, Oregon State University, Corvallis, OR, USA 19Bermuda Institute of Ocean Sciences, St. George’s GE 01, Bermuda
20Institute for Marine Remote Sensing/IMaRS, College of Marine Science, University of South Florida, St. Petersburg, FL, USA
21Earth Research Institute, University of California, Santa Barbara, CA, USA
22Department of Ecology, Evolution and Marine Biology, University of California, Santa Barbara, CA, USA 23Woods Hole Oceanographic Institution, Woods Hole, MA, USA
24Virginia Institute of Marine Science, College of William & Mary, Gloucester Pt., VA, USA 25NOAA National Ocean Service, Silver Spring, MD, USA
26Lamont Doherty Earth Observatory at Columbia University, Palisades, NY, USA 27Environmental Earth Science, Hokkaido University, Sapporo 060-0810, Japan
28NATO Undersea Research Centre, La Spezia, Italy
29Leibniz Institute for Baltic Sea Research, 18119 Warnem¨unde, Germany
30Australian Antarctic Division, and Antarctic Climate and Ecosystems Cooperative Research Centre, 203 Channel Hwy Kingston, Tasmania 7050, Australia
Correspondence to: C. Swan ([email protected])
110 J. Peloquin et al.: MAREDAT global HPLC pigment database
Abstract. A global pigment database consisting of 35 634
pigment suites measured by high performance liquid chro-matography was assembled in support of the MARine
Ecosytem DATa (MAREDAT) initiative. These data
origi-nate from 136 field surveys within the global ocean, were solicited from investigators and databases, compiled, and then quality controlled. Nearly one quarter of the data originates from the Laboratoire d’Oc´eanographie de Ville-franche (LOV), with an additional 17 % and 19 % stem-ming from the US JGOFS and LTER programs, respec-tively. The MAREDAT pigment database provides high qual-ity measurements of the major taxonomic pigments includ-ing chlorophylls a and b, butanoyloxyfucoxanthin, 19’-hexanoyloxyfucoxanthin, alloxanthin, divinyl chlorophyll a, fucoxanthin, lutein, peridinin, prasinoxanthin, violaxanthin and zeaxanthin, which may be used in varying combinations to estimate phytoplankton community composition. Quality control measures consisted of flagging samples that had a total chlorophyll a concentration of zero, had fewer than four reported accessory pigments, or exceeded two stan-dard deviations of the log-linear regression of total chloro-phyll a with total accessory pigment concentrations. We an-ticipate the MAREDAT pigment database to be of use in the marine ecology, remote sensing and ecological mod-eling communities, where it will support model valida-tion and advance our global perspective on marine biodi-versity. The original dataset together with quality control flags as well as the gridded MAREDAT pigment data may be downloaded from PANGAEA: http://doi.pangaea.de/10. 1594/PANGAEA.793246.
1 Introduction
The recognition of the role of phytoplankton functional groups in controlling the biogeochemical cycles of critical elements has created a need to constrain the global distri-bution and abundance of these groups (Doney et al., 2009; Weber and Deutsch, 2010, 2012). Marine ecosystem mod-elers now estimate multiple phytoplankton functional types (PFTs) within biogeochemical models, but until recently there existed very limited data with which to evaluate the modeled PFTs (Le Qu´er´e et al., 2005; Hood et al., 2006; Anderson, 2005; Buitenhuis et al., 2012b). Great promise lies with indirect estimates of phytoplankton classes from satellite retrievals. Fields of chlorophyll and/or biomass spe-cific to PFTs (Alvain et al., 2005, 2008; Raitsos et al., 2008; Demarcq et al., 2012) or to different size classes of phyto-plankton (Ciotti and Bricaud, 2006; Uitz et al., 2006; Hirata et al., 2008, 2011; Kostadinov et al., 2009; Brewin et al., 2010) can be quantified via remote sensing methods. How-ever, at present these methods lack sufficient global valida-tion datasets, and are restricted to the surface ocean.
Depth resolved phytoplankton community structure can be determined in field samples through electron or light
mi-croscopy, flow cytometry, genetic analysis or high perfor-mance liquid chromatography (HPLC). Microscopy and ge-nomics allow for direct identification of algal species and morphology; however, these methods are time-consuming for large-scale surveys, and certain types of taxa or features (e.g., flagella) may be lost or damaged depending on preser-vation and handling (Havskum et al., 2004). Flow cytome-try allows for high sample throughput and information on size and pigment content, but is limited to the smaller size classes of plankton (Li and Wood, 1988). On the contrary, HPLC allows for a high sample throughput and yields pig-ment concentrations covering all size ranges that may be chemotaxonomically interpreted to quantify marine phyto-plankton community composition (Mackey et al., 1996; Van den Meersche et al., 2008; Wright et al., 2010; Hirata et al., 2011). Furthermore, pigments are relatively frequently sam-pled during various oceanographic field campaigns. HPLC thus yields a data product with large potential, particularly given its advantage over satellite methods for resolving depth distribution.
Several of the major accessory pigments can provide a rough indication of the presence of specific taxonomic groups and size fractions (Vidussi et al., 2001), although a recent review has indicated that relatively few of these pig-ments are specific to individual phytoplankton taxa (Higgins et al., 2011). For this reason, methods employing the chemo-taxonomic identification of pigment ratios specific to algal classes are recommended for interpretation of pigment data. Identification usually involves a method that determines the overall pigment structure as a linear sum of contributions from all groups, and then attempts to estimate these con-tributions through an (inverse) optimization method, such as is implemented in the widely used CHEMTAX program (Mackey et al., 1996). Alternative, more direct, but also less quantitative methods include the association of PFTs with certain pigment ratios that are unique for a particular group (Claustre, 1994; Uitz et al., 2006). In all cases, the pigment data need to be of high quality and consistent across all con-sidered pigments.
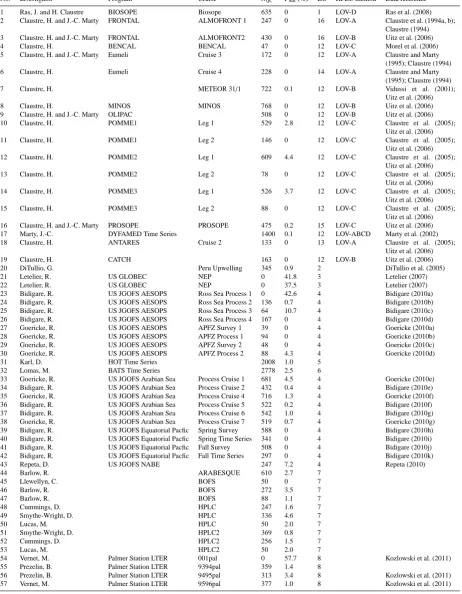
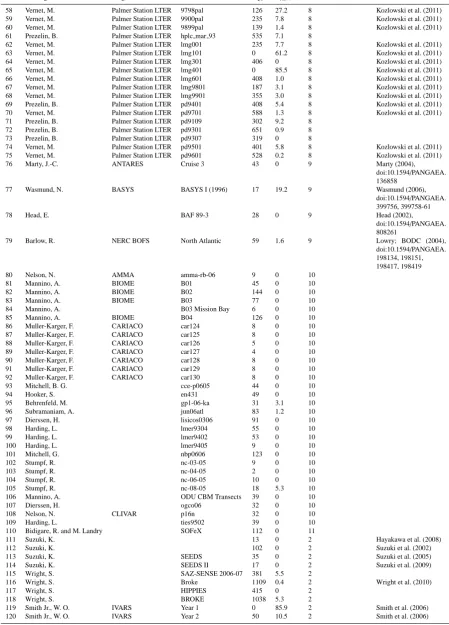
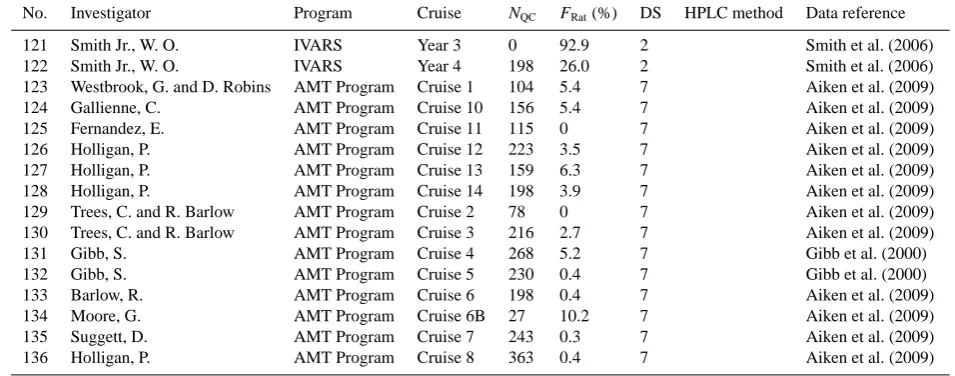
Table 1.Summary of pigment sample contributions to MAREDAT. NQCrepresents the number of quality-controlled samples each
contribu-tion submitted to the dataset. FRatrepresents the percentage of samples that were removed due to values outlying two standard deviations of
the TCHLA vs. TACC linear relation. DS represents the data source, for which numerical values correspond to definitions below the table.
No. Investigator Program Cruise NQC FRat(%) DS HPLC method Data reference 1 Ras, J. and H. Claustre BIOSOPE Biosope 635 0 1 LOV-D Ras et al. (2008) 2 Claustre, H. and J.-C. Marty FRONTAL ALMOFRONT 1 247 0 16 LOV-A Claustre et al. (1994a, b);
Claustre (1994) 3 Claustre, H. and J.-C. Marty FRONTAL ALMOFRONT2 430 0 16 LOV-B Uitz et al. (2006)
4 Claustre, H. BENCAL BENCAL 47 0 12 LOV-C Morel et al. (2006)
5 Claustre, H. and J.-C. Marty Eumeli Cruise 3 172 0 12 LOV-A Claustre and Marty (1995); Claustre (1994) 6 Claustre, H. Eumeli Cruise 4 228 0 14 LOV-A Claustre and Marty
(1995); Claustre (1994) 7 Claustre, H. METEOR 31/1 722 0.1 12 LOV-B Vidussi et al. (2001);
Uitz et al. (2006)
8 Claustre, H. MINOS MINOS 768 0 12 LOV-B Uitz et al. (2006)
9 Claustre, H. and J.-C. Marty OLIPAC 508 0 12 LOV-B Uitz et al. (2006) 10 Claustre, H. POMME1 Leg 1 529 2.8 12 LOV-C Claustre et al. (2005);
Uitz et al. (2006) 11 Claustre, H. POMME1 Leg 2 146 0 12 LOV-C Claustre et al. (2005);
Uitz et al. (2006) 12 Claustre, H. POMME2 Leg 1 609 4.4 12 LOV-C Claustre et al. (2005);
Uitz et al. (2006) 13 Claustre, H. POMME2 Leg 2 78 0 12 LOV-C Claustre et al. (2005);
Uitz et al. (2006) 14 Claustre, H. POMME3 Leg 1 526 3.7 12 LOV-C Claustre et al. (2005);
Uitz et al. (2006) 15 Claustre, H. POMME3 Leg 2 88 0 12 LOV-C Claustre et al. (2005);
Uitz et al. (2006) 16 Claustre, H. and J.-C. Marty PROSOPE PROSOPE 475 0.2 15 LOV-C Uitz et al. (2006) 17 Marty, J.-C. DYFAMED Time Series 1400 0.1 12 LOV-ABCD Marty et al. (2002) 18 Claustre, H. ANTARES Cruise 2 133 0 13 LOV-A Claustre et al. (2005);
Uitz et al. (2006)
19 Claustre, H. CATCH 163 0 12 LOV-B Uitz et al. (2006)
20 DiTullio, G. Peru Upwelling 345 0.9 2 DiTullio et al. (2005)
21 Letelier, R. US GLOBEC NEP 0 41.8 3 Letelier (2007)
22 Letelier, R. US GLOBEC NEP 0 37.5 3 Letelier (2007)
23 Bidigare, R. US JGOFS AESOPS Ross Sea Process 1 0 42.6 4 Bidigare (2010a) 24 Bidigare, R. US JGOFS AESOPS Ross Sea Process 2 136 0.7 4 Bidigare (2010b) 25 Bidigare, R. US JGOFS AESOPS Ross Sea Process 3 64 10.7 4 Bidigare (2010c) 26 Bidigare, R. US JGOFS AESOPS Ross Sea Process 4 167 0 4 Bidigare (2010d) 27 Goericke, R. US JGOFS AESOPS APFZ Survey 1 39 0 4 Goericke (2010a) 28 Goericke, R. US JGOFS AESOPS APFZ Process 1 94 0 4 Goericke (2010b) 29 Goericke, R. US JGOFS AESOPS APFZ Survey 2 48 0 4 Goericke (2010c) 30 Goericke, R. US JGOFS AESOPS APFZ Process 2 88 4.3 4 Goericke (2010d)
31 Karl, D. HOT Time Series 2008 1.0 5
32 Lomas, M. BATS Time Series 2778 2.5 6
33 Goericke, R. US JGOFS Arabian Sea Process Cruise 1 681 4.5 4 Goericke (2010e) 34 Bidigare, R. US JGOFS Arabian Sea Process Cruise 2 432 0.4 4 Bidigare (2010e) 35 Goericke, R. US JGOFS Arabian Sea Process Cruise 4 716 1.3 4 Goericke (2010f) 36 Bidigare, R. US JGOFS Arabian Sea Process Cruise 5 522 0.2 4 Bidigare (2010f) 37 Bidigare, R. US JGOFS Arabian Sea Process Cruise 6 542 1.0 4 Bidigare (2010g) 38 Goericke, R. US JGOFS Arabian Sea Process Cruise 7 519 0.7 4 Goericke (2010g) 39 Bidigare, R. US JGOFS Equatorial Pacfic Spring Survey 588 0 4 Bidigare (2010h) 40 Bidigare, R. US JGOFS Equatorial Pacfic Spring Time Series 341 0 4 Bidigare (2010i) 41 Bidigare, R. US JGOFS Equatorial Pacfic Fall Survey 508 0 4 Bidigare (2010j) 42 Bidigare, R. US JGOFS Equatorial Pacfic Fall Time Series 297 0 4 Bidigare (2010k)
43 Repeta, D. US JGOFS NABE 247 7.2 4 Repeta (2010)
44 Barlow, R. ARABESQUE 610 2.7 7
45 Llewellyn, C. BOFS 50 0 7
46 Barlow, R. BOFS 272 3.5 7
47 Barlow, R. BOFS 88 1.1 7
48 Cummings, D. HPLC 247 1.6 7
49 Smythe-Wright, D. HPLC 336 4.6 7
50 Lucas, M. HPLC 50 2.0 7
51 Smythe-Wright, D. HPLC2 369 0.8 7
52 Cummings, D. HPLC2 256 1.5 7
53 Lucas, M. HPLC2 50 2.0 7
54 Vernet, M. Palmer Station LTER 001pal 0 57.7 8 Kozlowski et al. (2011) 55 Prezelin, B. Palmer Station LTER 9394pal 359 1.4 8
112 J. Peloquin et al.: MAREDAT global HPLC pigment database
Table 1.Continued.
No. Investigator Program Cruise NQC FRat(%) DS HPLC method Data reference 58 Vernet, M. Palmer Station LTER 9798pal 126 27.2 8 Kozlowski et al. (2011) 59 Vernet, M. Palmer Station LTER 9900pal 235 7.8 8 Kozlowski et al. (2011) 60 Vernet, M. Palmer Station LTER 9899pal 139 1.4 8 Kozlowski et al. (2011) 61 Prezelin, B. Palmer Station LTER hplc mar 93 535 7.1 8
62 Vernet, M. Palmer Station LTER lmg001 235 7.7 8 Kozlowski et al. (2011) 63 Vernet, M. Palmer Station LTER lmg101 0 61.2 8 Kozlowski et al. (2011) 64 Vernet, M. Palmer Station LTER lmg301 406 0 8 Kozlowski et al. (2011) 65 Vernet, M. Palmer Station LTER lmg401 0 85.5 8 Kozlowski et al. (2011) 66 Vernet, M. Palmer Station LTER lmg601 408 1.0 8 Kozlowski et al. (2011) 67 Vernet, M. Palmer Station LTER lmg9801 187 3.1 8 Kozlowski et al. (2011) 68 Vernet, M. Palmer Station LTER lmg9901 355 3.0 8 Kozlowski et al. (2011) 69 Prezelin, B. Palmer Station LTER pd9401 408 5.4 8 Kozlowski et al. (2011) 70 Vernet, M. Palmer Station LTER pd9701 588 1.3 8 Kozlowski et al. (2011) 71 Prezelin, B. Palmer Station LTER pd9109 302 9.2 8
72 Prezelin, B. Palmer Station LTER pd9301 651 0.9 8 73 Prezelin, B. Palmer Station LTER pd9307 319 0 8
74 Vernet, M. Palmer Station LTER pd9501 401 5.8 8 Kozlowski et al. (2011) 75 Vernet, M. Palmer Station LTER pd9601 528 0.2 8 Kozlowski et al. (2011)
76 Marty, J.-C. ANTARES Cruise 3 43 0 9 Marty (2004),
doi:10.1594/PANGAEA. 136858
77 Wasmund, N. BASYS BASYS I (1996) 17 19.2 9 Wasmund (2006), doi:10.1594/PANGAEA. 399756, 399758-61
78 Head, E. BAF 89-3 28 0 9 Head (2002),
doi:10.1594/PANGAEA. 808261
79 Barlow, R. NERC BOFS North Atlantic 59 1.6 9 Lowry; BODC (2004), doi:10.1594/PANGAEA. 198134, 198151, 198417, 198419
80 Nelson, N. AMMA amma-rb-06 9 0 10
81 Mannino, A. BIOME B01 45 0 10
82 Mannino, A. BIOME B02 144 0 10
83 Mannino, A. BIOME B03 77 0 10
84 Mannino, A. B03 Mission Bay 6 0 10
85 Mannino, A. BIOME B04 126 0 10
86 Muller-Karger, F. CARIACO car124 8 0 10
87 Muller-Karger, F. CARIACO car125 8 0 10
88 Muller-Karger, F. CARIACO car126 5 0 10
89 Muller-Karger, F. CARIACO car127 4 0 10
90 Muller-Karger, F. CARIACO car128 8 0 10
91 Muller-Karger, F. CARIACO car129 8 0 10
92 Muller-Karger, F. CARIACO car130 8 0 10
93 Mitchell, B. G. cce-p0605 44 0 10
94 Hooker, S. en431 49 0 10
95 Behrenfeld, M. gp1-06-ka 31 3.1 10
96 Subramaniam, A. jun06atl 83 1.2 10
97 Dierssen, H. lisicos0306 91 0 10
98 Harding, L. lmer9304 55 0 10
99 Harding, L. lmer9402 53 0 10
100 Harding, L. lmer9405 9 0 10
101 Mitchell, G. nbp0606 123 0 10
102 Stumpf, R. nc-03-05 9 0 10
103 Stumpf, R. nc-04-05 2 0 10
104 Stumpf, R. nc-06-05 10 0 10
105 Stumpf, R. nc-08-05 18 5.3 10
106 Mannino, A. ODU CBM Transects 39 0 10
107 Dierssen, H. ogco06 32 0 10
108 Nelson, N. CLIVAR p16n 32 0 10
109 Harding, L. ties9502 39 0 10
110 Bidigare, R. and M. Landry SOFeX 112 0 11
111 Suzuki, K. 13 0 2 Hayakawa et al. (2008)
112 Suzuki, K. 102 0 2 Suzuki et al. (2002)
113 Suzuki, K. SEEDS 35 0 2 Suzuki et al. (2005)
114 Suzuki, K. SEEDS II 17 0 2 Suzuki et al. (2009)
115 Wright, S. SAZ-SENSE 2006-07 381 5.5 2
116 Wright, S. Broke 1109 0.4 2 Wright et al. (2010)
117 Wright, S. HIPPIES 415 0 2
118 Wright, S. BROKE 1038 5.3 2
Table 1.Continued.
No. Investigator Program Cruise NQC FRat(%) DS HPLC method Data reference
121 Smith Jr., W. O. IVARS Year 3 0 92.9 2 Smith et al. (2006)
122 Smith Jr., W. O. IVARS Year 4 198 26.0 2 Smith et al. (2006)
123 Westbrook, G. and D. Robins AMT Program Cruise 1 104 5.4 7 Aiken et al. (2009)
124 Gallienne, C. AMT Program Cruise 10 156 5.4 7 Aiken et al. (2009)
125 Fernandez, E. AMT Program Cruise 11 115 0 7 Aiken et al. (2009)
126 Holligan, P. AMT Program Cruise 12 223 3.5 7 Aiken et al. (2009)
127 Holligan, P. AMT Program Cruise 13 159 6.3 7 Aiken et al. (2009)
128 Holligan, P. AMT Program Cruise 14 198 3.9 7 Aiken et al. (2009)
129 Trees, C. and R. Barlow AMT Program Cruise 2 78 0 7 Aiken et al. (2009)
130 Trees, C. and R. Barlow AMT Program Cruise 3 216 2.7 7 Aiken et al. (2009)
131 Gibb, S. AMT Program Cruise 4 268 5.2 7 Gibb et al. (2000)
132 Gibb, S. AMT Program Cruise 5 230 0.4 7 Gibb et al. (2000)
133 Barlow, R. AMT Program Cruise 6 198 0.4 7 Aiken et al. (2009)
134 Moore, G. AMT Program Cruise 6B 27 10.2 7 Aiken et al. (2009)
135 Suggett, D. AMT Program Cruise 7 243 0.3 7 Aiken et al. (2009)
136 Holligan, P. AMT Program Cruise 8 363 0.4 7 Aiken et al. (2009)
Data sources:1http://www.obs-vlfr.fr/proof/vt/op/ec/biosope/bio.htm,2Personal communication,3http://globec.whoi.edu/jg/dir/globec/nep/ccs/process/, 4http://usjgofs.whoi.edu/jg/dir/jgofs/,5http://hahana.soest.hawaii.edu/hot/,6http://bats.bios.edu/bats form bottle.html,7http://www.bodc.ac.uk/, 8http://pal.lternet.edu/data/,9http://www.pangaea.de/,10http://seabass.gsfc.nasa.gov/seabasscgi/archive index.cgi,11http://ocb.whoi.edu/sofex.html, 12LOV, H. Claustre and J. Uitz, personal communication, 2008,13http://www.obs-vlfr.fr/cd rom dmtt/an main.htm,
14http://www.obs-vlfr.fr/cd rom dmtt/eu main.htm,15http://www.obs-vlfr.fr/cd rom dmtt/pr main.htm,16http://www.obs-vlfr.fr/cd rom dmtt/fr main.htm.
fucoxanthin, lutein, peridinin, prasinoxanthin, violaxanthin and zeaxanthin) in varying proportions within samples, and in varying locations, depths, and months among samples. This suggests the utility of MAREDAT’s pigment database for assessing regional, vertical and seasonal scales of phyto-plankton community structure and succession.
The following sections describe the data distributions and quality control procedures pertaining to the MAREDAT pig-ment database. Overall, we intend for the data to be readily exploited by the observational, modeling, and remote sensing communities to deepen understanding of the temporal and spatial diversity of primary producers in the ocean, and the consequences for global carbon fixation.
2 Methods
2.1 HPLC analytical methods
The majority of the HPLC data in the database were ana-lyzed following standard protocols, with details provided in the original publications (Table 1). The method employed by the Laboratoire d’Oc´eanographie de Villefranche has not been previously described in detail, and is therefore elabo-rated here.
Generally, 2.8 L of seawater were filtered onto GF/F What-man 25 mm filters and frozen until analysis. Prior to 2002, samples were frozen in liquid nitrogen onboard ship, and then at−20◦C prior to analysis. After 2002, samples were
frozen at−80◦C until analysis. All samples were extracted
in 100 % methanol; however, four different analytical pro-tocols (LOV-A, B, C and D) have been applied at the LOV since 1990. Method LOV-A is described in Mantoura and
Llewellyn (1983) with gradient elution as in Williams and Claustre (1991). This reversed-phase C18 method only al-lowed for a partial resolution of divinyl chlorophyll a (DV Chl a) from chlorophyll a (Chl a). Method LOV-B, based on a reversed phase C8 column, has been described by Vidussi et al. (1996). It is characterized by complete res-olution between DV Chl a and Chl a and partial resolu-tion between zeaxanthin (Zeax) and lutein (Lut). Method LOV-C is a modified version of the Vidussi et al. (1996) method and is described by Claustre et al. (2004). It is characterized by a significant gain in sensitivity. How-ever, inaccuracies with this method arise due to coelution of 19’-hexanoyloxyfucoxanthin (19Hex) and prasinoxanthin (Pras) peaks. Method LOV-D (associated with the BIOSOPE cruise) is a modified version of the C8 reversed phase Van Heukelem and Thomas (2001) method. It is described by Ras et al. (2008) and is characterized by its capacity for quantify-ing more than 26 pigments, and for its good resolution of the Zeax/Lut and 19Hex/Pras pairs. Before their submission to MAREDAT, the data underwent quality control procedures including comparison to CTD fluorescence data, detection and elimination of outliers and visual control of each vertical profile.
114 J. Peloquin et al.: MAREDAT global HPLC pigment database
Figure 1.Surface locations of MAREDAT pigment samples that
passed quality control (35 634 samples).
BIOSOPE project (Hooker et al., 2009). During the round-robins, the participating laboratories analyzed several series of triplicate samples, resulting in a level of performance as-sociated with each laboratory for a given type of sample. The primary objectives of SeaHARRE were to achieve, with re-gard to the Sea-viewing Wide Field of View Sensor (SeaW-iFS) Project, the pigment accuracy range of 20–25 %, with a 15 % range for significant algorithm refinement. Most of the participants have been within the latter range whether in coastal or offshore waters, and the successive SeaHARRE exercises progressively resulted in the improvement of the different methodologies in order to satisfy a number of qual-ity criteria, to reduce uncertainties and to reach optimal per-formance metrics. Hence, on an international basis, since the LOV-D method was developed for the BIOSOPE cruise, the analytical performance of the LOV has been ranked “state of the art” (Hooker et al., 2005, 2009, 2010). Further, the LOV dataset will be regularly updated in the future with the grow-ing amount of data (see Appendix A1).
2.2 Quality control for the MAREDAT pigment database
Marine HPLC measurements from samples taken at various depths and locations around the globe were collected from individual investigators and online data repositories for the individual field campaigns summarized in Table 1. Sampling years spanned from 1989 to 2008. The full suite of pigments available from each contribution was collected in order to conduct the quality control (QC) analysis. QC procedures followed the protocols of Trees et al. (2000) and Uitz et al. (2006) for data compilations involving contributions from multiple institutes, technicians, and methodologies. A total number of 40 536 discrete samples from 136 field surveys were initially compiled for MAREDAT. The geographic lo-cations of the data that passed the full QC analysis are illus-trated in Fig. 1.
The first measure of QC flagged samples (“FTC”) in which total Chl a concentration (TCHLA; mg m−3) was zero or less (n=352), an indication that pigment concentrations were at or below HPLC instrumental detection limits, and thus not
log10 (TACC) = log10 (TCHLA) 0.92 + 0.03
r2 = 0.89, p = 0, n = 38221
log
10
(T
AC
C
/
(mg
m
-3 ))
log10 (TCHLA / (mg m-3))
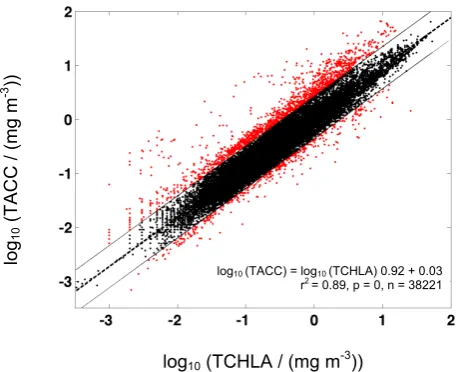
Figure 2. Linear relation between log-normalized total
chloro-phyll a (TCHLA; mg m−3) and total accessory pigment (TACC;
mg m−3) concentrations. Data (n=38 221) are exclusive of samples
already flagged for TCHLA values of zero, or for having less than four non-zero accessory pigments. The central dashed line is the fit (log10(TACC)=log10(TCHLA) (0.92)+0.03; r2=0.89, p=0, n=38 221). Solid lines represent ±two standard deviations from the regression, beyond which outlying data points (shown in red) were flagged (“FRat”, n=2001).
resolvable in the sample. TCHLA encompassed all reported Chl a derivatives, including divinyl chlorophyll a, epimers, allomers, and chlorophyllide a. The second QC procedure flagged samples (“FTA”) for which fewer than four non-zero accessory pigments were reported (n=2306), as prior work has indicated that most algal types possess at least four ac-cessory pigments detectable by HPLC (Trees et al., 2000). The third QC measure was based on the log-linear relation-ship between TCHLA and total accessory pigment concen-tration (TACC). TACC included photosynthetic carotenoids (19’-butanoyloxyfucoxanthin, 19’-hexanoyloxyfucoxanthin, fucoxanthin, peridinin, prasinoxanthin) and photoprotec-tive carotenoids (alloxanthin, diadinoxanthin, diatoxanthin, lutein, neoxanthin, violaxanthin, zeaxanthin, and carotenes), chlorophylls b and c, and phaeopigments. Log transforma-tion was appropriate for the regression as TCHLA varies by over four orders of magnitude globally (Campbell, 1995; Yo-der et al., 1993). This QC criterion was built on the observa-tion that phytoplankton maintain a relatively close ratio be-tween their ancillary pigment and total Chl a concentrations as a consequence of photoacclimation (Trees et al., 2000). The least-squares log-linear fit between TCHLA and TACC (log10 (TACC) = log10 (TCHLA) (0.92)+0.03; r2=0.89;
<
>
Figure 3. The percent of observations that were flagged due
to each quality control measure (exclusive of samples already flagged “FTC” for TCHLA≤0) as a function of (a) depth (m) and (b) TCHLA (mg m−3). F
TAindicates samples flagged for having less
than four non-zero accessory pigments; FRat indicates regression
outliers of the TACC vs. TCHLA relationship; and FCr indicates
samples for which an entire cruise was flagged due to 35 % or more of the cruise samples acquiring FRatflags.
Samples that fell outside the range of two standard de-viations of the regression line were flagged (“FRat”; n= 2001). The criterion of two standard deviations was chosen to evaluate outlying (i.e., potentially erroneous) measurements without compromising observation of the natural fluctuation about the mean relationship (Uitz et al., 2006). As a final QC criterion, if more than 35 % of samples from a given field campaign (e.g., cruise or time series) was flagged during the third QC step, the entire campaign’s samples were flagged (“FCr”). This argument was based on the result of applying Chauvenet’s criterion (Buitenhuis et al., 2012b) to the cruise percentages of FRatflags, which identified 8 outlying cruises, thus flagging an additional 589 samples (Table 1). Overall, 4902 samples were flagged in the QC process, representing 12.1 % of the original collection. The resulting MAREDAT pigment database thus contains 35 634 high quality HPLC pigment measurement suites.
There is a clear trend of increased frequency of flagged samples with increased sample depth, mostly driven by the increase in FTAflags with depth (Fig. 3a). This is consistent with pigment concentrations decreasing to detection limits well below the base of the euphotic zone. The frequency of
FRat, the flag most closely related to HPLC analytical uncer-tainty (Trees et al., 2000), occurs roughly in proportion to TCHLA, indicating that analytical fidelity is not specifically biased toward low or high chlorophyll levels except within the minimum TCHLA bin (Fig. 3b).
a)
b)
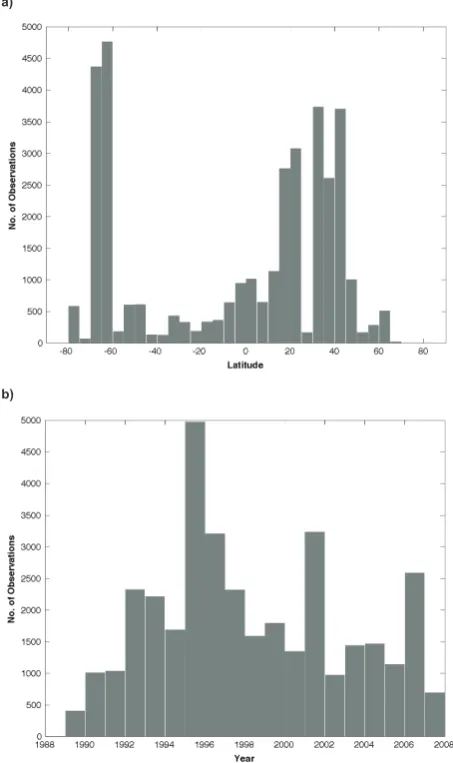
Figure 4.Number of MAREDAT TCHLA observations as a
func-tion of (a) latitude and (b) year.
3 Results
3.1 Properties of the quality-controlled MAREDAT pigment database
116 J. Peloquin et al.: MAREDAT global HPLC pigment database
Table 2.Summary of key diagnostic phytoplankton HPLC pigments (adapted from Vidussi et al., 2001): pigment name, common
abbrevia-tion, associated taxonomic group and typical size class. For more detailed taxonomic associations and definitions, see Higgins et al. (2011). Pigment Abbreviation Taxonomic significance Approximate cell
size range (µm) Zeaxanthin Zeax Cyanobacteria and prochlorophytes <2 Divinyl chlorophyll a DV Chl a Prochlorococcus spp. <2 Chlorophyll b+Divinyl chlorophyll b TChl b Prochlorococcus spp. and green flagellates <2 19’-hexanoyloxyfucoxanthin 19Hex Chromophytes and nanoflagellates 2–20 19’-butanoyloxyfucoxanthin 19But Chromophytes and nanoflagellates 2–20 Alloxanthin Allox Cryptophytes 2–20 Fucoxanthin Fuco Diatoms and haptophytes 2–20 Peridinin Peri Dinoflagellates (Type 1) >20
both hemispheres. The higher variability in chlorophyll con-centration in the Northern Hemisphere than Southern Hemi-sphere during each season as seen from ocean color observa-tions (Yoder et al., 1993) is also represented by the MARE-DAT chlorophyll data (Fig. 5a and b). This relatively lower annual chlorophyll variability in the Southern Hemisphere is due to large areas of Southern Ocean iron depletion limit-ing the sprlimit-ing phytoplankton blooms (Behrenfeld and Kol-ber, 1999).
To further assess the quality, range and representation of Chl a measurements in the MAREDAT pigment dataset, we compare TCHLA with remotely sensed chlorophyll. We extracted climatological mean, 9 km-resolution chlorophyll data from NASA’s SeaWiFS archive for the years 2000– 2007 (http://oceandata.sci.gsfc.nasa.gov/SeaWiFS/L3SMI/). The extracted chlorophyll data were re-gridded to 1×1◦. The
mean TCHLA value for the upper 20 m from the MARE-DAT archive (1989–2008) was computed and also re-gridded to 1×1◦. The log-transformed SeaWiFS and MAREDAT
TCHLA means show generally good agreement (r2=0.5,
p<0.001, n=1325; Fig. 6a–b), given that the predictive ca-pacity of SeaWiFS decreases above 50◦latitude (Yoder et al., 1993). Linear regression of the two properties approximates a 1 : 1 relationship (log10 TCHLASeaWiFS=−0.29+log10 TCHLAMAREDAT·0.97). Higher correlation between MARE-DAT and SeaWiFS TCHLA is observed when data from the polar/subpolar latitudes are excluded (i.e., r2=0.7 for data within 40◦S–40◦N), which is consistent with
previ-ous comparisons of ocean color and field estimates (Siegel et al., 2005). Furthermore, the median value (0.23 mg m−3) and range in TCHLA (0.001–92.41 mg m−3) from MARE-DAT compare well with the median (0.20 mg m−3) and range (0.01–99.24 mg m−3) in chlorophyll from the SeaWiFS cli-matology. It must be noted that the SeaWiFS algorithms were likely calibrated with some of the data subsets listed herein. Nonetheless, the substantial number of data considered in this exercise supports the conclusion that there is no signifi-cant representation bias of chlorophyll a within MAREDAT. The pigment database covers the global spatiotemporal
dy-namics of phytoplankton biomass in the global ocean rea-sonably well.
3.2 Distribution of accessory pigments
The number of samples within the MAREDAT pigment database that contribute to the distribution of each of the ac-cessory pigments is not equal (Fig. 7), as we did not dis-criminate against contributions without a full suite of acces-sory pigments. The concentration of chlorophyll a (Fig. 7a) and the key accessory pigments (Fig. 7b–l) generally exhibit a log-normal distribution about their mean. The DV Chl a distribution has the fewest observations (Fig. 7f), potentially because this pigment is not routinely measured during HPLC analysis on high latitude samples.
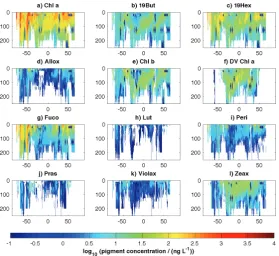
Figure 8 displays surface concentrations (as the average over the upper 20 m) of the main taxonomic pigments from the entire MAREDAT dataset. Figure 9 displays the zonal annual mean depth distributions for the upper 250 m, also using the entire dataset for averaging. Interpretation of the pigment data in terms of phytoplankton taxonomy (e.g., us-ing an inverse method such as CHEMTAX) is beyond the scope of this ESSD paper. It should also be noted that cau-tion must be exercised when using a single pigment distribu-tion as an unambiguous marker for a given algal taxon (Hig-gins et al., 2011). For example, the distribution of 19Hex, once proposed as relatively indicative of autotrophic flagel-lates from the nanoplankton size class (Vidussi et al., 2001), is now thought to arise from many phytoplankton sources (Higgins et al., 2011), and is characterized by a rather ubiq-uitous global distribution (Liu et al., 2009). This conclusion is further supported by the relatively homogenous spatial dis-tribution of 19Hex from MAREDAT (Figs. 8c and 9c).
Recognizing the aforementioned precautions, it is never-theless interesting to consider the distributions of a few key accessory pigments within MAREDAT that may serve as rel-ative markers for the broader phytoplankton groups given in Table 2 (adapted from Vidussi et al., 2001). For example, DV Chl a, which is indicative of the presence of
Figure 5.Seasonal distribution of MAREDAT TCHLA values (mg m−3) for the (a) Northern and (b) Southern hemispheres. Data from the
equator are included in the Northern Hemisphere panel.
log
10
(T
C
H
LA
/ (
mg
m
-3 ))
a) SeaWiFS mean mean
a) n
b) HPLC mean
Figure 6.(a) Climatological mean (2000–2007) chlorophyll a
con-centration (mg m−3) from SeaWiFS (scaled to 1◦
resolution) and
(b) surface TCHLA (mg m−3) from MAREDAT (averaged over the
upper 20 m and scaled to 1◦
resolution.)
the tropical regions of the eastern Pacific and Indian oceans (Figs. 8f and 9f). This finding is consistent with prior reports on Prochlorococcus spp. distributions based on cell counts (Goericke et al., 2000; Buitenhuis et al., 2012a). Similarly, fucoxanthin (Fuco) is widely considered to be diagnostic of diatoms in regions where diatoms dominate the autotrophic abundance (e.g., high latitude productive areas; Wright et al., 2010), and accordingly the MAREDAT data show a bias for Fuco toward polar regions (Figs. 8g and 9g, respectively). Finally, the MAREDAT pigment dataset shows that Zeax is relatively confined to the warm tropical and subtropical
wa-ters of each basin (Figs. 8l and 9l). Zeax roughly marks the presence of cyanobacteria, which are recognized dominants in these lower latitude regions (Claustre and Marty, 1995; Vidussi et al., 2001; see also global biomass assessment of
Synechococcus and Prochlorococcus spp. in Buitenhuis et
al., 2012a).
4 Recommendations for use
118 J. Peloquin et al.: MAREDAT global HPLC pigment database
log10 (pigment concentration / (ng L-1))
No. of Observations
Figure 7. Number of MAREDAT pigment observations as a function of concentration (ng L−1): (a) chlorophyll a (Chl a), (b)
19’-butanoyloxyfucoxanthin (19But), (c) 19’-hexanoyloxyfucoxanthin (19Hex), (d) alloxanthin (Allox), (e) chlorophyll b (Chl b), (f) divinyl chlorophyll a (DV Chl a), (g) fucoxanthin (Fuco), (h) lutein (Lut), (i) peridinin (Peri), (j) prasinoxanthin (Pras), (k) violaxanthin (Violax) and (l) zeaxanthin (Zeax).
Figure 8. Pigment concentrations (ng L−1) from MAREDAT averaged over the upper 20 m: (a) chlorophyll a (Chl a), (b)
Figure 9.Zonal annual mean depth profiles of MAREDAT pigment concentrations (ng L−1) as a function of latitude: (a) chlorophyll a (Chl a), (b) 19’-butanoyloxyfucoxanthin (19But), (c) 19’-hexanoyloxyfucoxanthin (19Hex), (d) alloxanthin (Allox), (e) chlorophyll b (Chl b), (f)
di-vinyl chlorophyll a (DV Chl a), (g) fucoxanthin (Fuco), (h) lutein (Lut), (i) peridinin (Peri), (j) prasinoxanthin (Pras), (k) violaxanthin (Violax) and (l) zeaxanthin (Zeax). The gridded data product (see Appendix A2: netCDF product) was used to compute the zonal and the annual mean (from 1◦
monthly mean climatologies).
Ideal applications for chemotaxonomic workup results of the MAREDAT data are to (a) better ground-truth satellite estimates of phytoplankton functional types or size fractions, (b) determine biological niches in the ocean from phyto-plankton community structure, and (c) evaluate MAREDAT-based results against output from ecosystem models that translate physiological observations into phytoplankton com-munity distributions. While climatological mean Chl a sig-nals from both MAREDAT and SeaWiFS are in good agree-ment, chlorophyll and accessory pigment concentrations in a given region vary widely in time, especially in areas with large seasonality in phytoplankton composition (Yoder et al., 1993). Thus, if results from MAREDAT pigment analysis are to be used for model comparisons, a point-to-point evaluation by month is recommended.
The MAREDAT pigment database is viewed as a living dataset, with the expectation of new HPLC data contribu-tions and improvements in the future. We anticipate that new product-specific datasets, such as those forming the MARE-DAT initiative, will permit exciting synergies and scientific gains across several disciplines.
Appendix A
A1 Data table
A full data table containing all pigment suites can be down-loaded from the data archive PANGAEA: http://doi.pangaea. de/10.1594/PANGAEA.793246. The data file contains lon-gitude, latitude, depth, sampling date and time, total chloro-phyll a and total accessory pigment concentrations, the in-dividual pigment concentrations, all quality flags, as well as the full data references. As a subset, a distinct archive ref-erence is dedicated to the dataset originating from the LOV: http://doi.pangaea.de/10.1594/PANGAEA.808535.
A2 Gridded netCDF product
HPLC-derived pigment concentrations (chlorophyll a, 19’-butanoyloxyfucoxanthin, 19’-hexanoyloxyfucoxanthin, al-loxanthin, chlorophyll b, divinyl chlorophyll a, fucoxanthin, lutein, peridinin, prasinoxanthin, violaxanthin, and zeaxan-thin) have been gridded onto a 360×180◦grid, with a vertical
120 J. Peloquin et al.: MAREDAT global HPLC pigment database
netCDF file can also be downloaded at http://doi.pangaea. de/10.1594/PANGAEA.793246.
Acknowledgements. J. Peloquin, C. Swan, N. Gruber and
M. Vogt were funded by ETH Z¨urich. C. O’Brien has received funding from the European Community’s Seventh Framework Programme (FP7 2007–2013) under grant agreement no. 238366. We are grateful to two anonymous reviewers for their evaluation of this manuscript. We thank Erik Buitenhuis for producing the gridded netCDF product, Stephane Pesant for archiving the data on www.Pangaea.de, and Dave Carlson and Hans Pfeiffenberger at ESSD for their patience. We would like to further acknowledge Gerald Moore, Denise Cummings, Tony Knap, Dave Robins, Dave Suggett and Guy Westbrook for their HPLC data contributions. We are equally grateful for all the project PIs who contributed data, as well as for the anonymous staffwho took part in the sampling work during the cruises, who carried out the HPLC analysis, and without whom the construction of such a database would not have been possible. Most of the data from the LOV database were acquired as part of the French national programs JGOFS-France, PROOF and CYBER, which were funded by CNRS-INSU.
Edited by: S. Pesant
References
Aiken, J., Pradhan, Y., Barlow, R., Lavender, S., Poulton, A., Hol-ligan, P., and Hardman-Mountford, N.: Phytoplankton pigments and functional types in the Atlantic Ocean: A decadal assess-ment, 1995–2005. Deep-Sea Res. Pt. II, 56, 899–917, 2009. Alvain, S., Moulin, C., Dandonneau, Y., and Br´eon, F.: Remote
sensing of phytoplankton groups in case I waters from global SeaWiFS imagery, Deep-Sea Res. Pt. I, 52, 1989–2004, 2005. Alvain, S., Moulin, C., Dandonneau, Y., and Loisel, H.: Seasonal
distribution and succession of dominant phytoplankton groups in the global ocean: A satellite view, Global Biogeochem. Cy., 22, GB3001, doi:10.1029/2007GB003154, 2008.
Andersen, R., Bidigare, R., Keller, M., and Latasa, M.: A compar-ison of HPLC signatures and electron microscopic observations for oligotrophic waters of the North Atlantic and Pacific Oceans, Deep-Sea Res., 43, 517–537, 1996.
Anderson, T. R.: Plankton functional type modelling: running before we can walk?, J. Plankton Res., 27, 1073–1081, doi:10.1093/plankt/fbi076, 2005.
Behrenfeld, M. J. and Kolber, Z. S.: Widespread iron limitation of phytoplankton in the South Pacific ocean, Science, 283, 840– 843, 1999.
Bidigare, R.: “HPLC Pigments.” Ocean Carbon and Biogeochem-istry Data System, OCB DMO, WHOI, iPub: 19 May 1999, http://usjgofs.whoi.edu/jg/dir/jgofs/southern/nbp96 4A/, last ac-cess: July 2010a.
Bidigare, R.: “HPLC Pigments.” Ocean Carbon and Biogeochem-istry Data System, OCB DMO, WHOI, iPub: 19 May 1999, http://usjgofs.whoi.edu/jg/dir/jgofs/southern/nbp97 1/, last ac-cess: July 2010b.
Bidigare, R.: “HPLC Pigments.” Ocean Carbon and Biogeochem-istry Data System, OCB DMO, WHOI, iPub: 20 May 1999,
http://usjgofs.whoi.edu/jg/dir/jgofs/southern/nbp97 3/, last ac-cess: July 2010c.
Bidigare, R.: “HPLC Pigments.” Ocean Carbon and Biogeochem-istry Data System, OCB DMO, WHOI, iPub: 20 March 1999, http://usjgofs.whoi.edu/jg/dir/jgofs/southern/nbp97 8/, last ac-cess: July 2010d.
Bidigare, R.: “HPLC Pigments and HPLC PigmentsTM.”, Ocean Carbon and Biogeochemistry Data System, OCB DMO, WHOI, iPub: 8 May 2001, http://usjgofs.whoi.edu/jg/dir/jgofs/arabian/ ttn-045/, last access: July 2010e.
Bidigare, R.: “HPLC Pigments and HPLC PigmentsPP.” Ocean Car-bon and Biogeochemistry Data System, OCB DMO, WHOI, iPub: 8 May 2001, http://usjgofs.whoi.edu/jg/dir/jgofs/arabian/ ttn-050/, last access: July 2010f.
Bidigare, R.: “HPLC Pigments.” Ocean Carbon and Biogeochem-istry Data System, OCB DMO, WHOI, iPub: 8 May 2001, http:
//usjgofs.whoi.edu/jg/dir/jgofs/arabian/ttn-053/, last access: July 2010g.
Bidigare, R.: “Pigments.” Ocean Carbon and Biogeochemistry Data System, OCB DMO, WHOI, iPub: 24 April 1995, http://usjgofs. whoi.edu/jg/dir/jgofs/eqpac/tt007/, last access: July 2010h. Bidigare, R.: “Pigments.” Ocean Carbon and Biogeochemistry Data
System, OCB DMO, WHOI, iPub: 24 June 2002, http://usjgofs. whoi.edu/jg/dir/jgofs/eqpac/tt008/, last access: July 2010i. Bidigare, R.: “Pigments.” Ocean Carbon and Biogeochemistry Data
System, OCB DMO, WHOI, iPub: 24 June 2002, http://usjgofs. whoi.edu/jg/dir/jgofs/eqpac/tt11/, last access: July 2010j. Bidigare, R.: “Pigments.” Ocean Carbon and Biogeochemistry Data
System, OCB DMO, WHOI, iPub: 24 June 2002, http://usjgofs. whoi.edu/jg/dir/jgofs/eqpac/tt12/, last access: July 2010k. Brewin, R., Lavendar, S., Hardman-Mountford, N., and Hirata,
T.: A spectral response approach for detecting dominant phyto-plankton size class from satellite remote sensing, Acta Oceanol. Sin., 29, 14–32, 2010.
Buitenhuis, E. T., Li, W. K. W., Vaulot, D., Lomas, M. W., Landry, M. R., Partensky, F., Karl, D. M., Ulloa, O., Camp-bell, L., Jacquet, S., Lantoine, F., Chavez, F., Macias, D., Gos-selin, M., and McManus, G. B.: Picophytoplankton biomass dis-tribution in the global ocean, Earth Syst. Sci. Data, 4, 37–46, doi:10.5194/essd-4-37-2012, 2012a.
Buitenhuis, E. T., Vogt, M., Moriarty, R., Bednarˇsek, N., Doney, S. C., Leblanc, K., Le Qu´er´e, C., Luo, Y.-W., O’Brien, C., O’Brien, T., Peloquin, J., Schiebel, R., and Swan, C.: MAREDAT: to-wards a World Ocean Atlas of MARine Ecosystem DATa, Earth Syst. Sci. Data Discuss., 5, 1077–1106, doi:10.5194/ essdd-5-1077-2012, 2012b.
Campbell, J.: The lognormal distribution as a model for bio-optical variability in the sea, J. Geophys. Res., 100, 13237–13254, 1995. Ciotti, A. and Bricaud, A.: Retrievals of a size parameter for phyto-plankton and spectral light absorption by coloured detrital matter from water-leaving radiances at SeaWiFS channels in a continen-tal shelf offBrazil, Limnol. Oceanogr.-Meth., 4, 237–253, 2006. Claustre, H.: Phytoplankton pigment signatures of the trophic status in various oceanic regimes, Limnol. Oceanogr., 39, 1206–1211, 1994.
Claustre, H., Kerherv´e, P., Marty, J.-C., and Prieur, L.: Phytoplank-ton photoadaptation in relation to some frontal physical pro-cesses, J. Marine Syst., 5, 251–265, 1994a.
Claustre, H., Kerherv´e, P., Marty, J.-C., Prieur, L., Videau, C., and Hecq, J.: Phytoplankton distribution associated with a geostrophic front : ecological and biogeochemical implications, J. Mar. Res., 52, 711–742, 1994b.
Claustre, H., Hooker, S., Van Heukelem, L., Berthond, J.-F., Bar-lowe, R., Ras, J., Sessions, H., Targa, C., Thomas, C., van der Linded, D., and Marty, J.-C.: An intercomparison of HPLC phy-toplankton pigment methods using in situ samples: application to remote sensing and database activities, Mar. Chem., 85, 41–61, 2004.
Claustre, H., Babin, M., Merien, D., Ras, J., Prieur, L., Dallot, S., Prasil, O., Dousova, H., and Moutin, T.: Towards a taxon-specific parameterization of bio-optical models of primary production: a case study in the North Atlantic, J. Geophys. Res., 110, C07S12, doi:10.1029/2004JC002634, 2005.
Demarcq, H., Reygondeau, G., Alvain, S., and Vantrepotte, V.: Monitoring marine phytoplankton seasonality from space, Re-mote. Sens. Environ., 117, 211–222, 2012.
DiTullio, G., Geesey, M., Maucher, J., Alm, M., Riseman, S., and Bruland, K.: Influence of iron on algal community composition and physiological status in the Peru upwelling system, Limnol. Oceanogr., 50, 1887–1907, 2005.
Doney, S., Lima, I., Moore, J., Lindsay, K., Behrenfeld, M., Westberry, T., Mahowald, N., Glover, D., and Takahashi, T.: Skill metrics for confronting global upper ocean ecosystem-biogeochemistry models against field and remote sensing data, J. Marine Syst., 76, 950–112, 2009.
Gibb, S. Barlow, R., Cummings, D., Rees, N., Trees, C., Holli-gan, P., and Suggett, D.: Surface phytoplankton pigment distri-butions in the Atlantic Ocean: an assessment of basin scale vari-ability between 50◦
N and 50◦
S, Prog. Oceanogr., 45, 339–368, doi:10.1016/S0079-6611(00)00007-0, 2000.
Goericke, R.: “HPLC Pigments.” Ocean Carbon and Biogeochem-istry Data System, OCB DMO, WHOI, iPub: 14 Septem-ber 2001, http://usjgofs.whoi.edu/jg/dir/jgofs/southern/rr-kiwi 6/, last access: July 2010a.
Goericke, R.: “HPLC Pigments.” Ocean Carbon and Biogeochem-istry Data System, OCB DMO, WHOI, iPub: 19 May 1999, http://usjgofs.whoi.edu/jg/dir/jgofs/southern/rr-kiwi 7/, last ac-cess: July 2010b.
Goericke, R.: “HPLC Pigments.” Ocean Carbon and Biogeochem-istry Data System, OCB DMO, WHOI, iPub: 19 May 1999, http://usjgofs.whoi.edu/jg/dir/jgofs/southern/rr-kiwi 8/, last ac-cess: July 2010c.
Goericke, R.: “HPLC Pigments.” Ocean Carbon and Biogeochem-istry Data System, OCB DMO, WHOI, iPub: 24 August 2001, http://usjgofs.whoi.edu/jg/dir/jgofs/southern/rr-kiwi 8/, last ac-cess: July 2010d.
Goericke, R.: “HPLC Pigments.” Ocean Carbon and Biogeochem-istry Data System, OCB DMO, WHOI, iPub: 9 April 2002, http://usjgofs.whoi.edu/jg/dir/jgofs/arabian/ttn-043/, last access: July 2010e.
Goericke, R.: “HPLC Pigments.” Ocean Carbon and Biogeochem-istry Data System, OCB DMO, WHOI, iPub: 9 April 2002, http://usjgofs.whoi.edu/jg/dir/jgofs/arabian/ttn-049/, last access: July 2010f.
Goericke, R.: “HPLC Pigments.” Ocean Carbon and Biogeochem-istry Data System, OCB DMO, WHOI, iPub: 23 August 2001, http://usjgofs.whoi.edu/jg/dir/jgofs/arabian/ttn-054/, last access: July 2010g.
Goericke, R. and Montoya, J.: Estimating the contribution of mi-croalgal taxa to chlorophyll a in the field – variations of pigment ratios under nutrient- and light-limited growth, Mar. Ecol.-Prog. Ser., 169, 97–112, 1998.
Goericke, R., Olson, R. J., and Shalapyonok, A.: A novel niche for Prochlorococcus sp. in low-light suboxic environments in the Arabian Sea and the Eastern Tropical North Pacific, Deep-Sea Res. Pt. I, 47, 1183–1205, 2000.
Havskum, H., Schluter, L., Scharek, R., Berdalet, E., and Jacquet, S.: Routine quantification of phytoplankton groups – microscopy or pigment analyses?, Mar. Ecol.-Prog. Ser., 273, 31–42, 2004. Hayakawa, M., Suzuki, K., Saito, H., Takahashi, K., and Ito, S.:
Differences in cell viabilities of phytoplankton between spring and late summer in the northwest Pacific Ocean, Exp. Mar. Biol. Ecol., 360, 63–70, 2008.
Head, E.: , 2002.
Higgins, H., Wright, S., and Schluter, L.: Quantitative interpreta-tion of chemotaxonomic pigment data, in: Phytoplankton Pig-ments: Characterization, Chemotaxonomy and Applications in Oceanography, edited by: Roy, S., Llewellyn, C., Egeland, E., and Johnsen, G., Cambridge University Press, 2011.
Hirata, T., Aiken, J., Hardman-Mountford, N., Smyth, T., and Bar-low, R.: An absorption model to determine phytoplankton size classes from satellite ocean colour, Remote Sens. Environ., 112, 3153–3159, 2008.
Hirata, T., Hardman-Mountford, N. J., Brewin, R. J. W., Aiken, J., Barlow, R., Suzuki, K., Isada, T., Howell, E., Hashioka, T., Noguchi-Aita, M., and Yamanaka, Y.: Synoptic relationships be-tween surface Chlorophyll-a and diagnostic pigments specific to phytoplankton functional types, Biogeosciences, 8, 311–327, doi:10.5194/bg-8-311-2011, 2011.
Hood, R., Laws, E., Armstrong, R., Bates, N., Brown, C., Carlson, C. A., Chai, F., Doney, S. C., Falkowski, P. G., Feely, R. A., Friedrichs, M. A. M., Landry, M. R., Moore, J. K., Nelson, D. M., Richardson, T. L., Salihoglu, B., Schartau, M., Toole, D. A., and Wiggert, J. D.: Pelagic functional group modeling: progress, challenges and prospects, Deep-Sea Res. Pt. II, 53, 459–512, 2006.
Hooker, S. B., Claustre, H., Ras, J., Van Heukelem, L., Berthon, J.-F., Targa, C., van der Linde, D., Barlow, R., and Sessions, H.: The First SeaWiFS HPLC Analysis Round-Robin Experi-ment (SeaHARRE-1), NASA Tech. Memo. 2000-206892, Vol. 14, edited by: Hooker, S. B. and Firestone, E. R., NASA God-dard Space Flight Center, Greenbelt, Maryland, 42 pp., 2000. Hooker, S. B., Van Heukelem, L., Thomas, C. S., Claustre, H., Ras,
J., Barlow, R., Sessions, H., Schluter, L., Perl, J., Trees, C., Stu-art, V., Head, E., Clementson, L., Fishwick, J., Llewellyn, C. A., and Aiken, J.: The second SeaWiFS HPLC analysis round-robin experiment (SeaHAARE-2), NASA, Goddard Space Flight Cen-ter, NASA/TM-2005-212787, 112 pp., 2005.
Of-122 J. Peloquin et al.: MAREDAT global HPLC pigment database
fice, NASA/TM-2009-215849, 97 pp., 2009.
Hooker, S. B., Thomas, C. S., Van Heukelem, L., Schluter, L., Russ, M. E., Ras, J., Claustre, H., Clementson, L., Canuti, E., Berthon, J.-F., Perl, J., Normandeau, C., Cullen, J. J., Kienast, M., and Pinckney, J. L.: The fourth SeaWiFS HPLC analysis round-robin experiment (SeaHAARE-4), NASA, Calibration and Validation Office, NASA/TM-2010-215857, 74 pp., 2010.
Kostadinov, T., Siegel, D., and Maritorena, S.: Retrieval of the par-ticle size distribution from satellite ocean color observations, J. Geophys. Res., 114, C09015, doi:10.1029/2009JC005303, 2009. Kozlowski, W. A., Deutschman, D., Garibotti, I., Trees, C., and Vernet, M.: An evaluation of the application of CHEMTAX to Antarctic coastal pigment data, Deep-Sea Res. I, 58, 350–364, 2011.
Le Qu´er´e, C., Harrison, S., Prentice, C., Buitenhuis, E. T., Aumont, O., Bopp, L., Claustre, H., Cotrim da Cunha, L., Geider, R., Gi-raud, X., Klaas, C., Kohfeld, K. E., Legendre, L., Manizza, M., Platt, T., Rivkin, R., Sathyendranath, S., Uitz, J., Watson, A. J., and Wolf-Gladrow, D.: Ecosystem dynamics based on plankton functional types for global ocean biogeochemistry models, Glob. Change Biol., 11, 2016–2040, 2005.
Letelier, R.: “Phytoplankton.” Ocean Carbon and Biogeochemistry Data System, OCB DMO, WHOI, iPub: nd, http://globec.whoi. edu/jg/dir/globec/nep/ccs/process/, last access: August 2007. Letelier, R., Bidigare, R., Hebel, D., Ondrusek, M., Winn, C.,
and Karl, D.: Temporal variability of phytoplankton commu-nity structure based on pigment analysis, Limnol. Oceanogr., 38, 1420–1437, 1993.
Llewellyn, C., Fishwick, J., and Blackford, J.: Phytoplankton com-munity assemblage in the English Channel: a comparison using chlorophyll a derived from HPLC-CHEMTAX and carbon de-rived from microscopy cell counts, J. Plankton Res., 27, 103– 119, 2005.
Li, W. and Wood, A.: Vertical distribution of North Atlantic ultra-phytoplankton: analysis by flow cytometry and epifluorescence microscopy, Deep-Sea Res., 35, 1615–1638, 1988.
Liu, H., Probert, I., Uitz, J., Claustre, H., Aris-Brosou, S., Frada, M., Not, F., and de Vargas, C.: Haptophyta rule the waves: Ex-treme oceanic biodiversity in non-calcifying prymnesiophytes explains the 19-Hex paradox, P. Natl. Acad. Sci., 106, 12803– 12808, doi:10.1073/pnas.0905841106, 2009.
Lowry, R.: BODC: doi:10.1594/PANGAEA.198134, 198151, 198417, 198419, 2004.
Mackey, M., Mackey, D., Higgins, H., and Wright, S.: CHEM-TAX – a program for estimating class abundances from chemical markers: application to HPLC measurements of phytoplankton, Mar. Ecol.-Prog. Ser., 144, 265–283, 1996.
Mantoura, R. F. C. and Llewellyn, C. A.: The rapid determination of algal chlorophyll and carotenoid pigments and their breakdown products in natural waters by reverse-phase high-performance liquid chromatography, Anal. Chim. Acta, 151, 293–314, 1983. Marty, J.-C.: doi:10.1594/PANGAEA.136858, 2004.
Marty, J.-C., Chiaverini J., Pizay, M. D., and Avril, B.: Seasonal and interannual dynamics of nutrients and phytoplankton pigments in the western Mediterranean Sea at the DYFAMED time-series station (1991–1999), Deep-Sea Res. Pt. II, 49, 1965–1985, 2002. Morel, A., Gentili, B., Chami, M., and Ras, J.: Bio-optical proper-ties of high chlorophyll Case 1 waters, and of yellow-substance-dominated Case 2 waters, Deep-Sea Res. Pt. I, 53, 1439–1559,
2006.
Raitsos, D., Lavendar, S., Maravelias, C., Haralabous, J., Richard-son, A., and Reid, P.: Identifying four phytoplankton functional types from space: An ecological approach, Limonol. Oceanogr., 53, 605–613, 2008.
Ras, J., Claustre, H., and Uitz, J.: Spatial variability of phytoplank-ton pigment distributions in the Subtropical South Pacific Ocean: comparison between in situ and predicted data, Biogeosciences, 5, 353–369, doi:10.5194/bg-5-353-2008, 2008.
Repeta, D.: “Pigments.” Ocean Carbon and Biogeochemistry Data System, OCB DMO, WHOI, iPub: 14 January 2003, http:
//usjgofs.whoi.edu/jg/dir/jgofs/nabe/atlantisII/, last access: July 2010.
Siegel, D. A., Maritorena, S., Nelson, N. B., and Behrenfeld, M. J.: Independence and interdependencies of global ocean color prop-erties: reassessing the bio-optical assumption, J. Geophys. Res., 110, C07011, doi:10.1029/2004JC002527, 2005.
Smith Jr., W. O., Shields, A., Peloquin, J., Catalano, G., Tozzi, S., Dinniman, M., and Asper, V.: Interannual variations in nutri-ents, net community production, and biogeochemical cycles in the Ross Sea, Deep-Sea Res. Pt. II, 53, 815–833, 2006. Suzuki, K., Minami, C., Liu, H., and Saino, T.: Temporal and
spa-tial patterns of chemotaxonomic algal pigments in the subarc-tic Pacific and the Bering Sea during the early summer of 1999, Deep-Sea Res. Pt. II, 49, 5685–5704, 2002.
Suzuki, K., Hinuma, A., Saito, H., Kiyosawa, H., Liu, H., Saino, T., and Tsuda, A.: Responses of phytoplankton and heterotrophic bacteria in the northwest subarctic Pacific to in situ iron fertiliza-tion as estimated by HPLC pigment analysis and flow cytometry, Prog. Oceanogr., 64, 167–187, 2005.
Suzuki, K., Saito, H., Isada, T., Hattori-Saito, A., Kiyosawa, H., Nishioka, J., McKay, R. M., Kuwata, A., and Tsuda, A.: Commu-nity structure and photosynthetic physiology of phytoplankton in the northwest subarctic Pacific during an in situ iron fertilization experiment (SEEDS-II), Deep-Sea Res. Pt. II, 56, 2733–2744, 2009.
Trees, C., Clark, D., Bidigare, R., Ondrusek, M., and Mueller, J.: Accessory Pigments versus Chlorophyll a concentrations within the Euphotic Zone: A Ubiquitous Relationship, Limnol. Oceanogr., 45, 1130–1143, 2000.
Uitz, J., Claustre, H., Morel, A., and Hooker, S.: Vertical distri-bution of phytoplankton communities in open ocean: An as-sessment based on surface chlorophyll, J. Geophys. Res., 111, C08005, doi:10.1029/2005JC003207, 2006.
Van den Meersche, K., Soetaert, K., and Middelburg, J.: A Bayesian compositional estimator for microbial taxonomy based on biomarker, Limnol. Oceanogr.-Meth., 6, 190–199, 2008. Van Heukelem, L. and Thomas, C. S.: Computer-assisted
high-performance liquid chromatography method development with applications to the isolation and analysis of phytoplankton pig-ments, J. Chromatogr. A, 910, 31–49, 2001.
marine phytoplankton : separation of chlorophyll a from divinyl-chlorophyll a and zeaxanthin from lutein, J. Plankton Res., 18, 2377–2382, 1996.
Vidussi, F., Claustre, H., Manca, B., Luchetta, A., and Marty, J.-C.: Phytoplankton pigment distribution in relation to upper thermo-cline circulation in the eastern Mediterranean Sea during winter, J. Geophys. Res., 106, 939–956, 2001.
Wasmund, N.: Pigment concentration on bottle station BS960823.KTS 290, doi:10.1594/PANGAEA.399756, 399758-61, 2006.
Williams, R. and Claustre, H.: Chlorophylls and carotenoids as biomarkers of populations and processes involved in the trans-formation of the particulate organic matter at the biotrans site (45◦
N, 18◦
W), Deep-Sea Res. Pt. II, 38, 347–355, 1991.
Weber, T. and Deutsch, C.: Ocean nutrient ratios governed by plank-ton biogeography, Nature, 467, 550–554, 2010.
Weber, T. and Deutsch, C.: Oceanic nitrogen reservoir regulated by plankton diversity and ocean circulation, Nature, 489, 419–422, 2012.
Wright, S., van den Enden, R., Pearce, I., Davidson, A., Scott, F., and Westwood, K.: Phytoplankton community structure and stocks in the Southern Ocean (30–80◦
E) determined by CHEM-TAX analysis of HPLC pigment signatures, Deep-Sea Res. Pt. II, 57, 758–778, 2010.